How to track IGTV analytical data
Building IGTV content but struggling to track key metrics clearly over a significant amount of time? We’re here to help. Minter.io is one of the few tools to offer IGTV analytics, and we can’t wait to help you gain more insight into your IGTV content, with new features on our platform.
Why Track IGTV Data?
If you want to build a successful social media presence, with content that really matters to your audience, you need to know what is working for your brand and what isn’t. The more data you have to hand, the more easily you can craft suitable content, saving you time, money and headaches in the long run. Instagram is the most popular social media platform for following brands, so the more effective your business content on the platform, the better.
However, having lots of data won’t mean a whole lot to your social media strategy if it’s hard to understand, unclear and awkward to navigate. That’s why at Minter.io we’ve put together a simple to use tool, with a user-friendly layout and support from real people if you have any questions along the way.
What IGTV Data Can I Track?
Having a wide range of trackable data is imperative so that you can have a clear picture of your IGTV content.
With Minter.io you can track your IGTV:
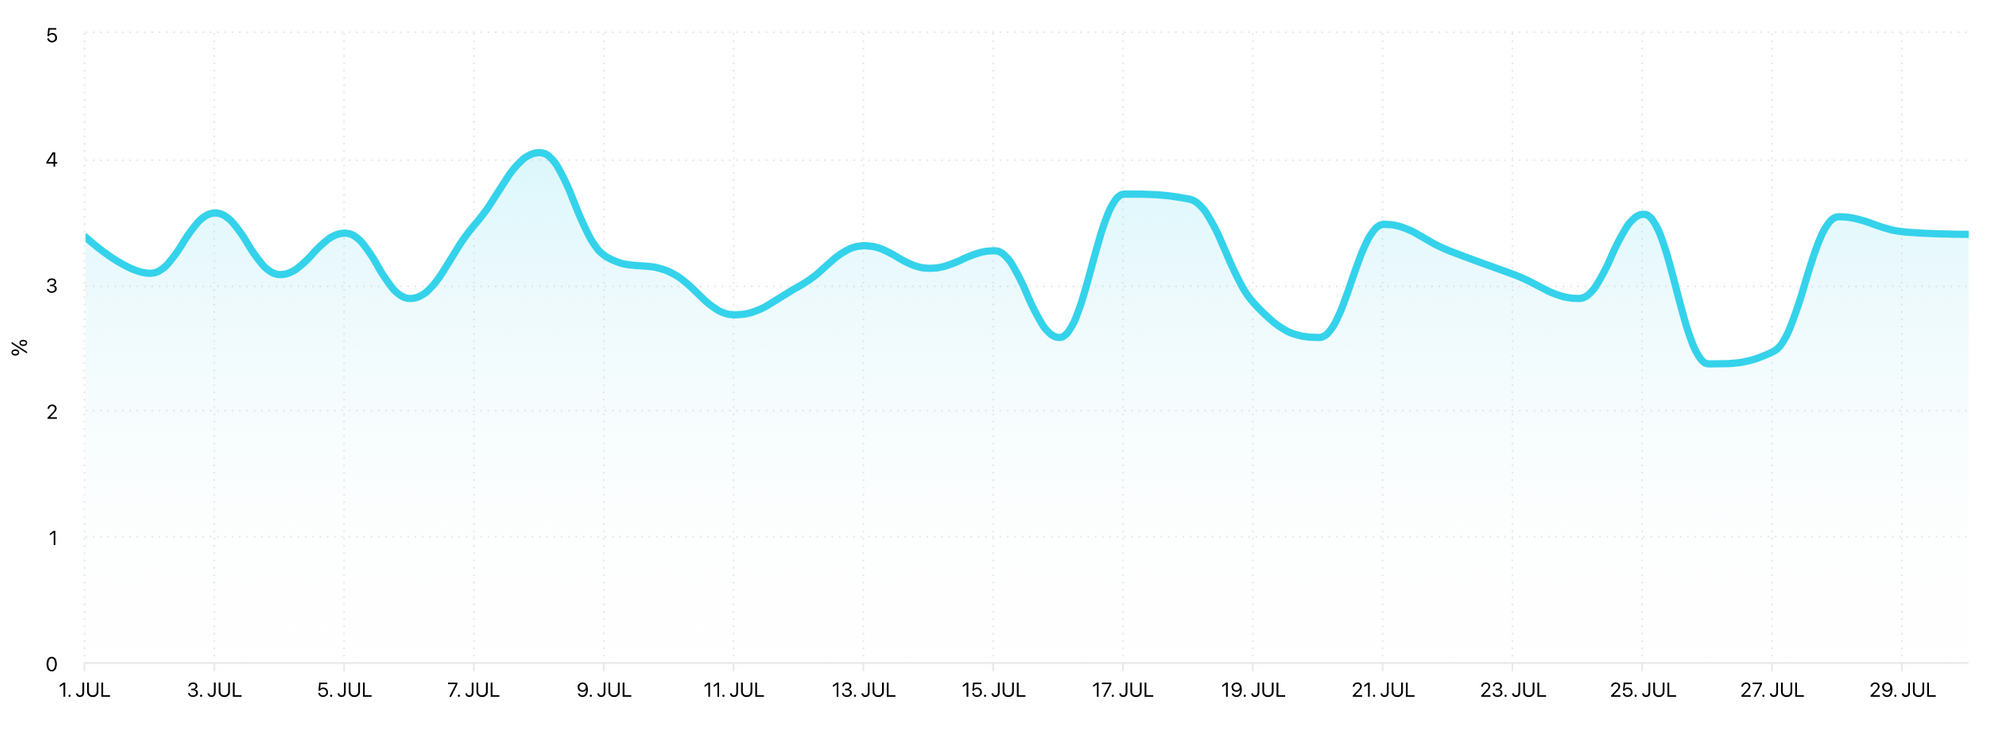
- Engagement Rate
Is your audience engaging with your content when they see it? The higher the engagement rate, the more actively viewers are interacting with your content through likes and comments.
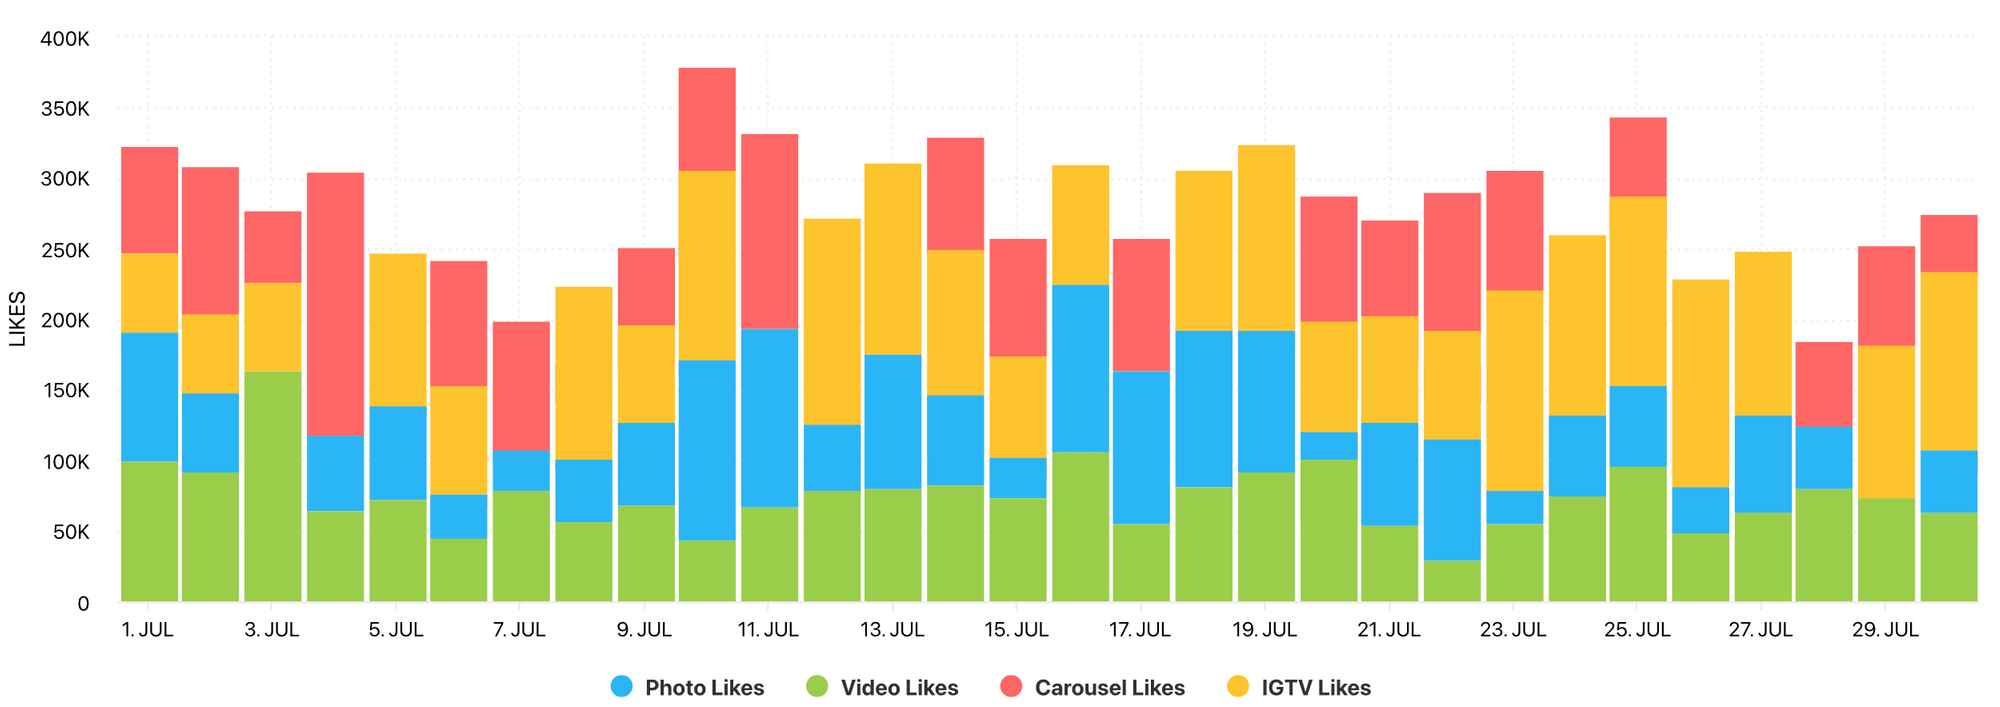
- Likes
How many likes are your IGTV posts getting? Likes are a form of interaction on Instagram, and the more likes you get on a post, the more Instagram pushes this content to more viewers.
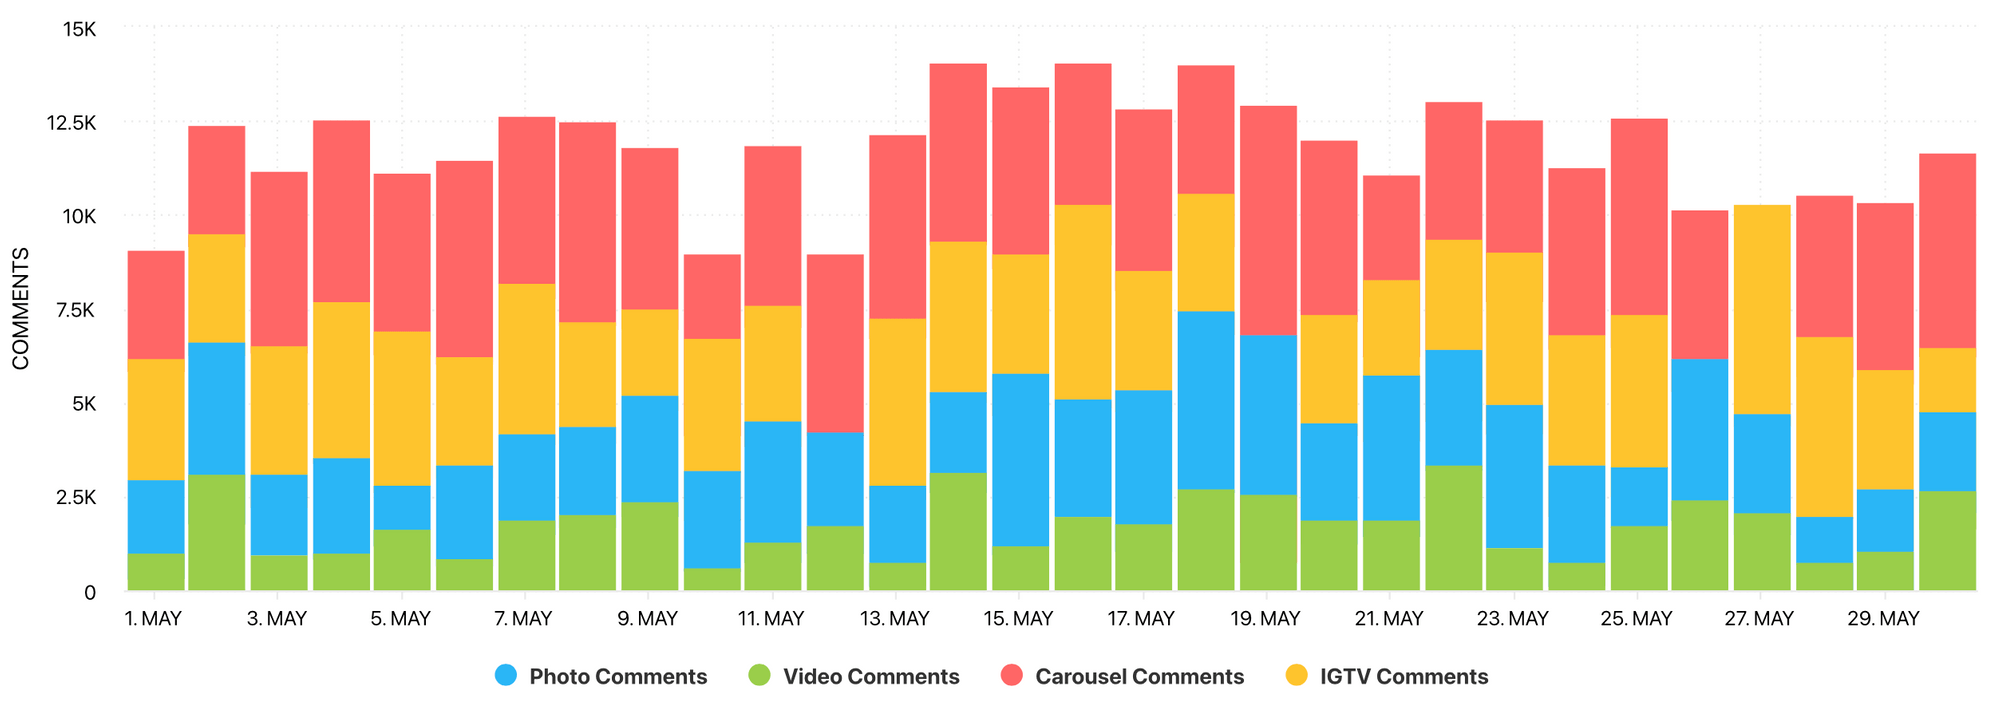
- Comments
Another brilliant form of interaction is commenting. When your audience comments on IGTV content, you can learn what they think and feel about the content you are sharing. Commenting takes more effort than a simple like, so this is really worth noting, as well as the content of the individual comments.
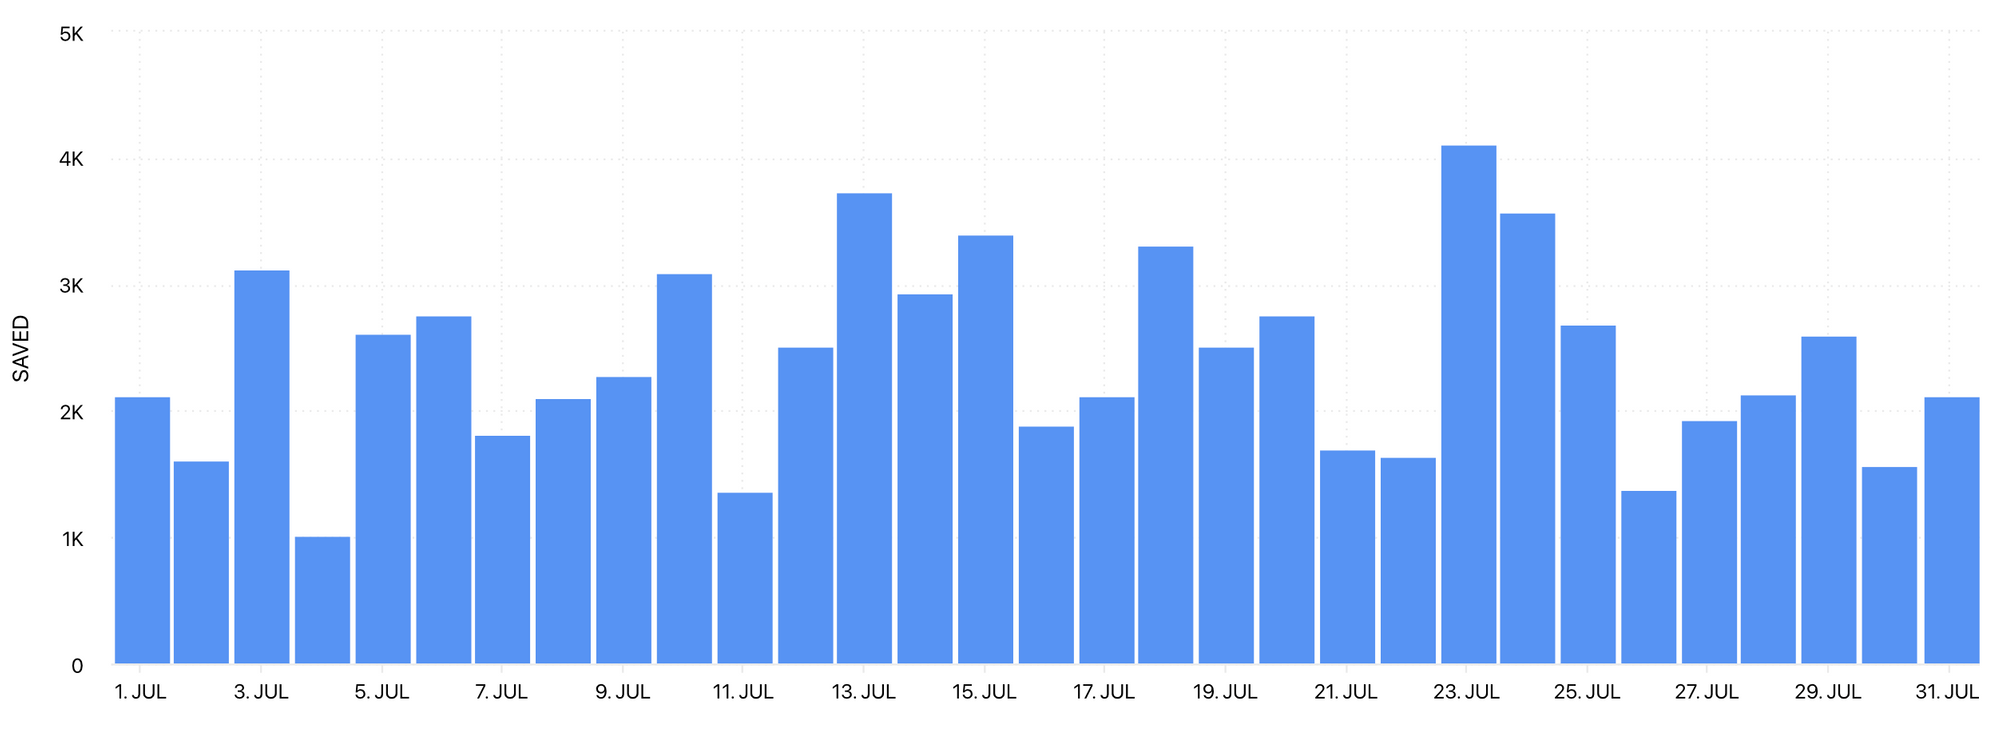
- Saves
Saves are a feature not to be overlooked. When a viewer saves your IGTV post, they can access it easily from their own personal collection of saved content. This gets your content more views over a longer period of time.
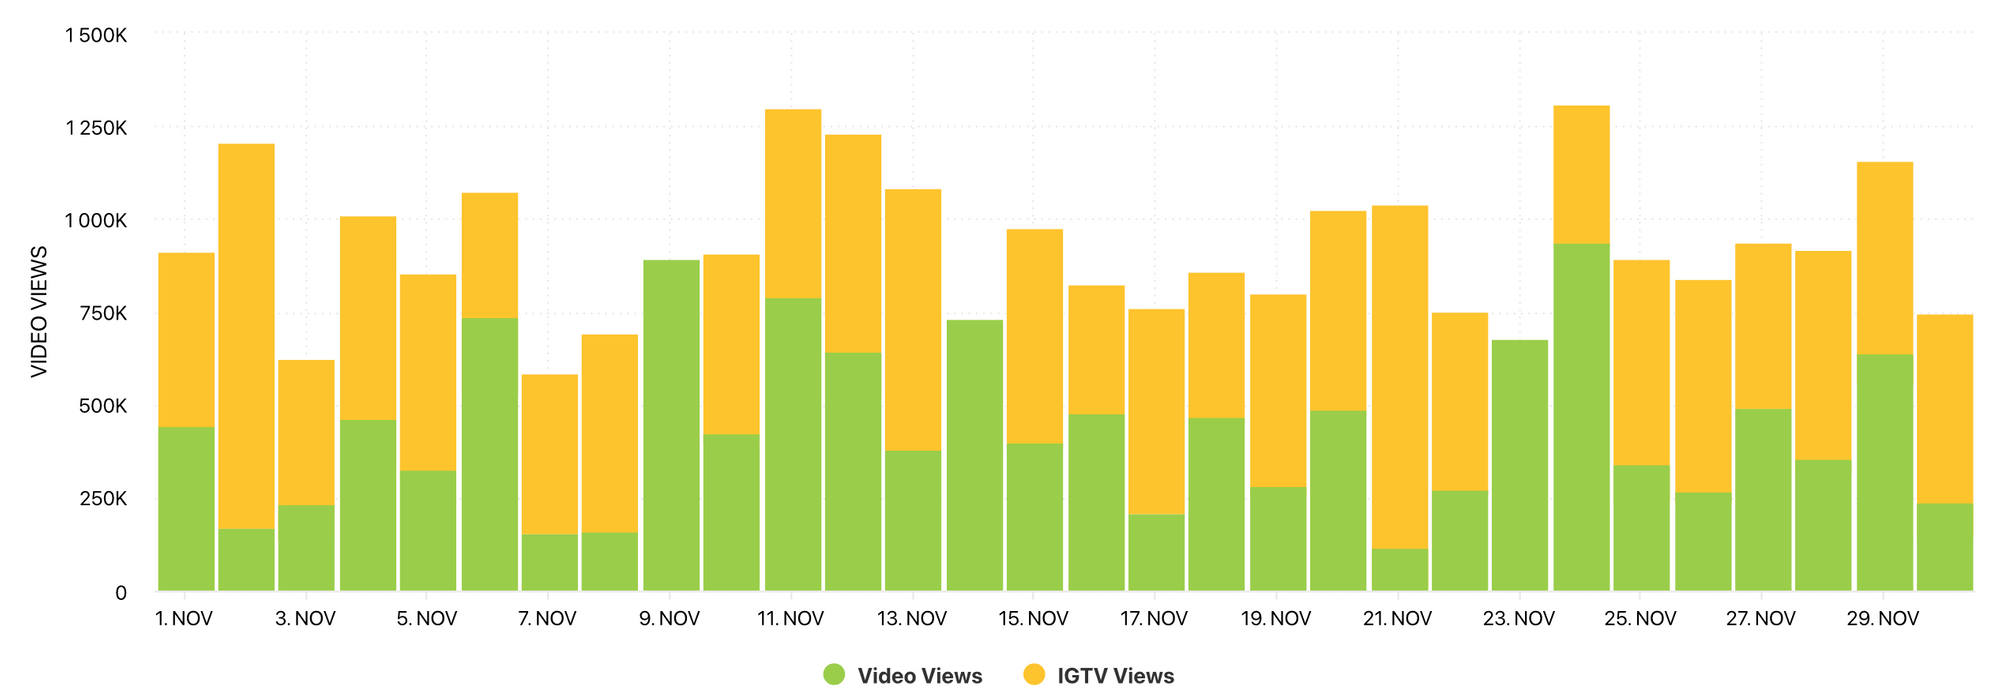
- Video Views
Separate from other types of Instagram content, videos views detail the amount of times your video was viewed. This is tailored specifically for video content such as IGTV.
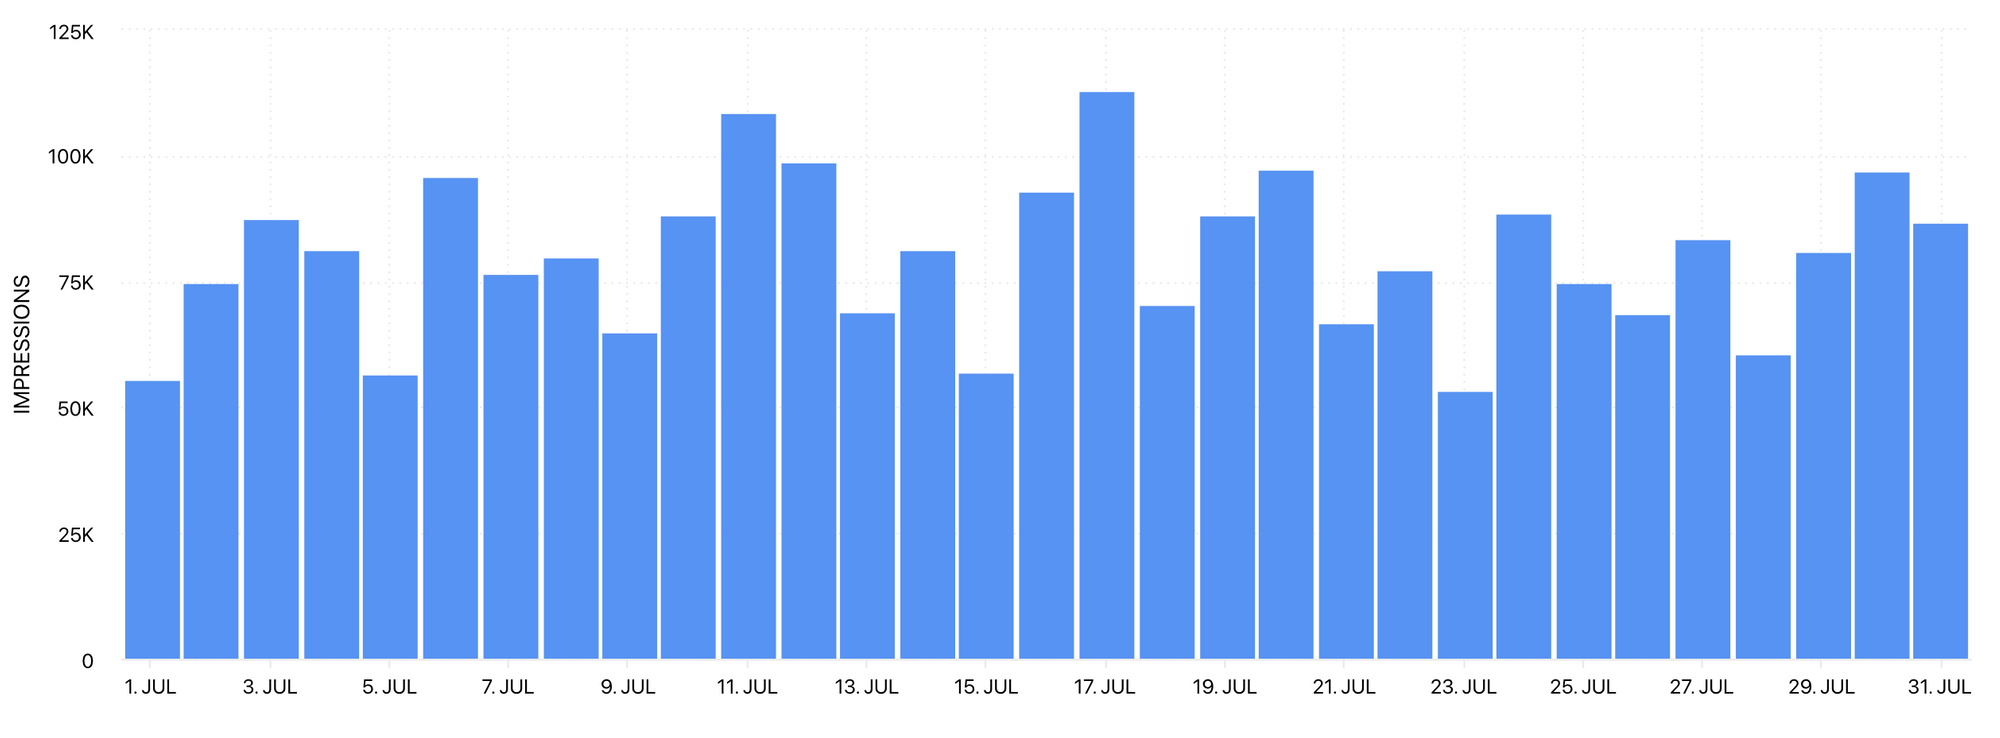
- Impressions
How many times is your IGTV content being seen? Impressions include people viewing your content more than once and is an overall figure detailing how many times Instagram is putting your content in front of viewers, in addition to viewers finding your content independently. Use this metric in conjunction with reach. It’s a great sign if viewers are returning to your content.
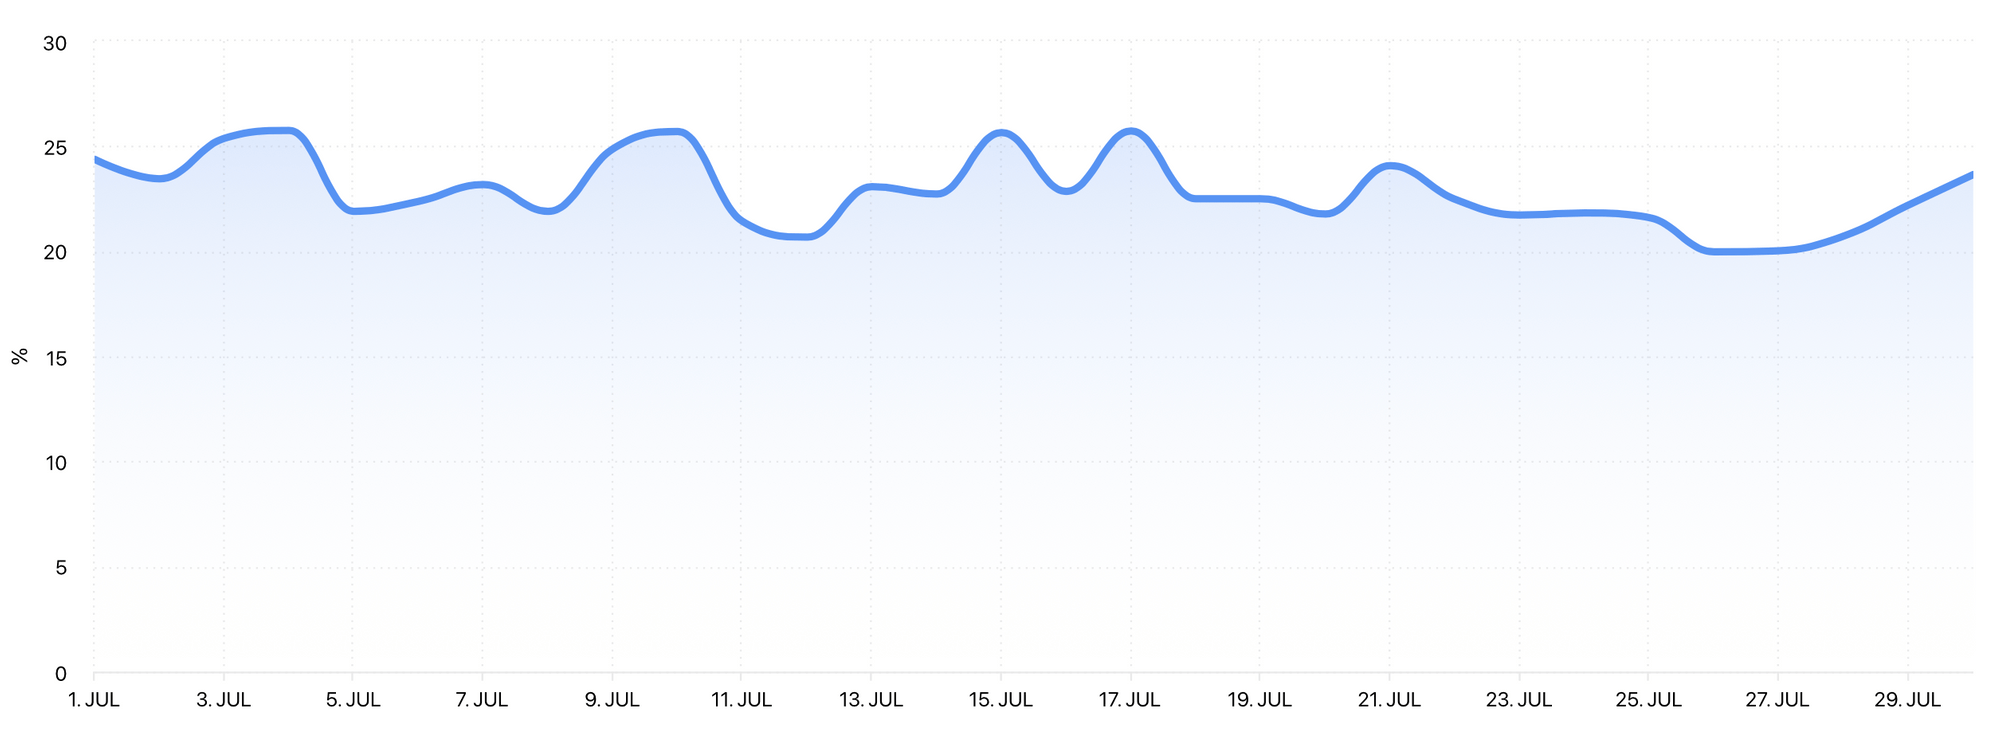
- Reach
How many people is your IGTV post being seen by? Reach details the amount of unique viewers that have seen this specific piece of content. Tracking your reach rate is a good way to gauge whether you are reaching a similar amount of people with your content, as well as keeping tabs on any fluctuations. Use this information to notice trends in your content, craft posts that achieve higher reach and make decisions on when to boost specific types of content to a larger audience.
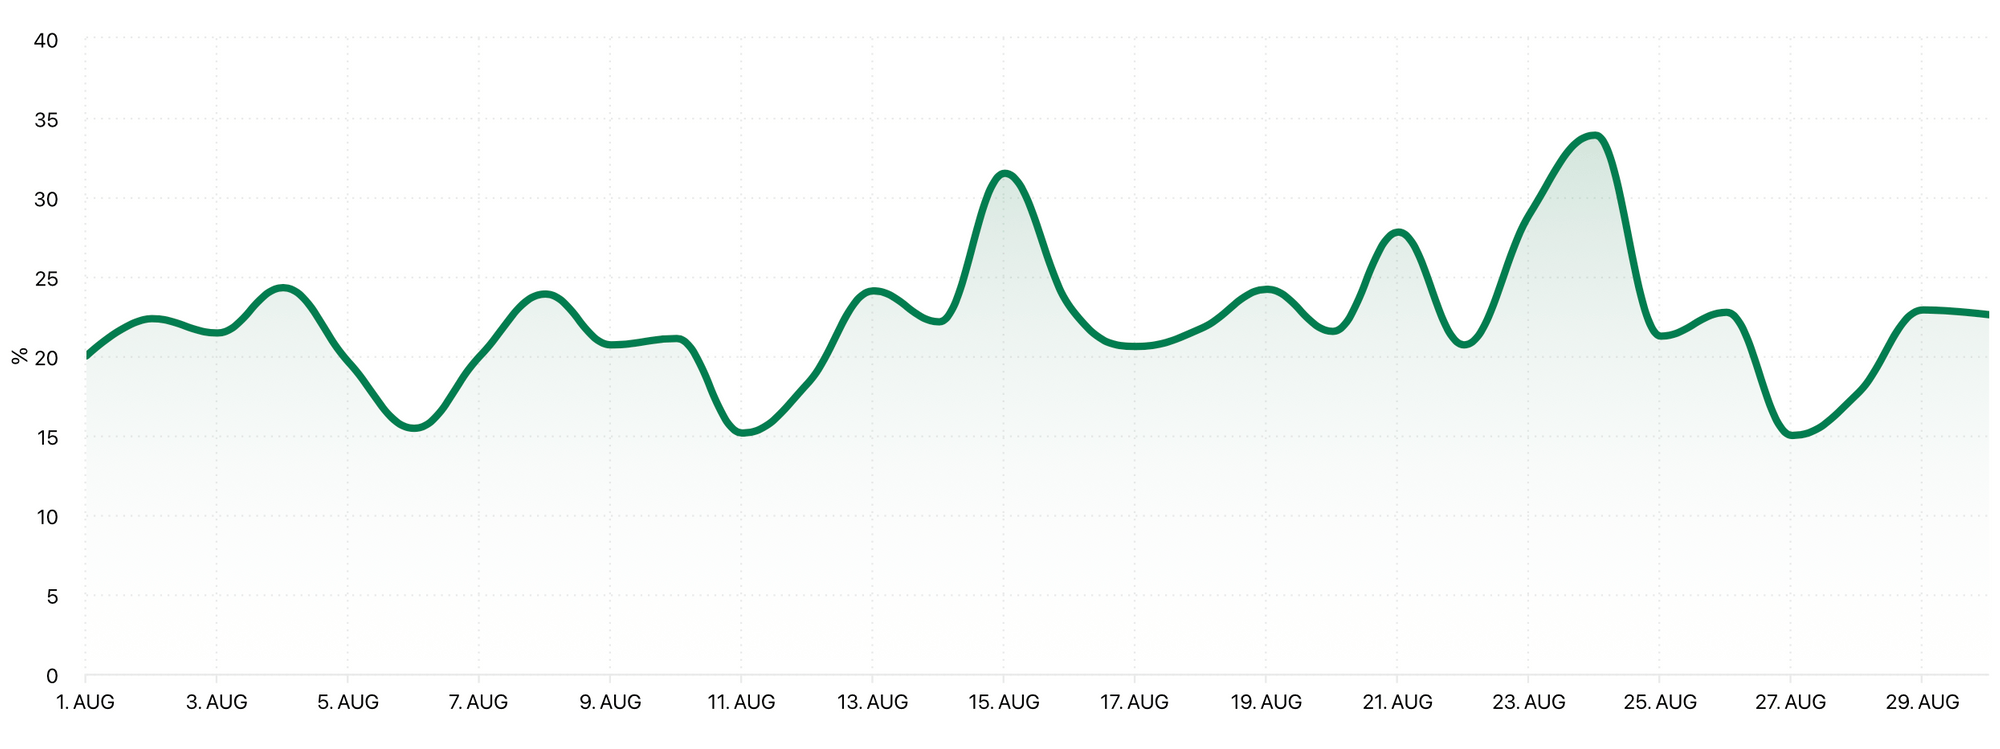
- Engagement Rate by Reach
When your IGTV content is reaching people, how many are engaging with the content? Tracking the engagement rate by reach ensures that you are making content that your audience cares enough about to comment on, like and save.
- Follower Change
Did you gain or lose followers when you published your content? Knowing your follower change can help you understand which types of content, subject matter and style give you spikes, dips or help you maintain your amount of followers.
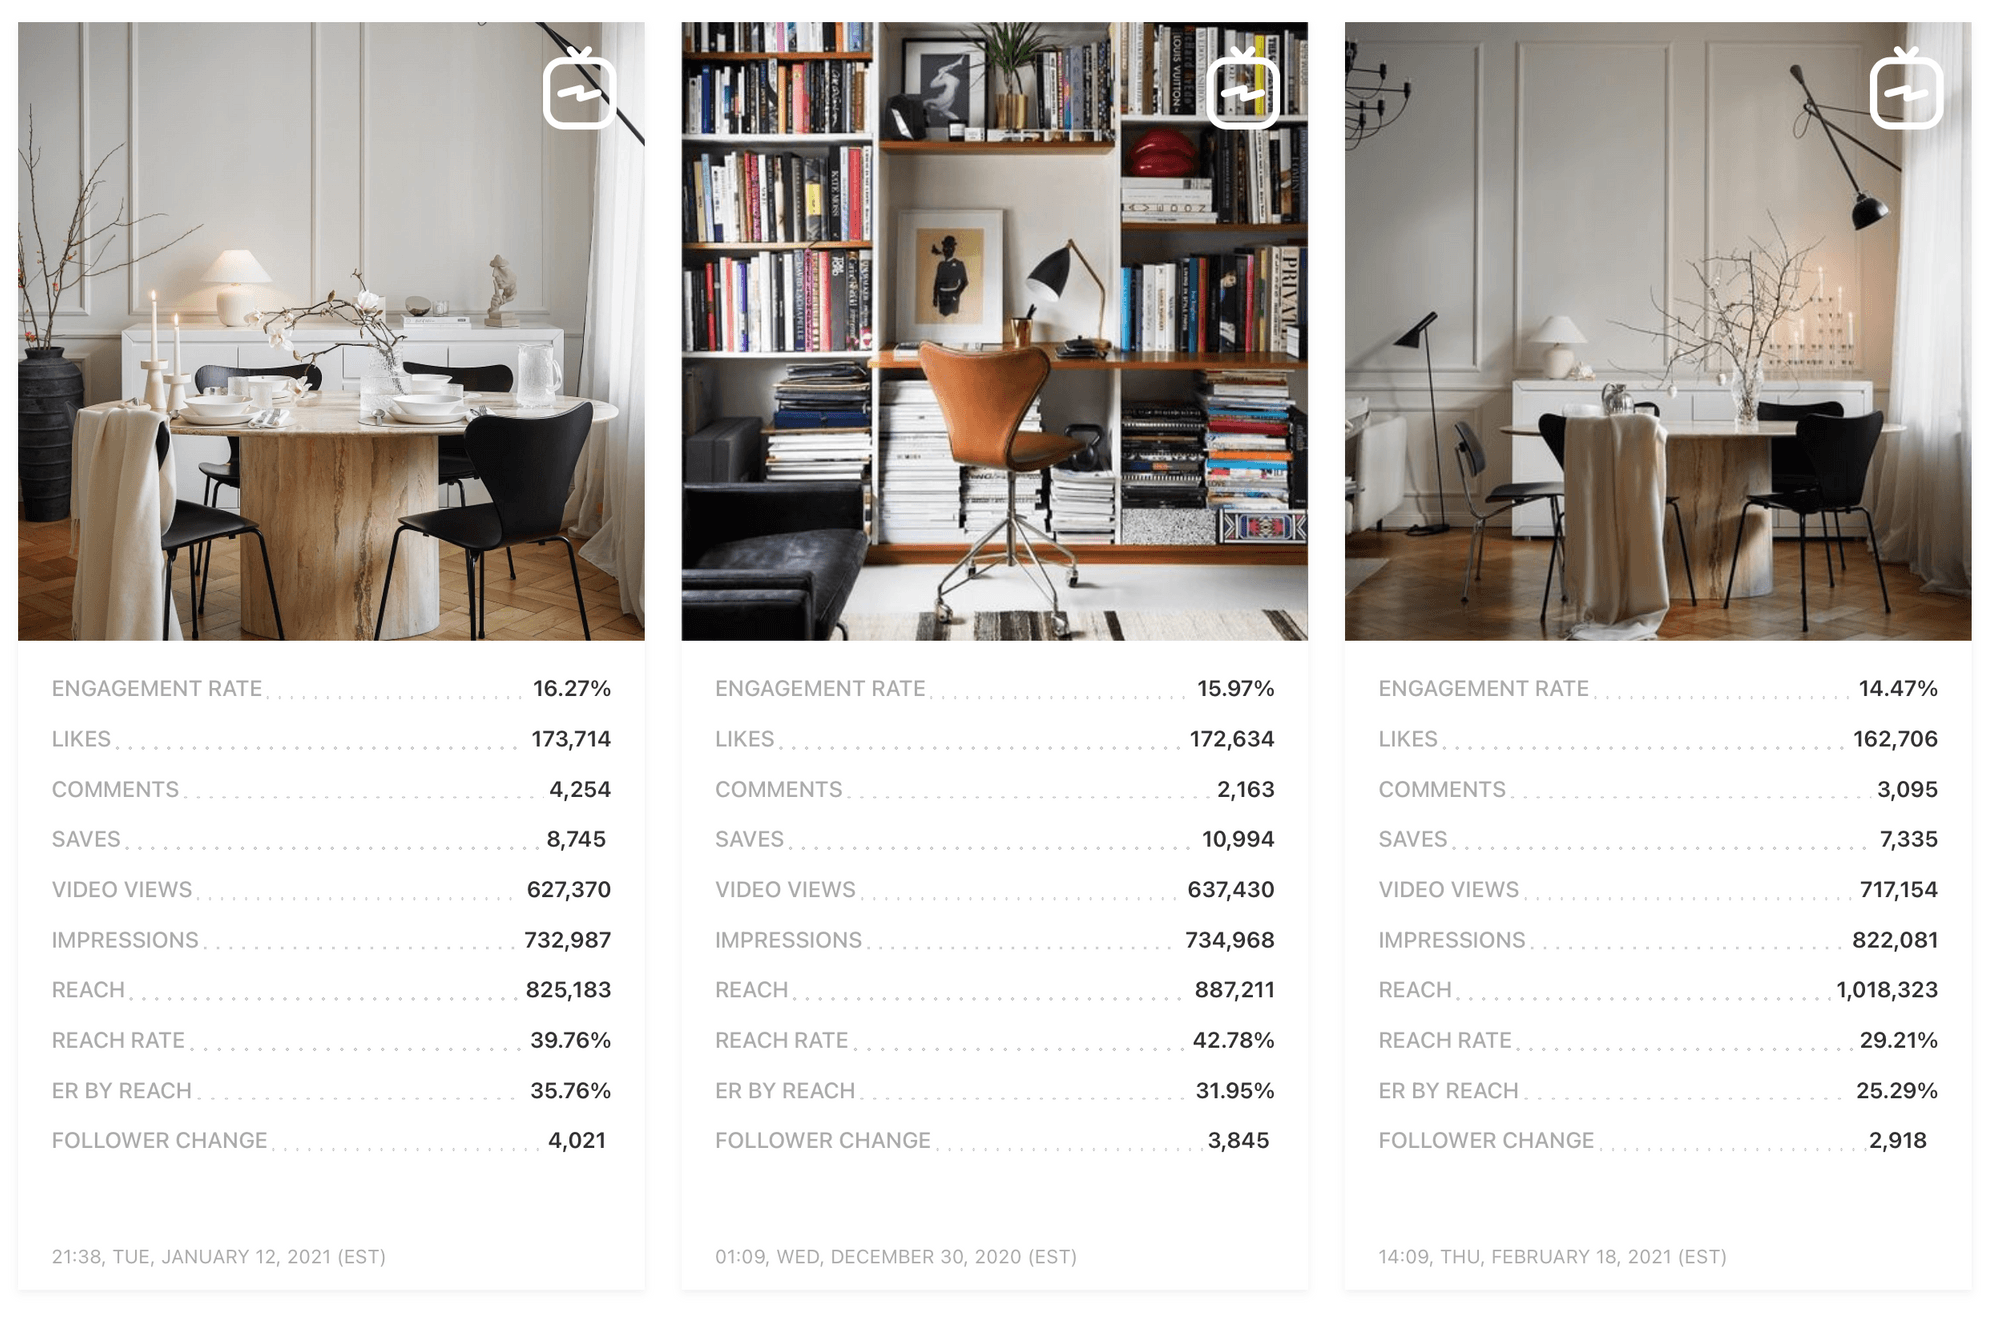
Compare Types Of Content
You can compare how your IGTV content is performing in comparison with other types of posts such as photos, videos and carousels. This information arms you with even more knowledge, so you can make informed decisions about the types of posts your specific audience is responding to and resonating with. You can also check out your top IGTV posts, ranking them through your chosen metric such as engagement rate, likes or impressions.
IGTV Data For Hashtag Tracking
IGTV analytical data is also shown when you’re tracking a specific hashtag. This helps you see the types of content your selected hashtag is being used in conjunction with, and the performance of the content. You can track IGTV information such as the number of posts, likes, comments, and top posts (by interactions, likes, comments and date) when you are tracking a hashtag. Having this information to hand helps you shape your hashtag campaign effectively.
IGTV data is available on all Minter.io plans, so what are you waiting for?
Try Minter.io now →