Instagram Monthly Report: April 2017
Every month, we (Minter.io) will give you an overview of the latest stats and best performing brands on Instagram. Here’s our report for April 2017!
Popular hashtags in April 2017
#beautiful
#style
#fashion
#love
#beauty
#nature
#food
#spring
#travel
#instagood
#design
#luxury
#ootd
#fitness
#art
#instadaily
#repost
#photography
#picoftheday
#photooftheday
Best Time to Post
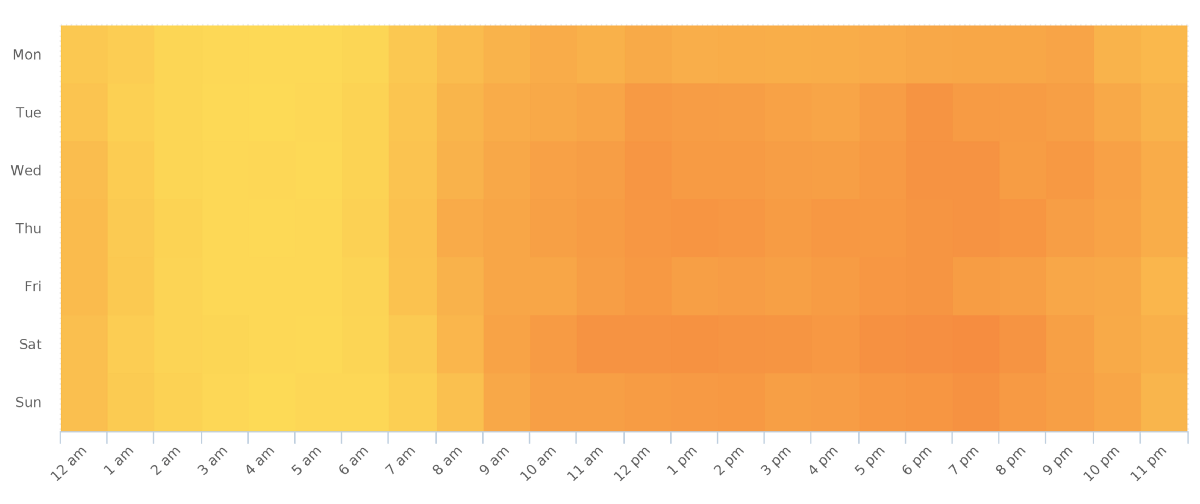
We’ve analyzed user activity on Instagram in the US and Europe to identify the best times for brands to post for engagement with their audience.
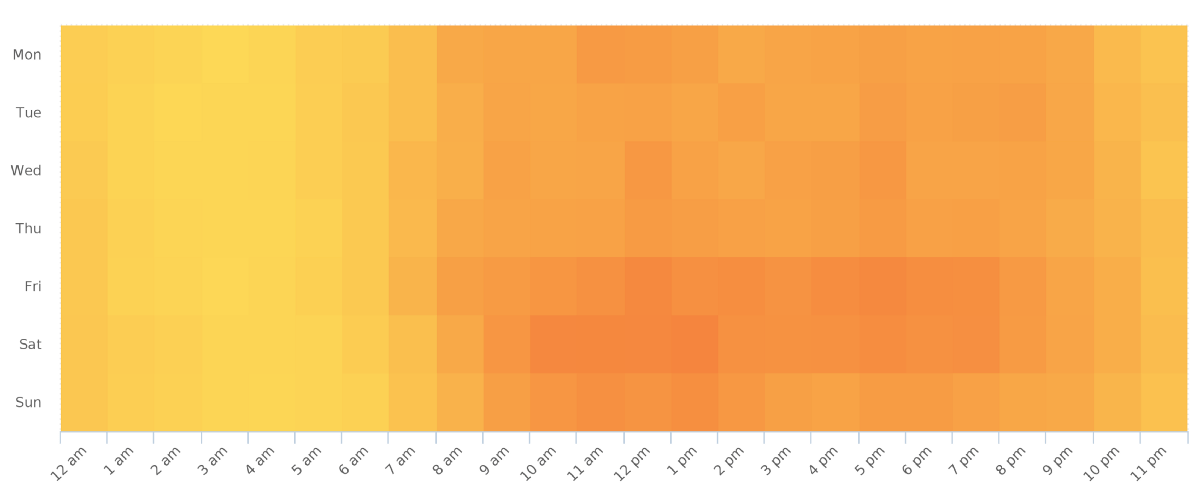
In April, Instagram audience shifted to weekends. Users in the US were especially active on Saturdays (10am — 2pm and 5pm — 8pm) and Fridays (noon and 5pm).
Best times to post to engage European audience were weekday evenings (6pm — 8pm) and Saturdays (11am — 2pm and 5pm — 8pm).
Most engaging Instagram posts from brands in April 2017
For each type of post: photo, video and carousel, we’ve picked top 5 post by the Engagement rate.
How does Minter.io calculate the Engagement rate?
Engagement rate = (Likes + Comments) / Followers
Top 5 Instagram Photos from Brands in April 2017
Engagement rate: 7.21%
Engagement rate: 7.1%
Engagement rate: 6.26%
Engagement rate: 5.9%
Engagement rate: 5.78%
Top 5 Instagram Videos from Brands in April 2017
Engagement rate: 3.82%
Engagement rate: 3.51%
Engagement rate: 3.45%
Engagement rate: 3.05%
Top 5 Instagram Carousels from Brands in April 2017
Engagement rate: 4.27%
Engagement rate: 4.26%
Engagement rate: 3.77%
Engagement rate: 3.36%
Engagement rate: 3.26%
Get your own Instagram report on Minter.io