What Your Business Can Learn From Benchmarks
Have you ever wondered how your Instagram account stacks up against similar accounts? With 95 million posts published each day and users dishing out 4.2 billion likes per day, it makes sense to put yourself in the running to get as much attention on your brand as possible. Did you know that 60% of users seek out and discover new products on Instagram?
How do you know your Instagram account is performing well?
This is where benchmarks come in. According for dictionary.com a benchmark is “a standard or point of reference against which things may be compared”. By comparing the activity on your account with similar accounts, you can create informed decisions based on a relevant reference point.
Minter.io ranks your Instagram business account in a cohort of similar size, measuring your account with others’ in terms of follower growth, number of posts, engagement, reach rate and stories.
N.B. Hover over the bar graph to see exact percentages and figures for even more guidance towards growing your Instagram audience and engagement.
Let’s have a look at how Minter.io benchmarks can help your Instagram presence progress…
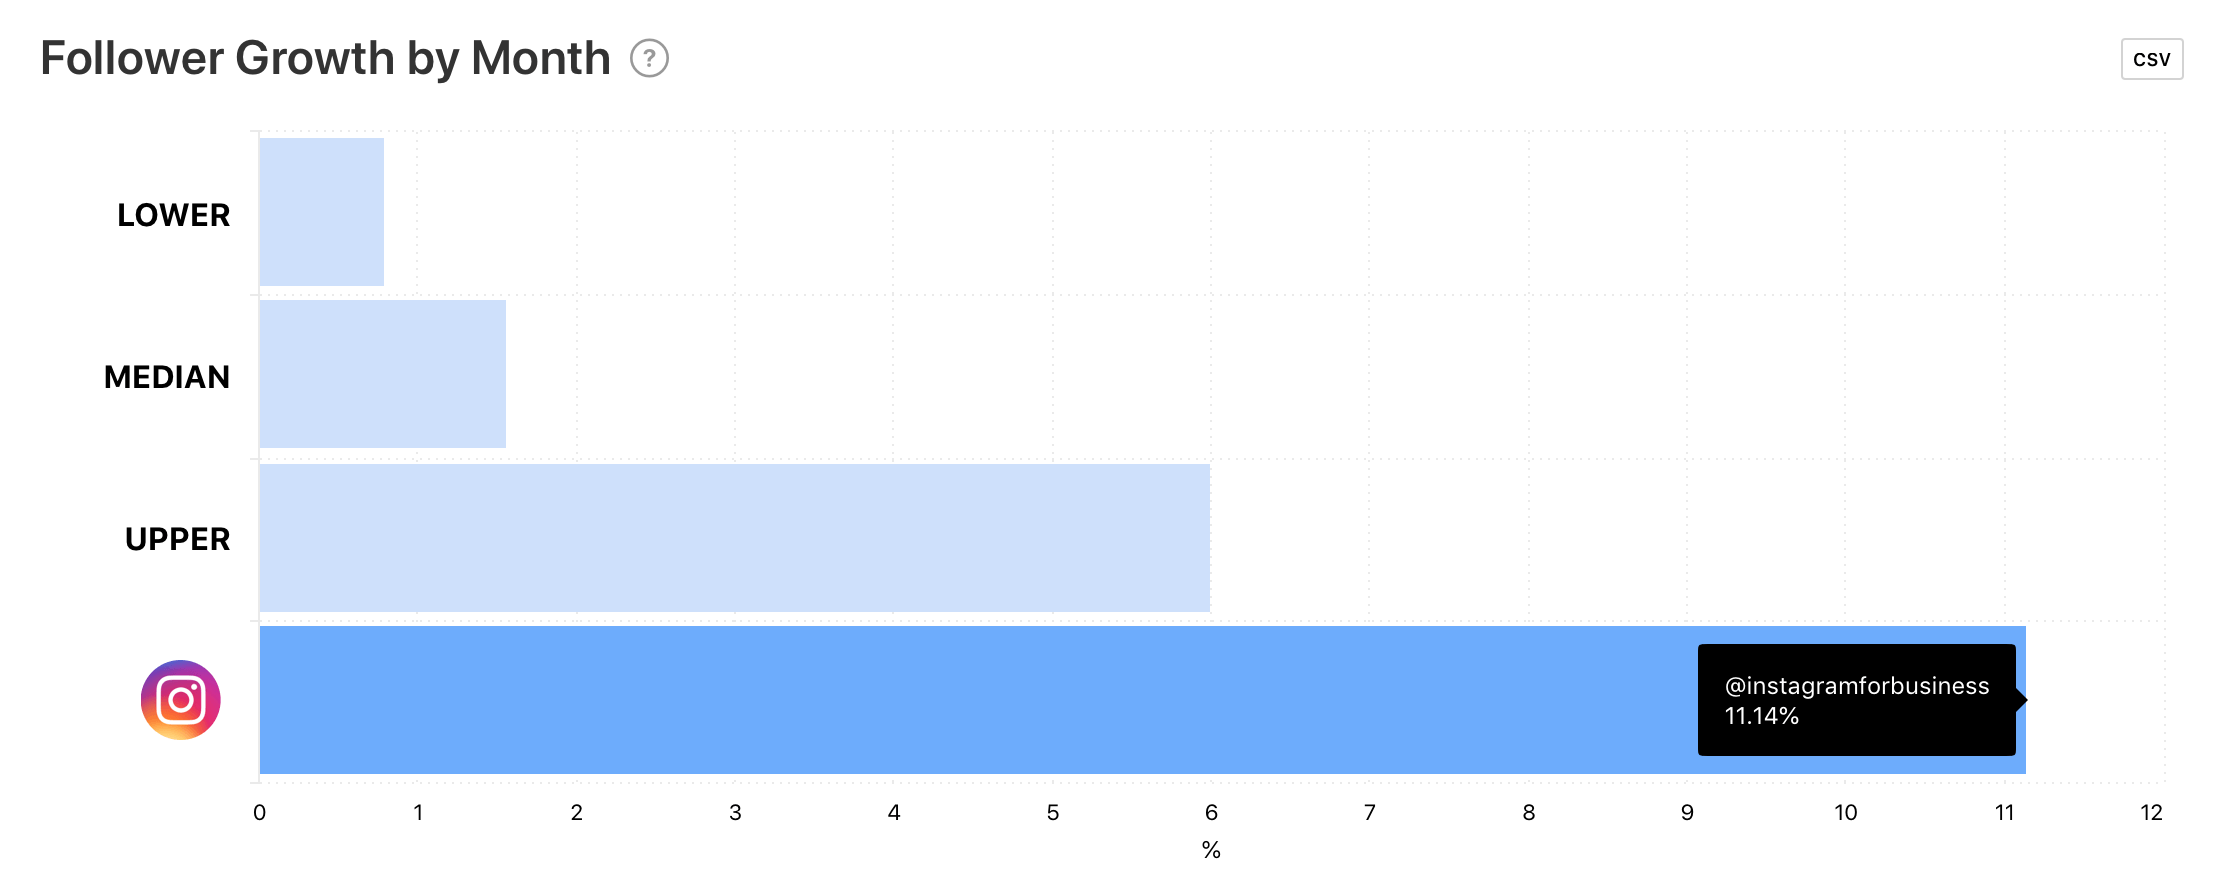
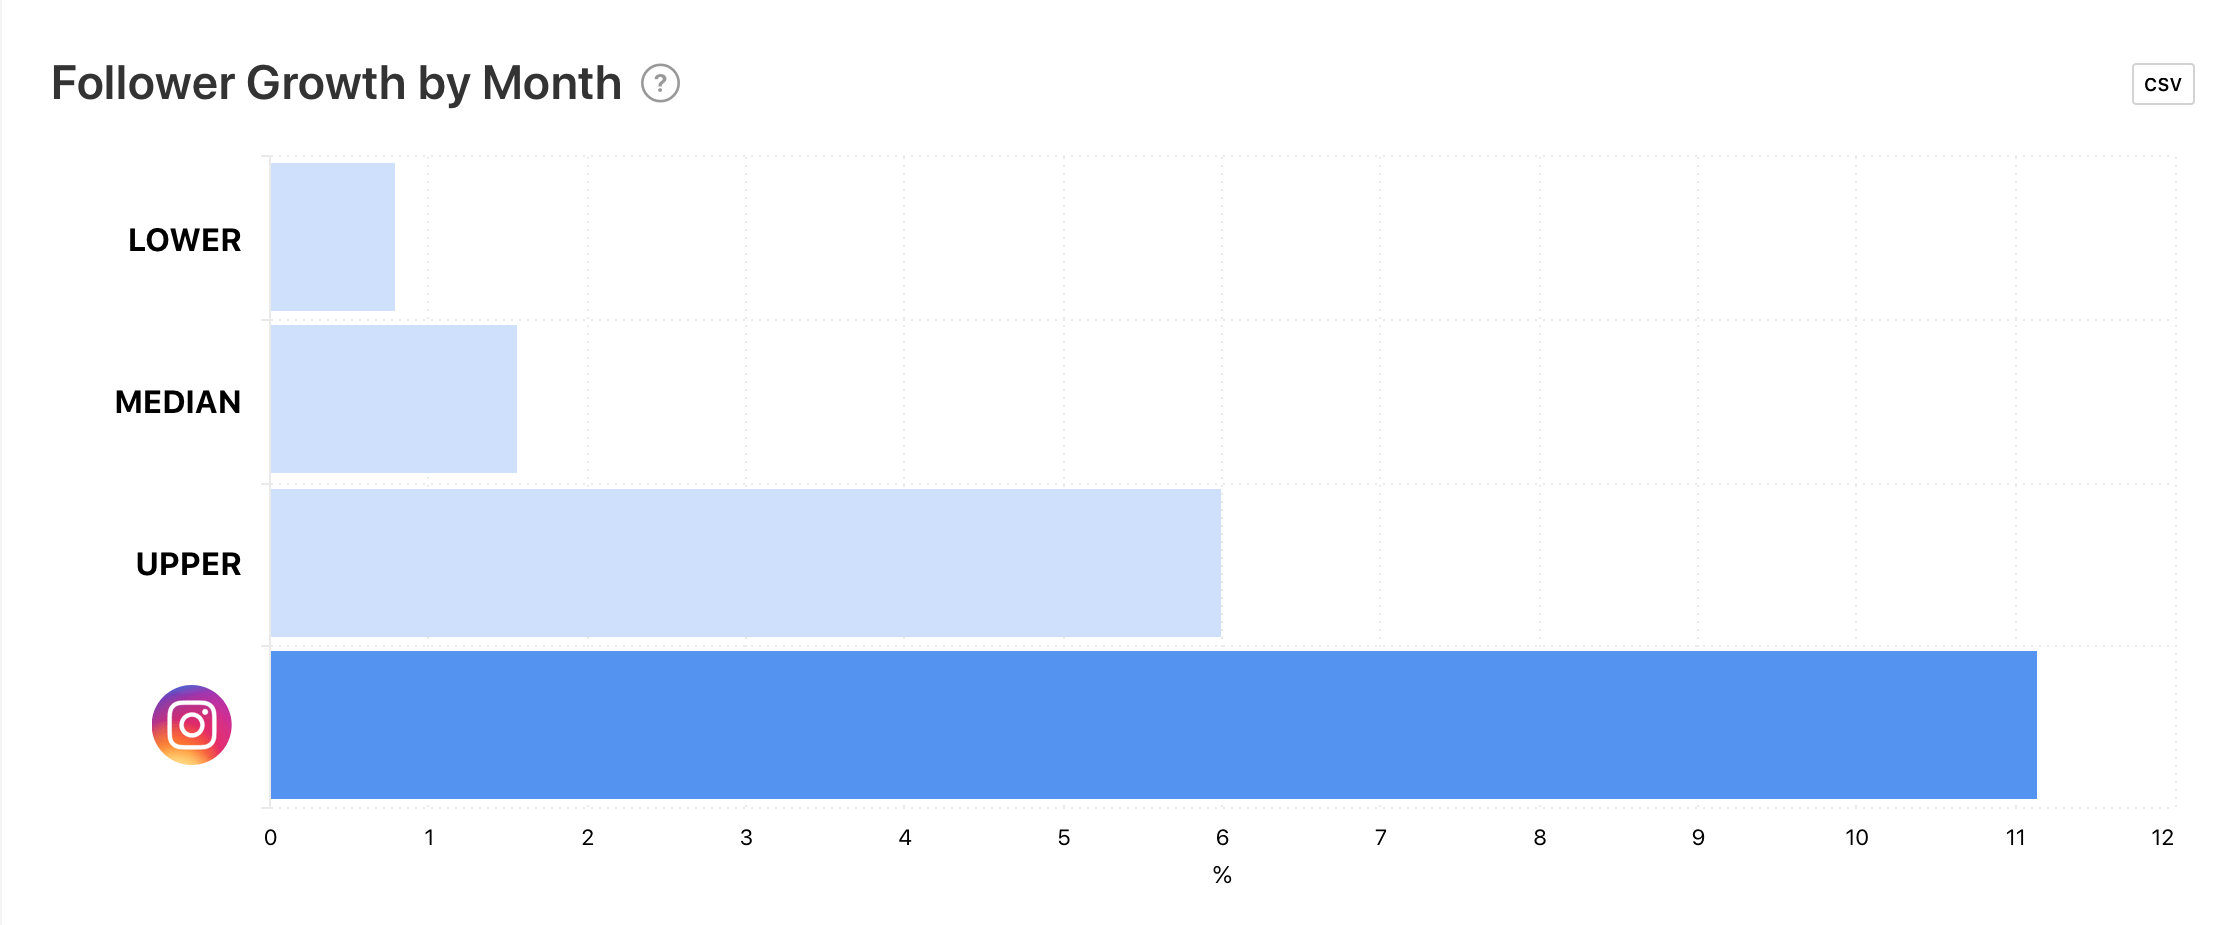
Follower Growth by Month
This is the average follower growth percentage compared with other Instagram accounts in this cohort.
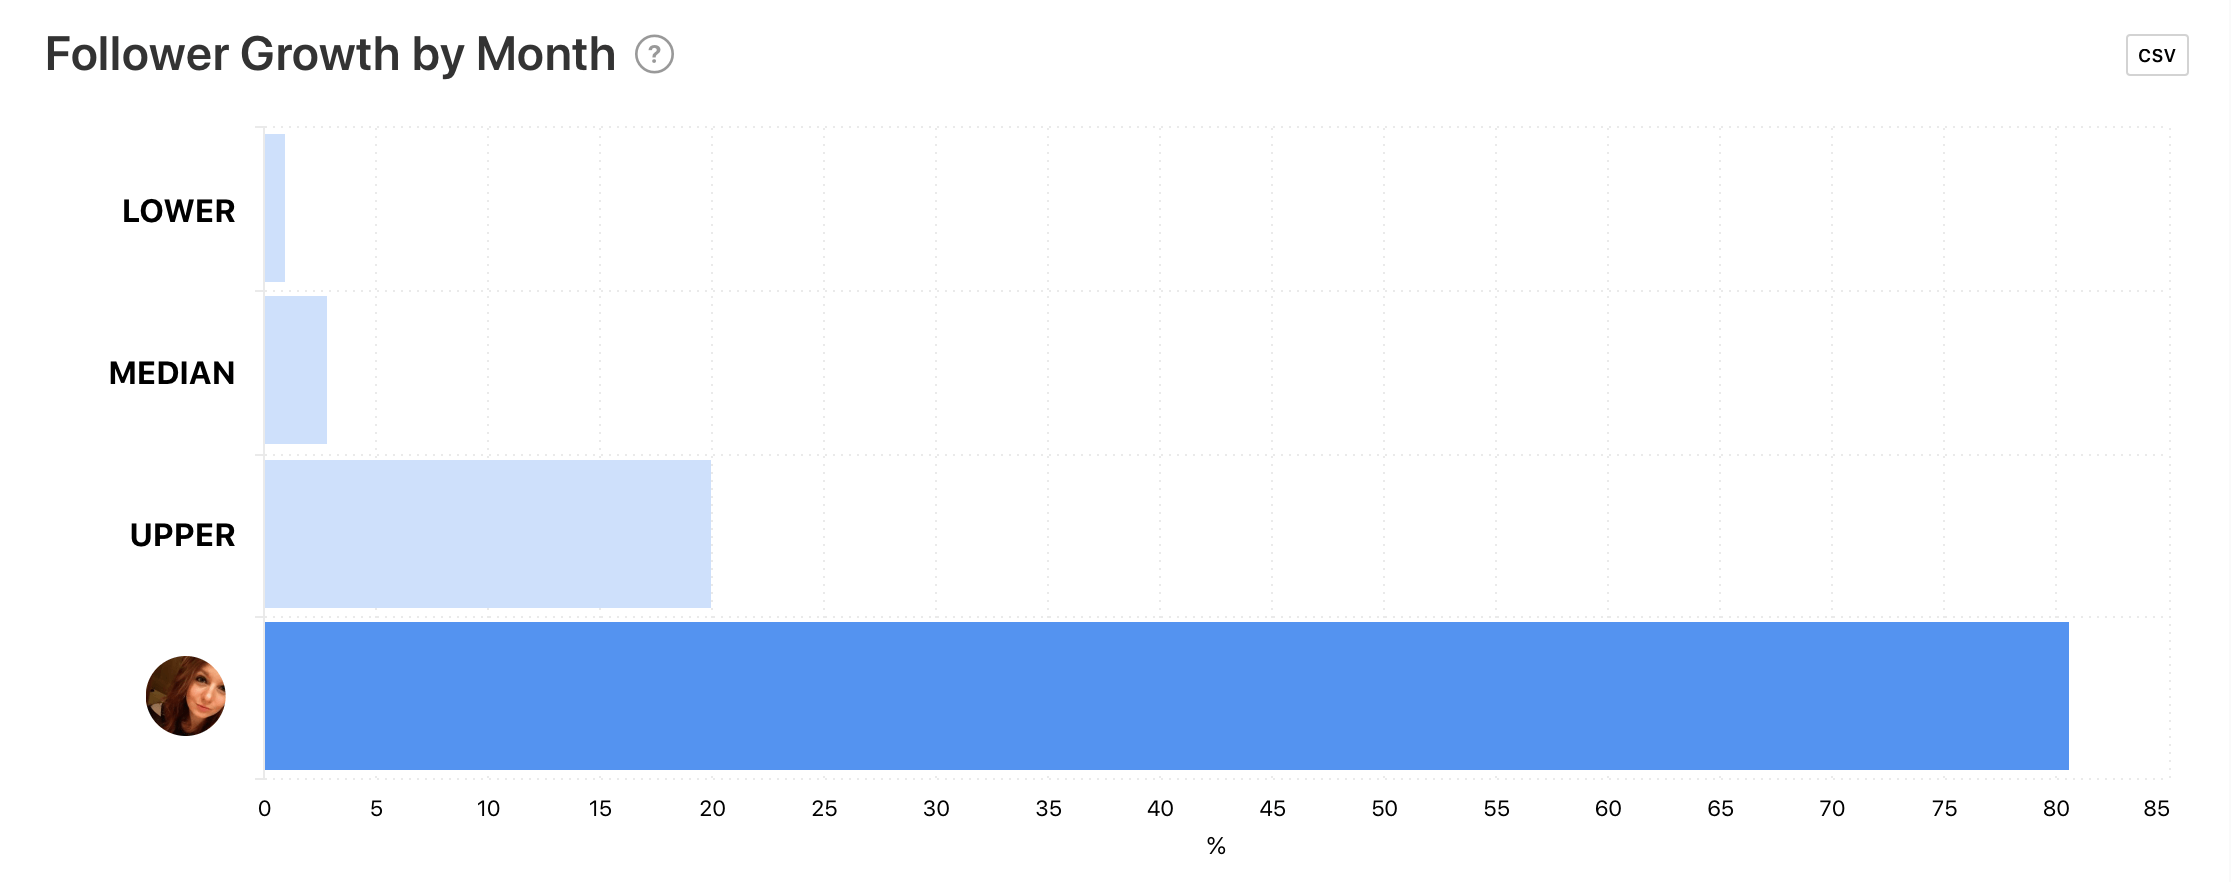
Knowing the speed of your growth in comparison with others can be an indicator of your brand awareness and popularity. Aiming to keep your average follower growth high, by remaining relevant on the platform, can stand you in good stead against your competitors.
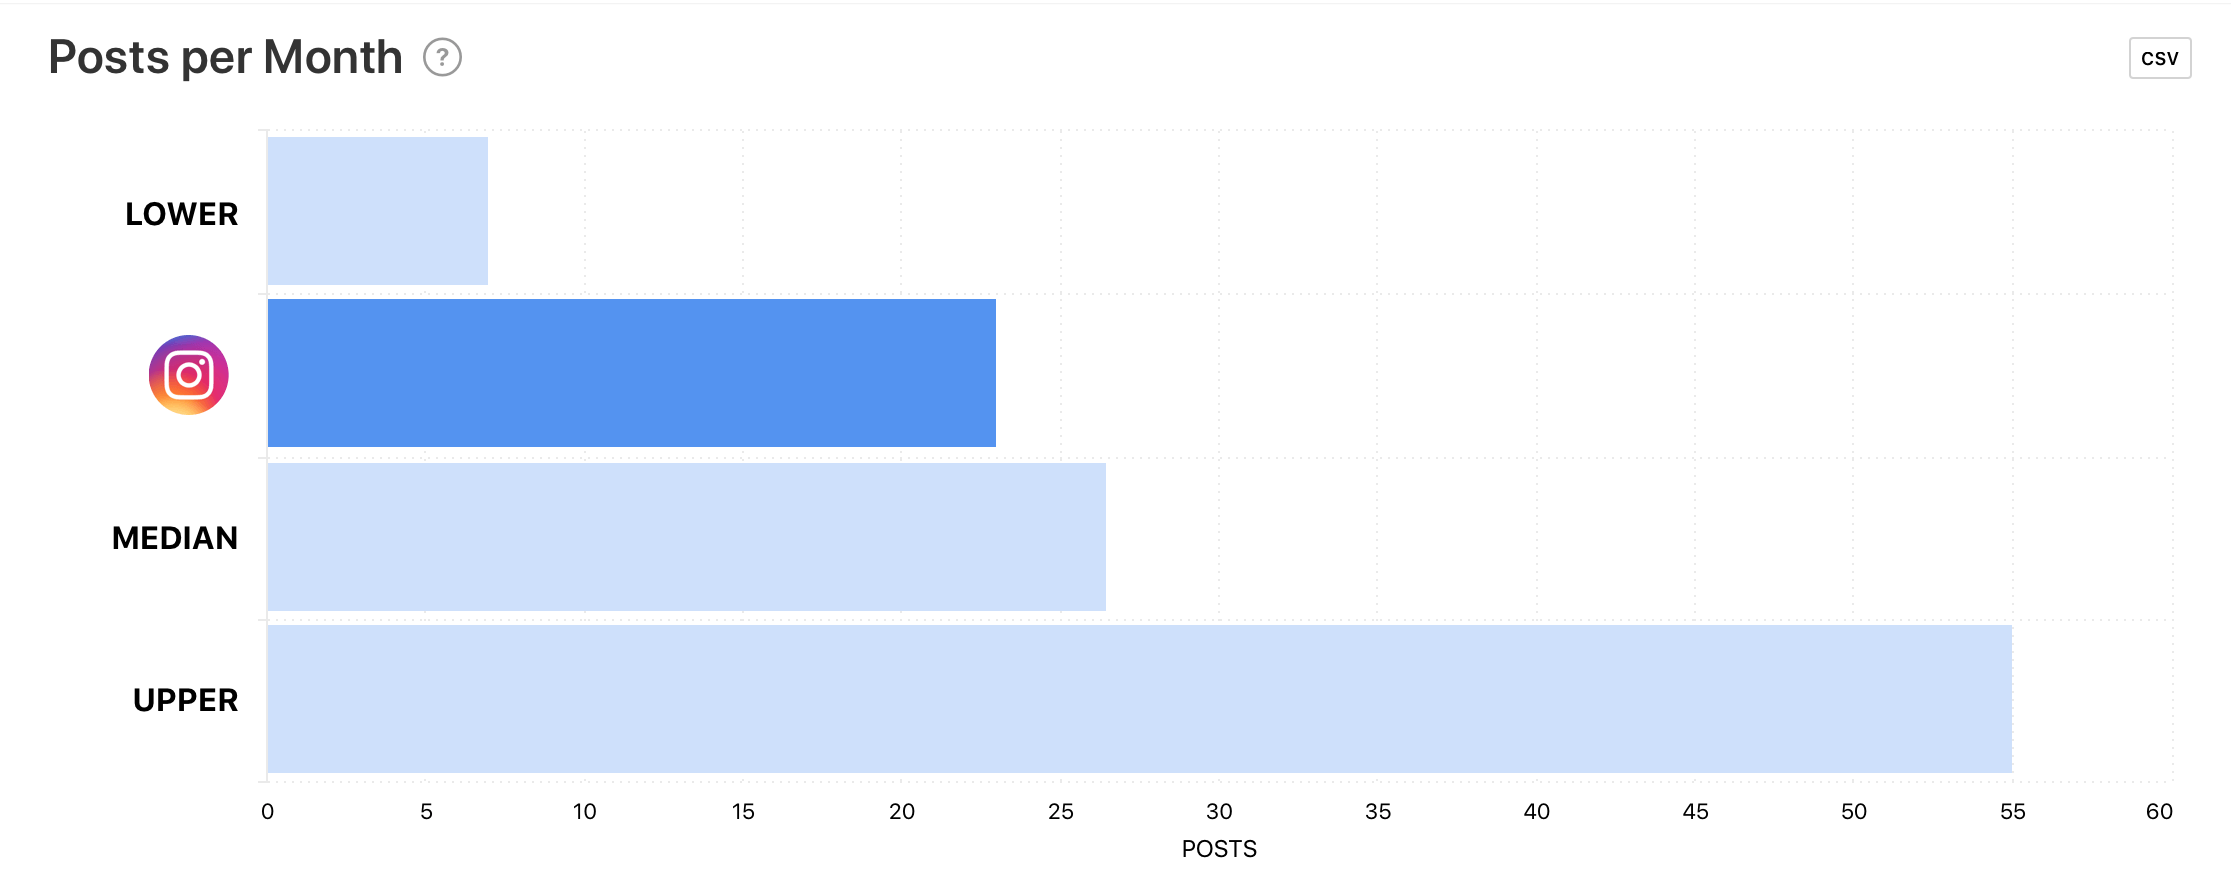
Posts per Month
This is the average number of posts per month compared with other Instagram accounts in this cohort.
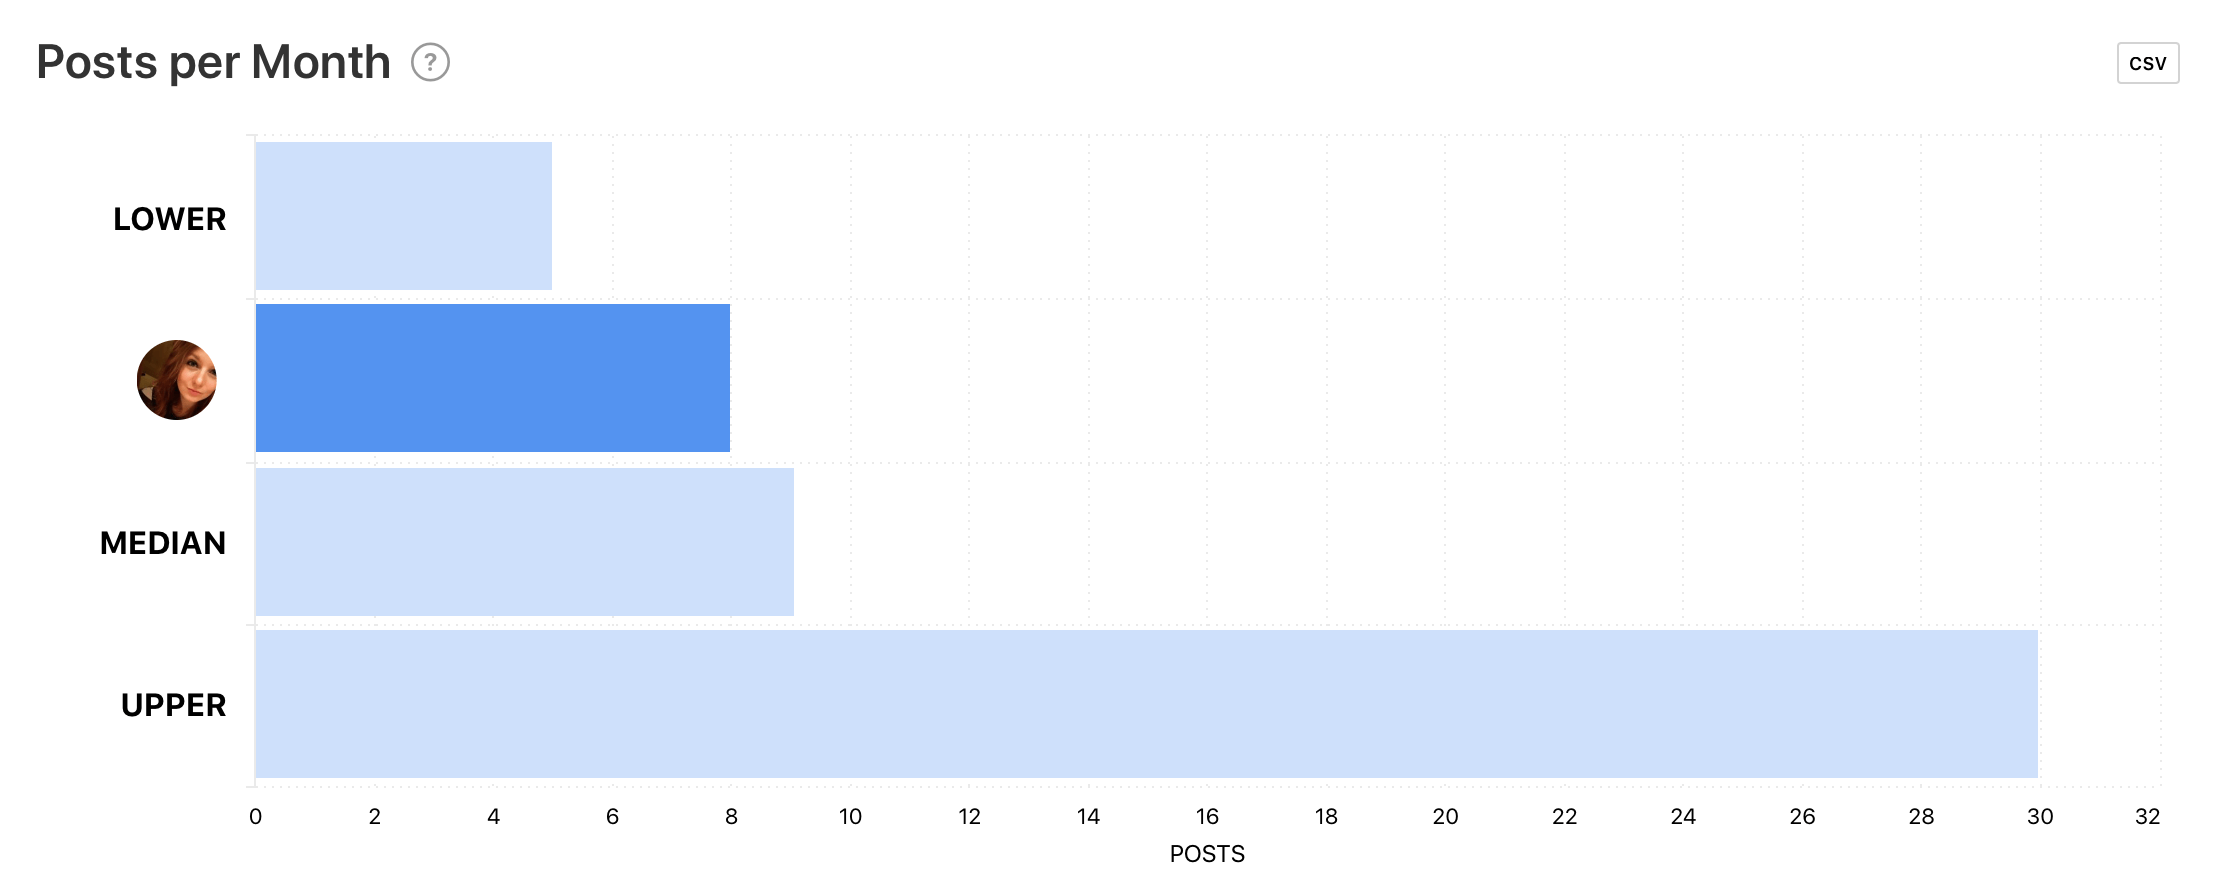
Frequently publishing content helps your brand remain relevant to your audience. Remaining active on your followers’ Instagram feeds can keep you in mind. According to socialbuddy.com, major brands post on average 1.5 times per day. You can see how your posts stack up in your cohort with Minter.io.
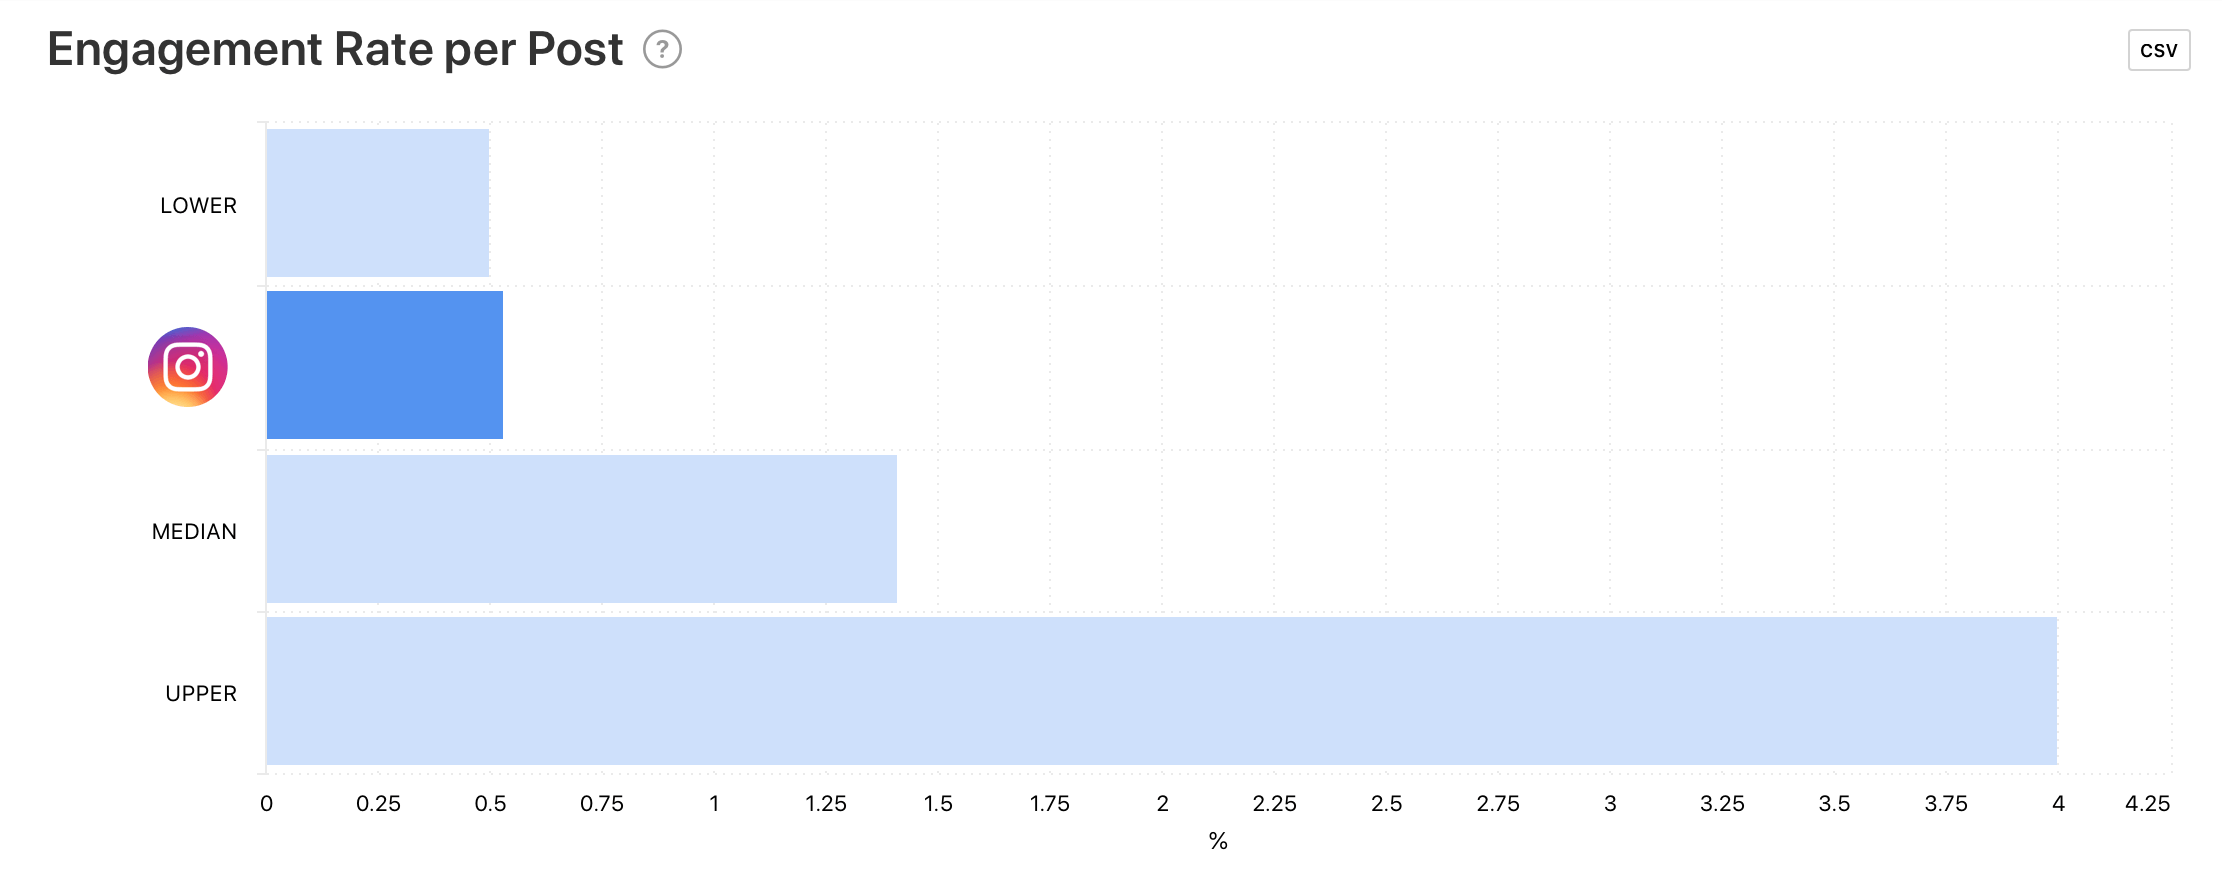
Engagement Rate per Post
This is the average engagement rate percentage per post compared with other Instagram accounts in this cohort.
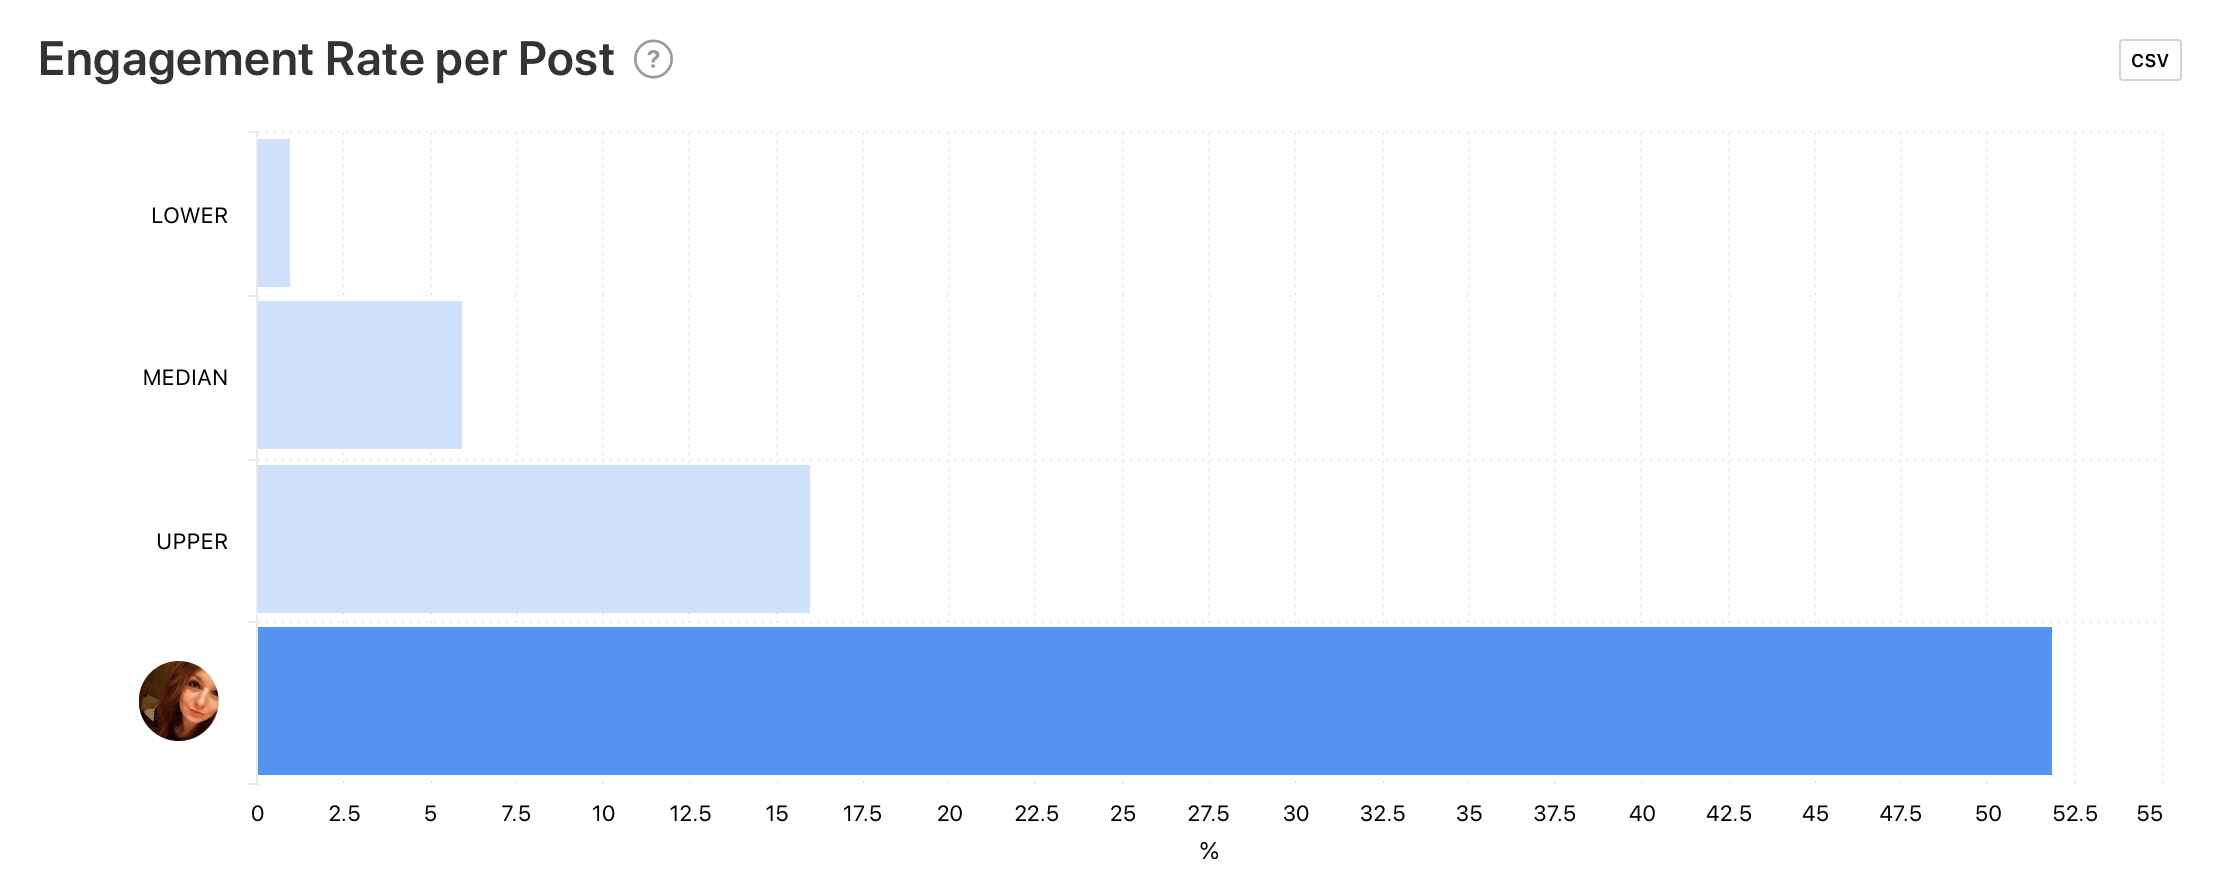
This is useful to see how active your Instagram audience are when viewing your content. According to Eduardo Morales, engagement is the most important metric on Instagram because it tells you how strongly an audience cares about the content. The higher your engagement rate, the better.
Reach Rate per Post
This is the average reach rate per post percentage compared with other Instagram accounts in this cohort.
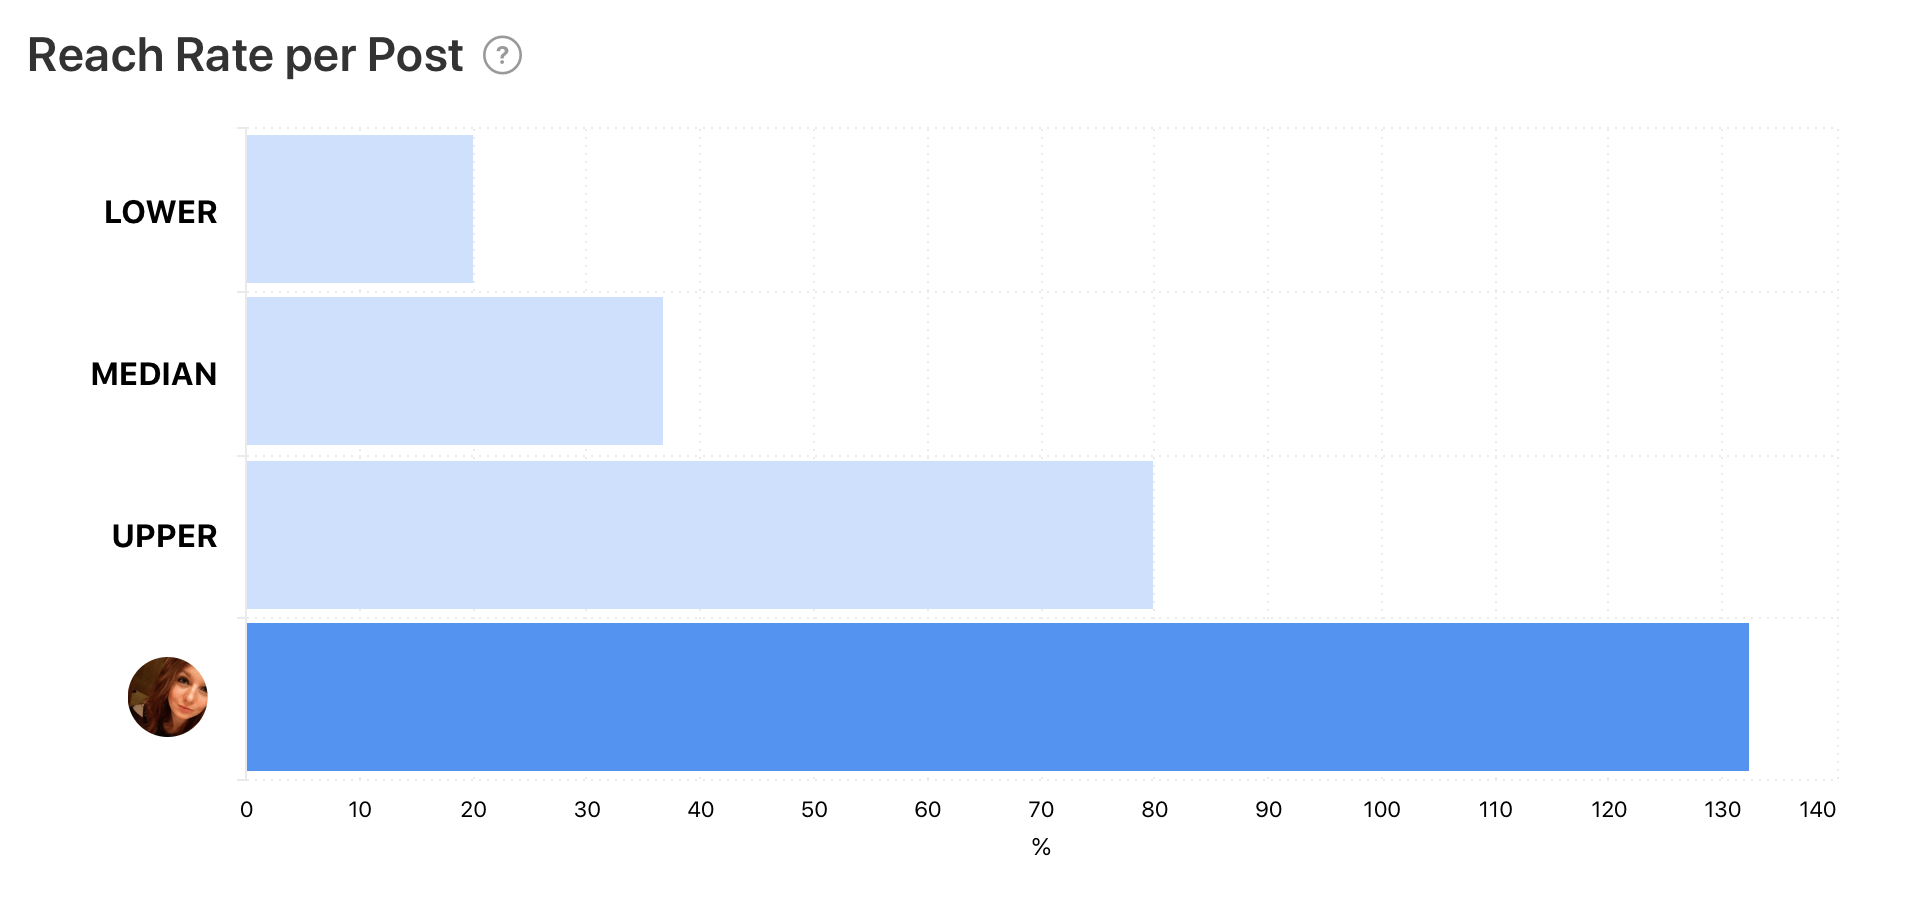
Reach rate refers to the total amount of Instagram users who saw your post at least once. Reaching your audience with your content is important. There’s no point creating fantastic content if no-one is going to see it. Therefore, keeping track of how your reach rate ranks can make sure your posts are getting seen. If they aren’t, try optimising your posts with Minter.io.
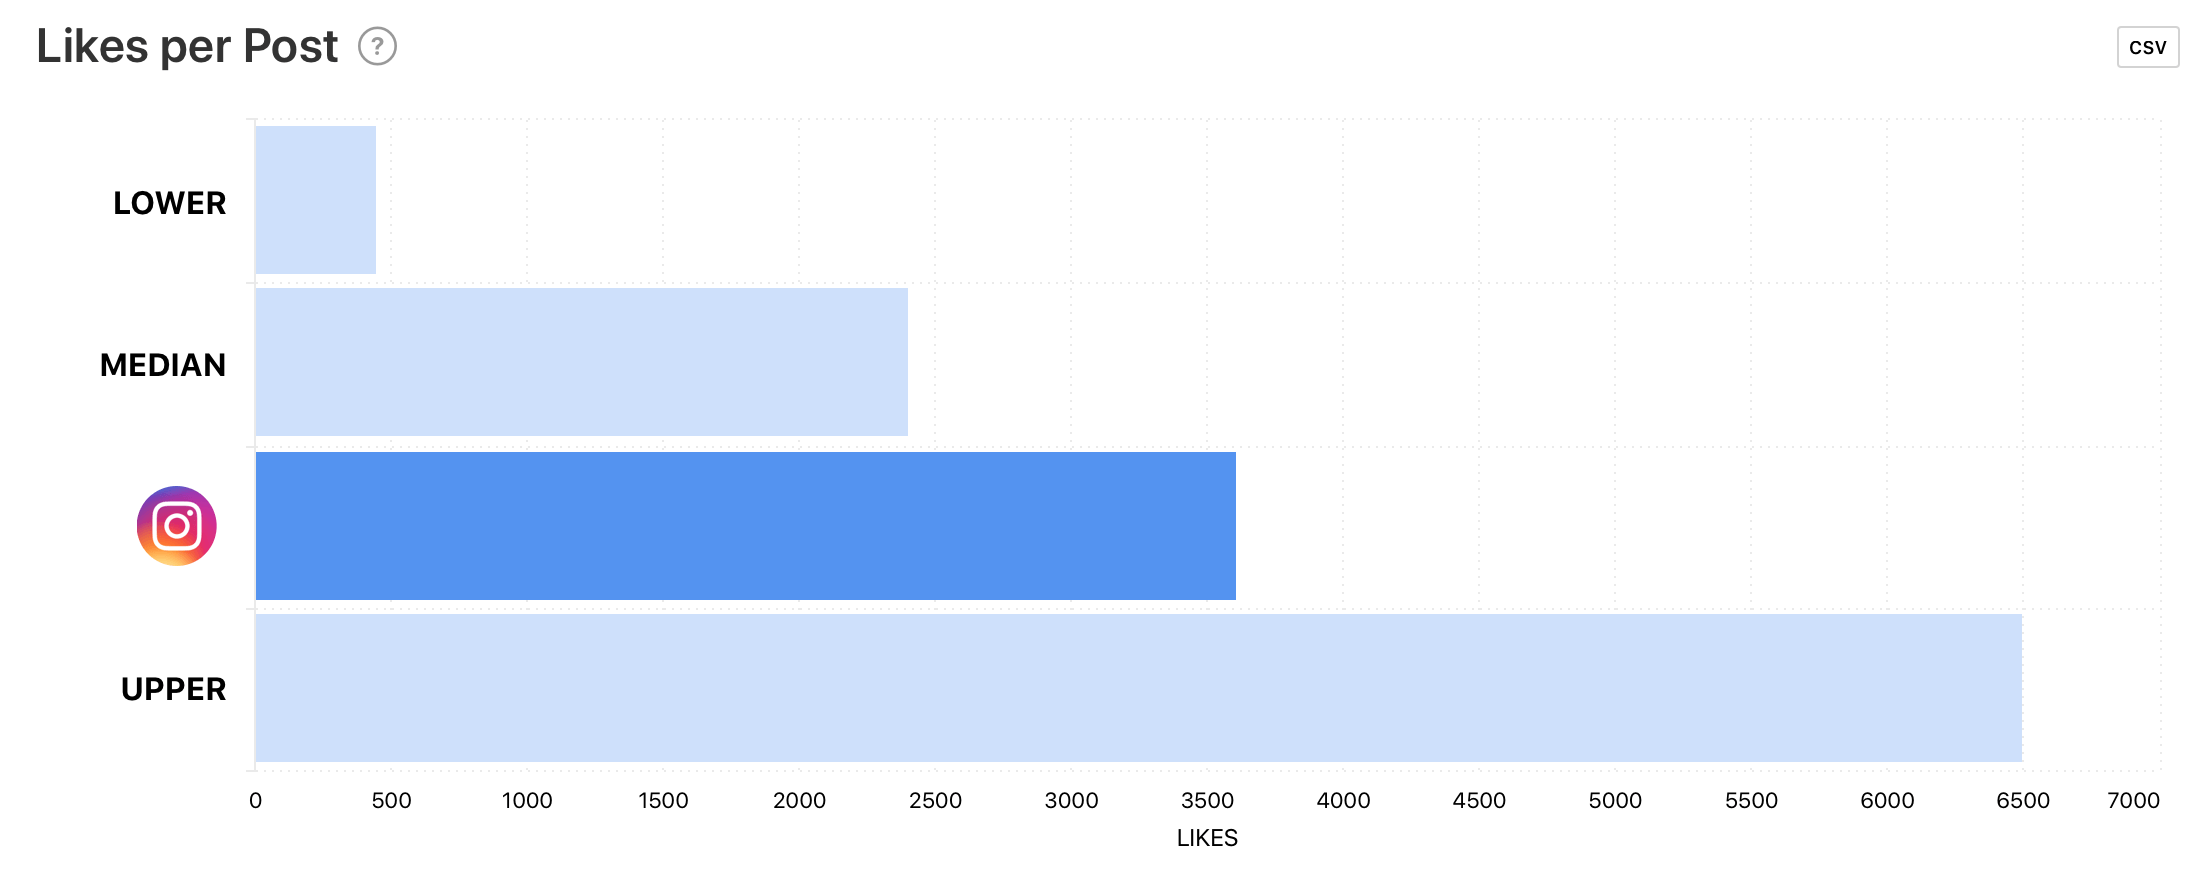
Likes per Post
This is the average number of likes per post compared with other Instagram accounts in this cohort.
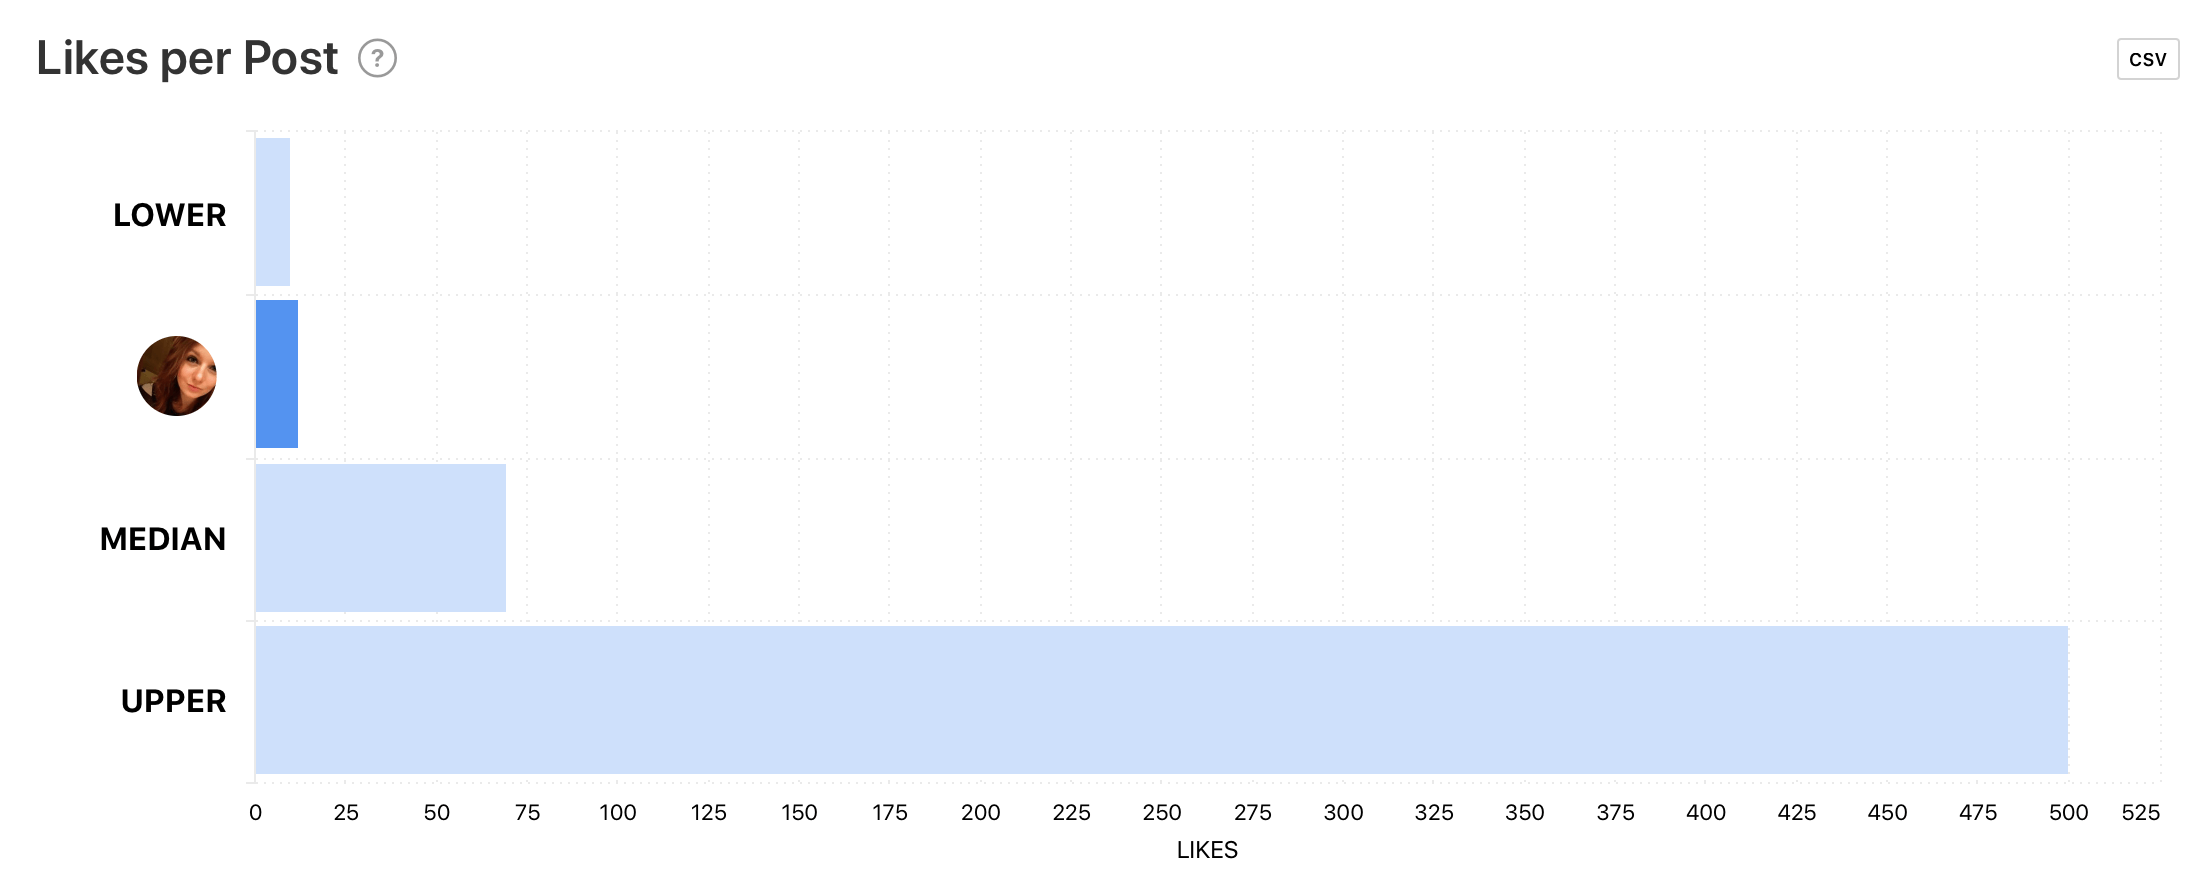
Benchmarking likes is a good indicator of the quality of your posts and how invested your audience is in your content.
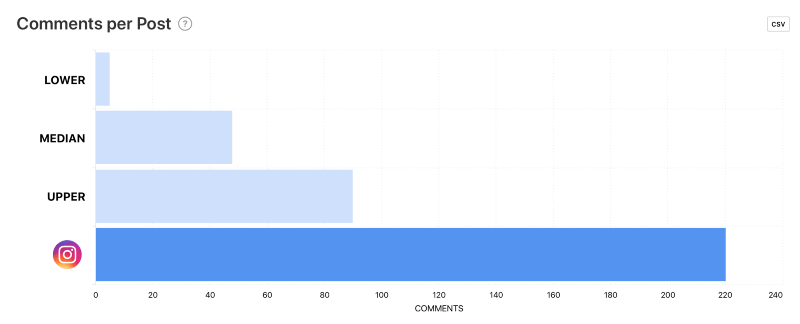
Comments per Post
This is the average number of comments per post compared with other Instagram accounts in this cohort.
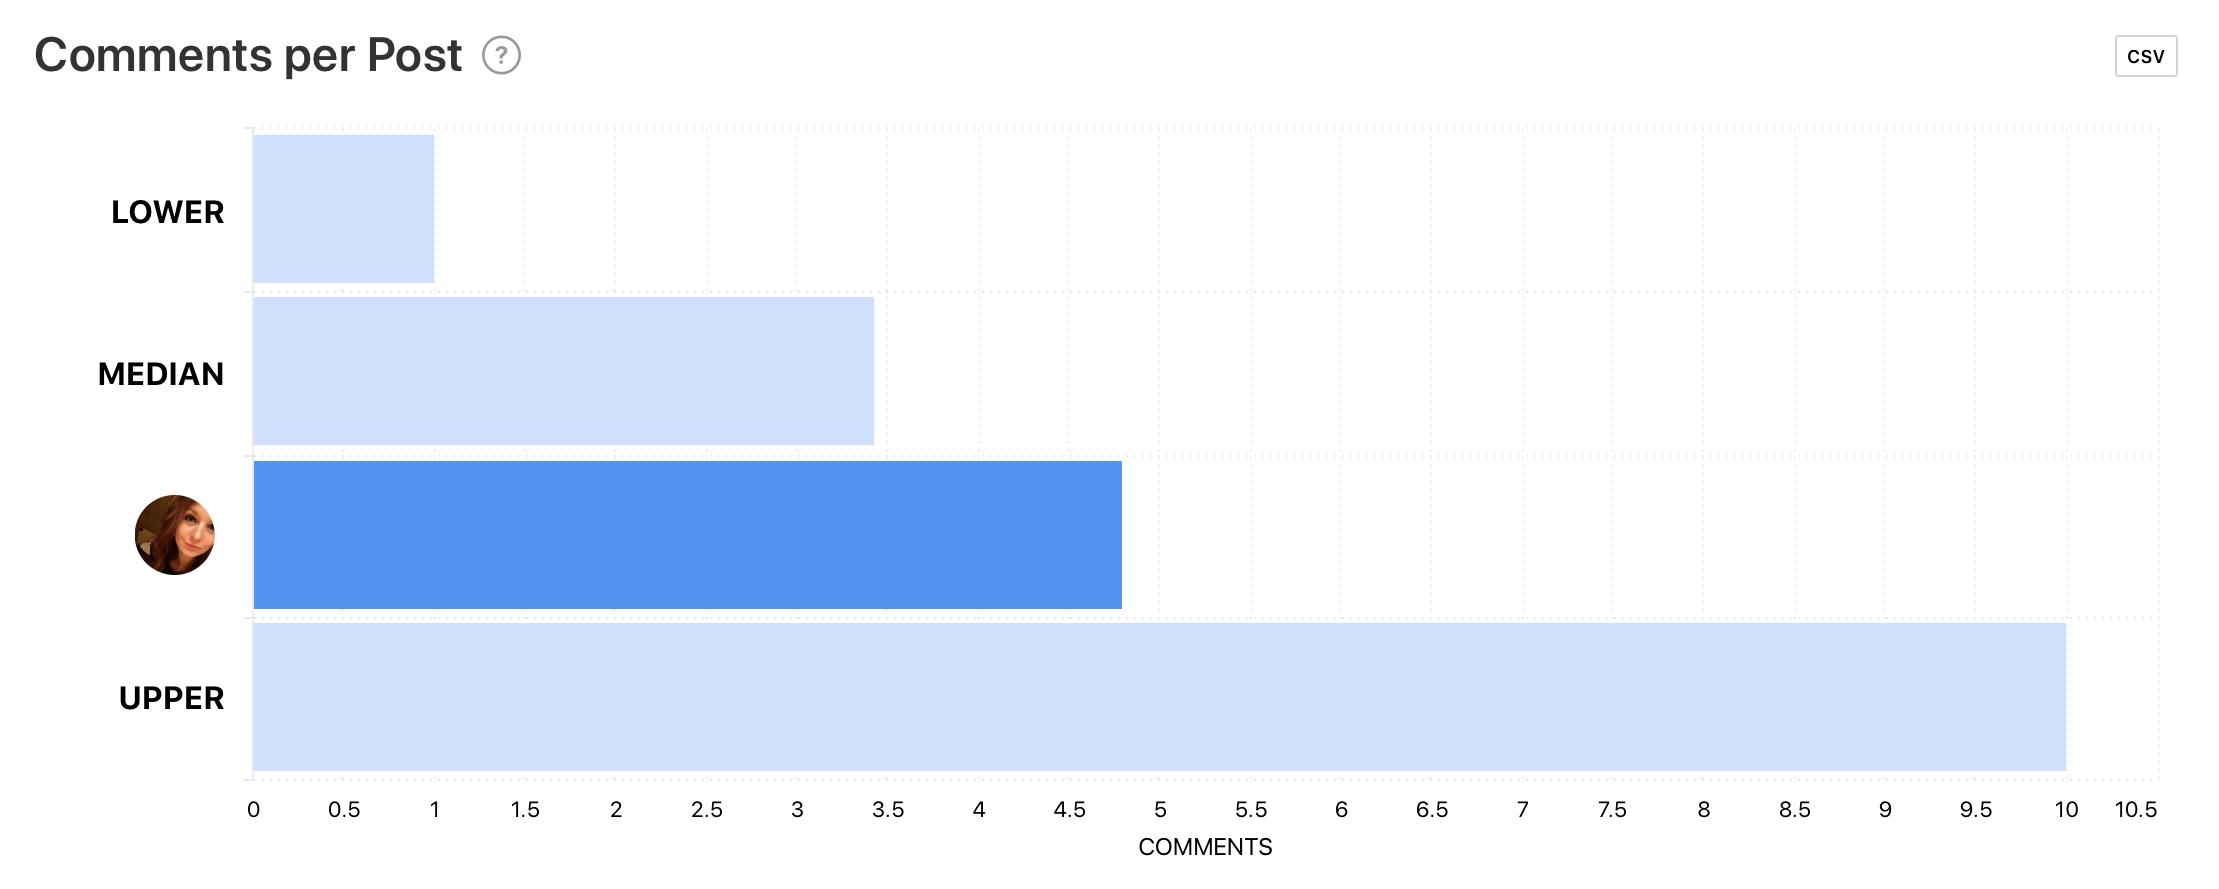
Comments require more time and effort than a quick like, so this is a good test of seeing how invested your audience is in your content. Posing questions and creating quality thought-provoking content can improve this ranking.
Stories per Month
This is the average number of stories per month compared with other Instagram accounts in this cohort.
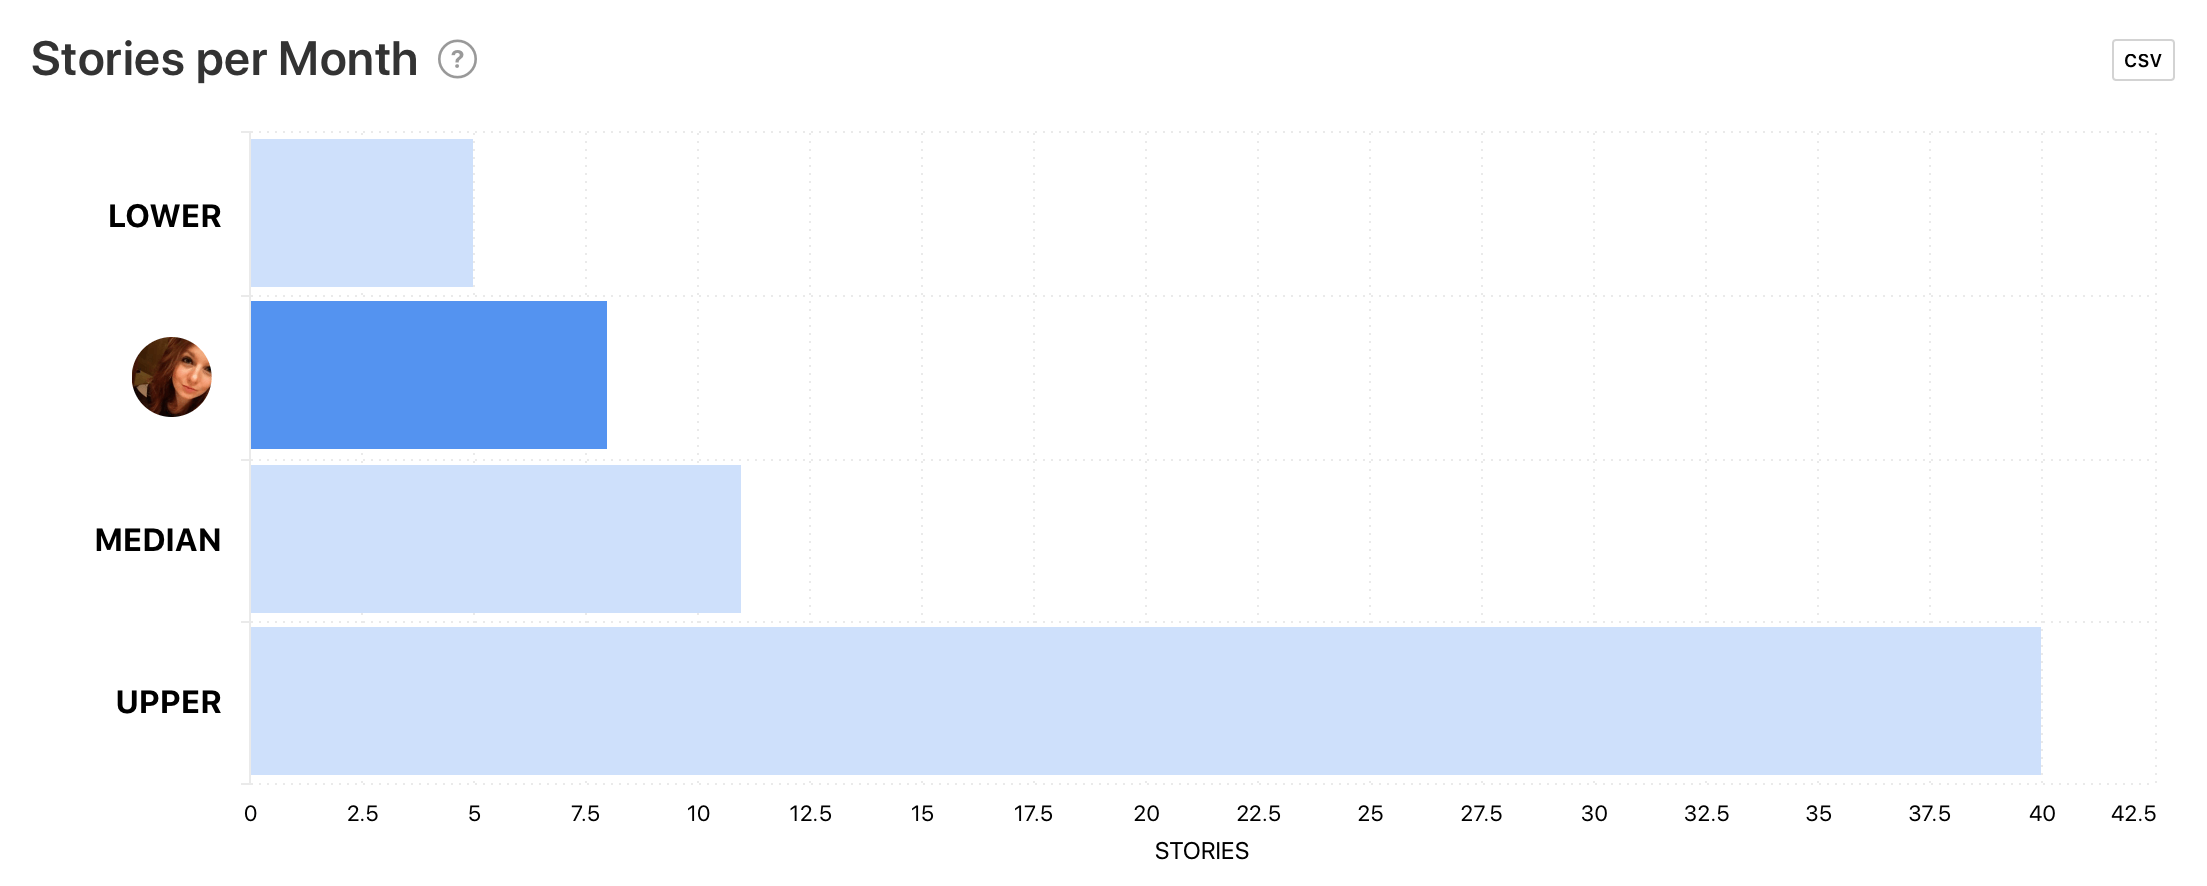
Stories provide a separate space to tell your brand’s story. If you are posting less than the median or upper amounts in this cohort, you are missing out on opportunities to be more personable with your audience. Try going live, sharing some behind-the-scenes footage, or asking a question!
Reach Rate per Story
This is the average reach rate per story compared with other Instagram accounts in this cohort.
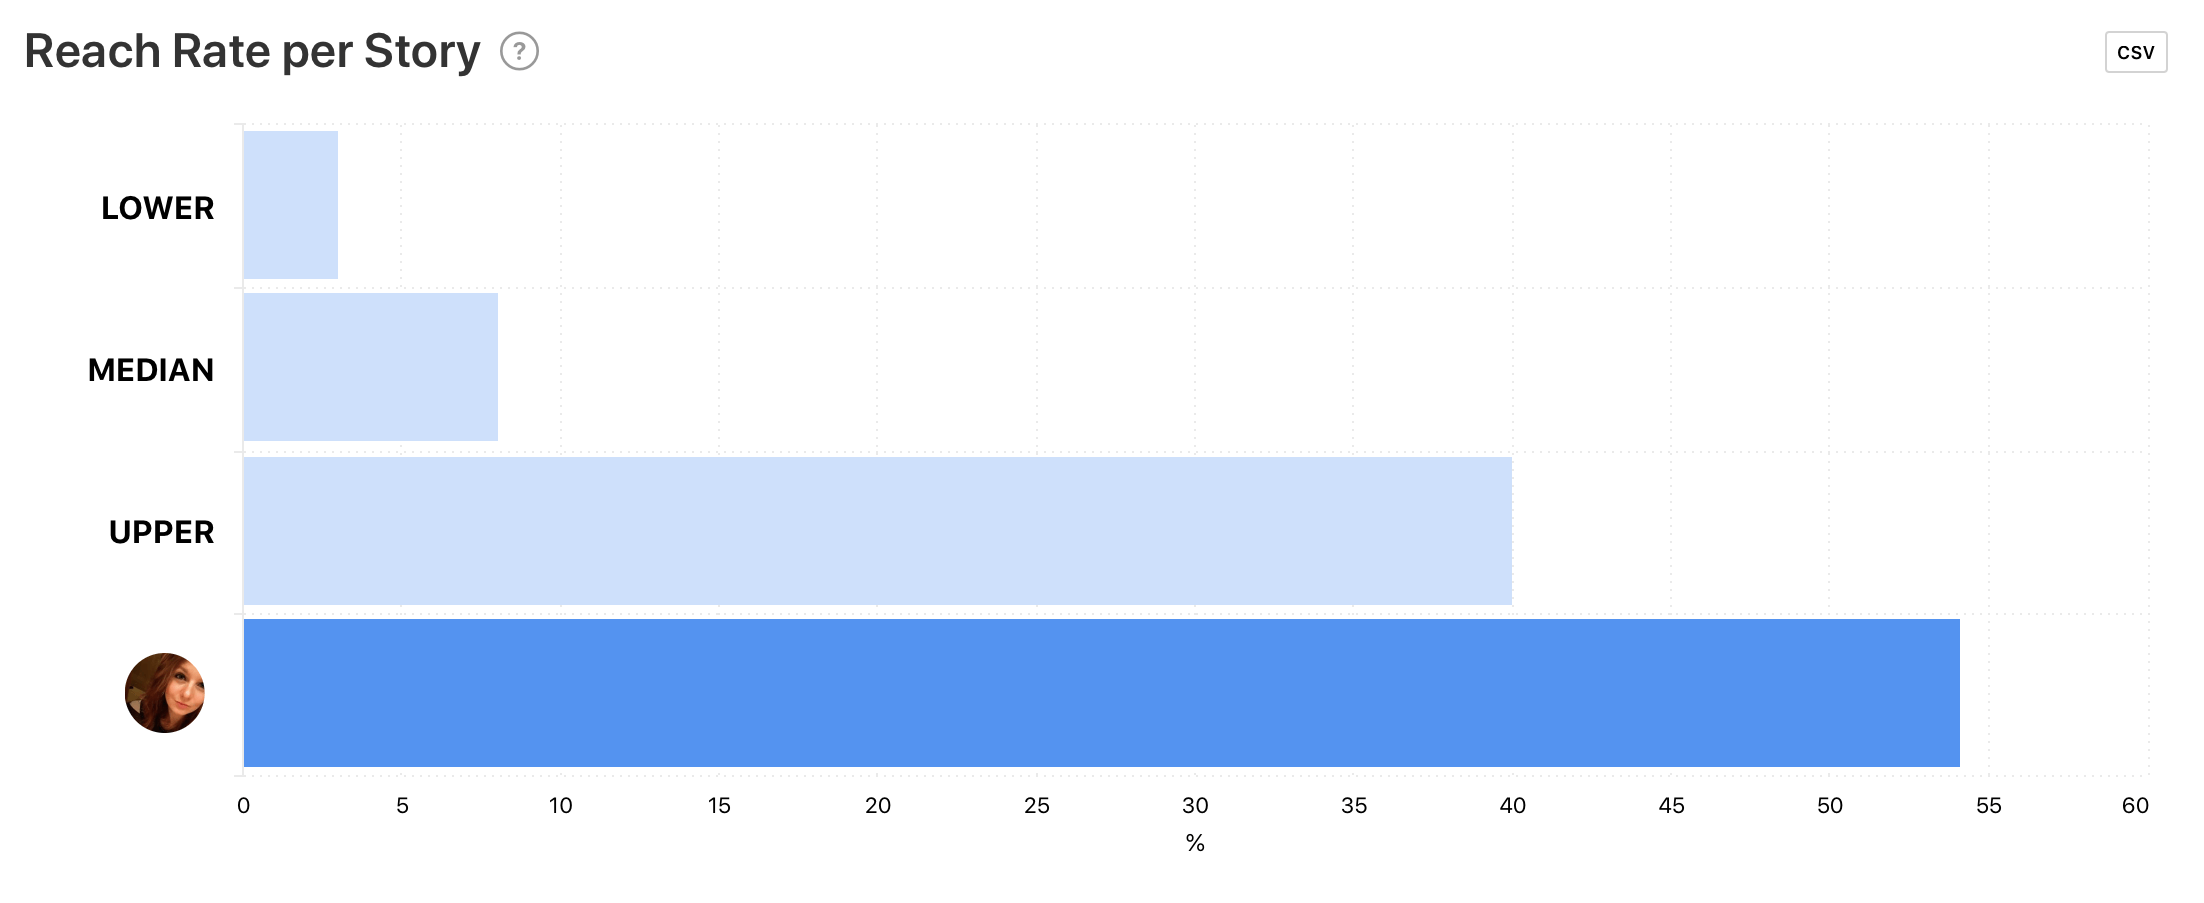
The reach rate refers to the total amount of Instagram users who saw your story at least once. This reflects how invested your audience is in your story.
Benchmarks using the competitor feature of Minter.io
You may want to look beyond your own ranking and towards competitor ranking. This allows you can learn from other accounts. With Minter.io you can see how any Instagram business account ranks in their cohort on the following metrics.
Follower Growth by Month
Keeping track of your competitors’ follower growth can provide more clarity over how particular accounts are progressing. This is particularly handy if you are in direct competition with a particular company.
Posts per Month
Checking out your competitors’ post amount per month can guide you into the direction of how many posts you should be posting to stay on par.
Engagement Rate per Post
Learning from other’s engagement rates is by far the most interesting benchmark to track. This is because you can see what is working well for them. If their engagement rate is soaring near the upper part of their cohort, it may be an opportunity to learn about what is working for their audience.
Likes per Post
Breaking engagement into likes and comments can hone in on how superficial the engagement is.
Comments per Post
If a competitor is gaining a significant amount of comments, this is a great indicator of an engaged, active audience. Check out their posts to see how they are getting a high level of comments. Are they asking questions, creating competition or sharing a particular type of content? Use this knowledge to your advantage.
Keeping track of benchmarks on Instagram is your secret weapon to staying ahead of the curve. Being able to check out how your competitors rank is another way of gaining relevant information to stay informed and learn from others. See how you rank using your free trial of Minter.io today.