Why Every Brand Should Be Using An Instagram Analytics Tool
If you’re a brand that uses Instagram, your insights will provide the most valuable information for your use of the platform. Brands use insights to track and measure key performance indicators (KPIs), to learn about their audience and to develop content strategies. Whether you’re pushing a specific campaign or generally looking to grow your business, gathering information about what works (and what doesn’t work) for your brand and your audience is entirely vital if you want your social media presence to be as effective as possible.
So, why are brands looking beyond Instagram’s in-built insights? Well, without making too fine a point, they are pretty basic. While they do provide an overview of your followers and their activity, alongside the reach and impressions of your posts, they can be fiddly to use (with several clicks leading you to the information you seek), lack customisation and much of the information is lost after just one week.
Here at Minter.io we are dedicated to making your life easier, through providing clear, well thought-out and in-depth analytics for Instagram. Want to find a simple way of keeping informed about the performance of your competitors, optimise your posts through comprehensive metrics, and enjoy the flexibility of data reading which spans longer than a week? Minter.io might just be the tool that you are looking for.
Here are some of the key things that we bring to the proverbial table:
Best Times To Post
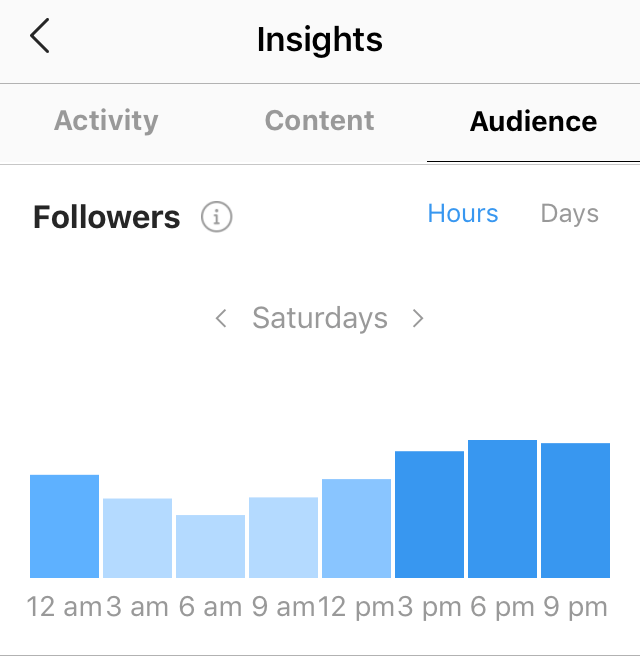
Instagram provides insights for interactions (actions taken on your account over the past week) including profile visits, button clicks (website/calls/emails), reach and impressions. The in-app insights also include the times and days when your followers are most active.
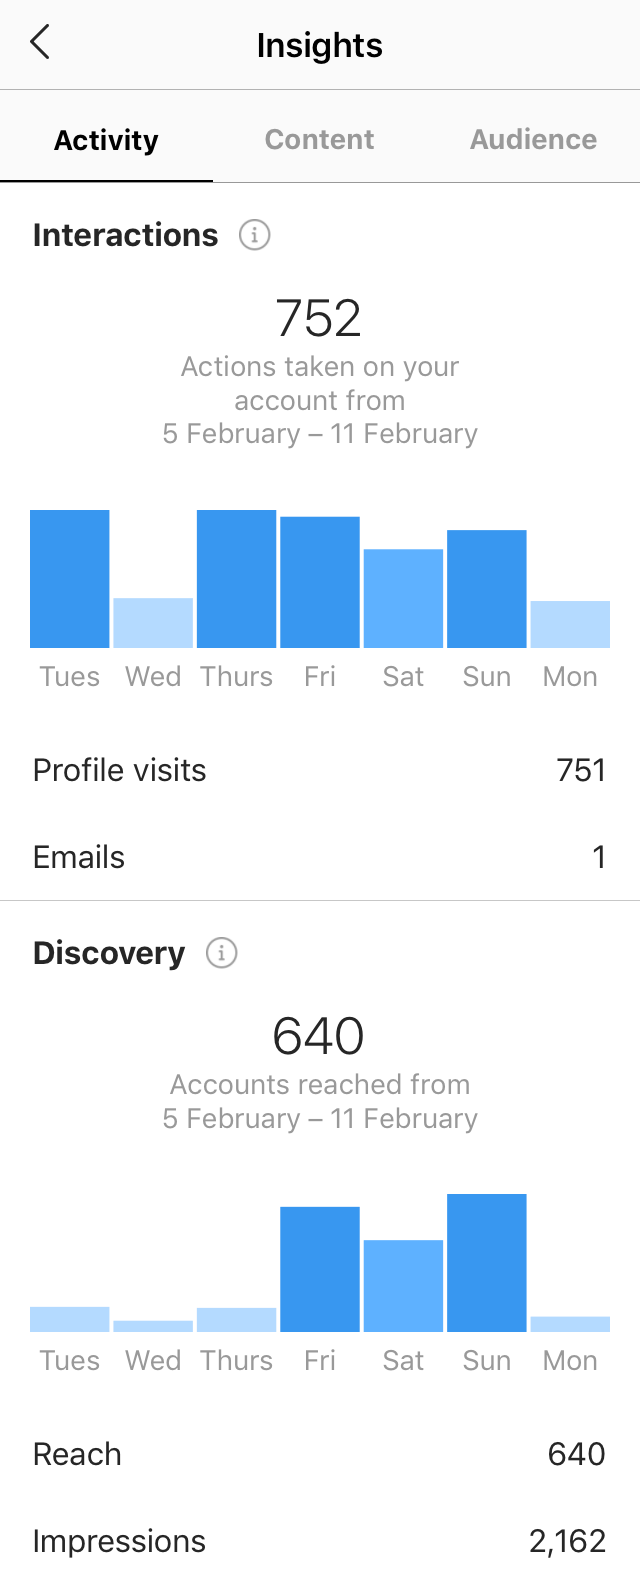
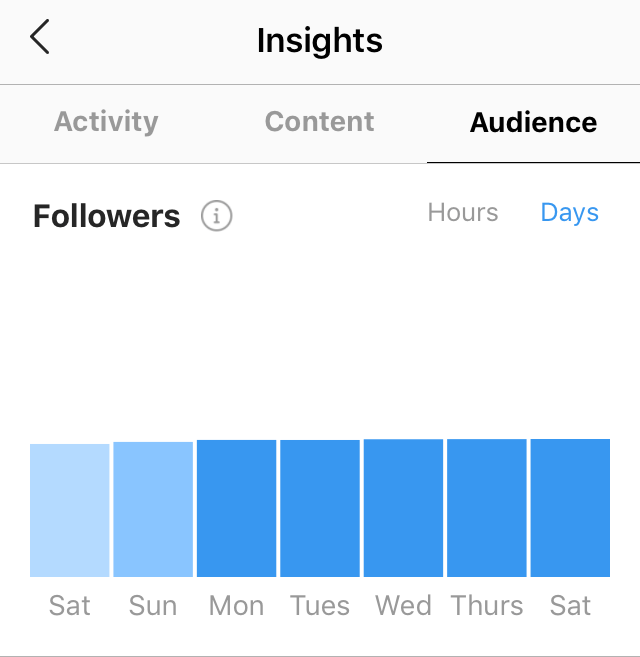
The downside? The Instagram insights in-app format makes it difficult to translate this data into an actionable content plan. Add this to the limited time the data is available to you and it’s clear to see why brands look to analytics tools to fill in the gaps.
Aiming for in-depth data, which is easy to translate and instantly actionable for content optimisation, Minter.io shows you the best times for your brand to post, based on your audience activity.
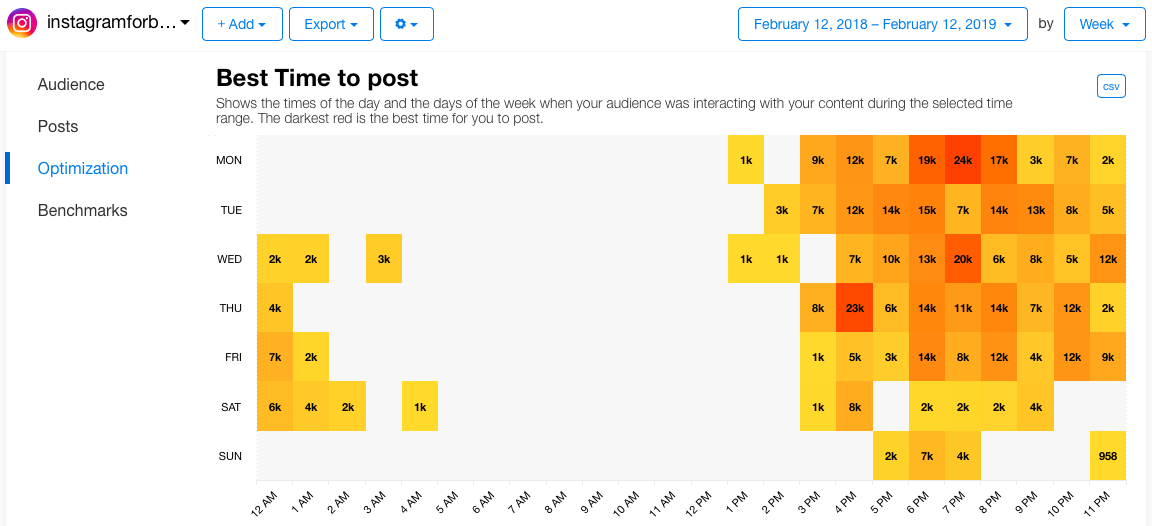
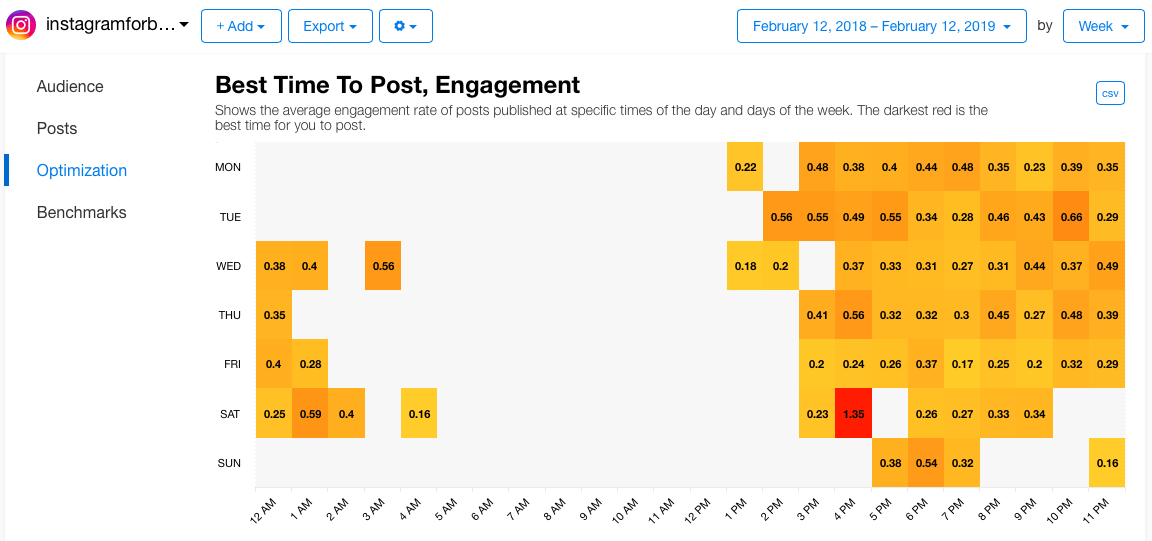
It is very easy to pick which times and days to post your content with the clear layout.
Daily Changes, More Metrics
In the Instagram app, demographic metrics (such as location, age and gender) are shown for all your current followers, without an option to view solely new follower demographics or to compare the changes in these metrics. Happily, Minter.io plugs this gap by capturing the demographics for new followers during a selected date range. So whether you are wondering what kinds of new followers you are attracting over a specific campaign, or attempting to view trends in your general follower demographic development, these additional metrics and daily changes make it clear and easy.
Furthermore, you still have the flexibility of clearly seeing the demographics for all your followers by selecting ‘All Time’ as the date range. With data updating daily, stories data updating every 30 minutes and data for hashtags updating every 12 hours, you can easily view and compare your demographic changes.
Date Picker
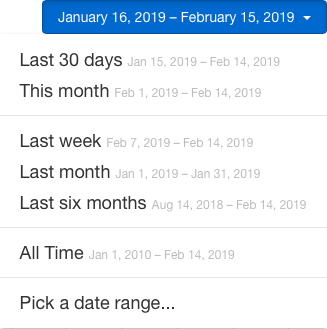
Want to view your metrics over a specific period of time to track a campaign or prepare for a quarterly review? No problem! The power is in your hands to choose the data you need, from the time period you want.
You can view your metrics by the day, week or month and you can select the time frame which suits you.
N.B. We collect data about your follower growth, stories and mentions from the date you activate your Minter.io account, so be sure to sign up before you need this information.
Exports
Need an in-depth export for one particular metric or a neat file with all your metrics clearly displayed? You got it! Directly download the data you need from your desired date range. You can even export competitor data.
Furthermore, there’s no need to remember to export your desired metrics before your weekly or monthly board meeting. Minter.io provides an option to schedule your export in a PDF, XLS or Presentation (.pptx) format, which is delivered directly to the email(s) of your choice!
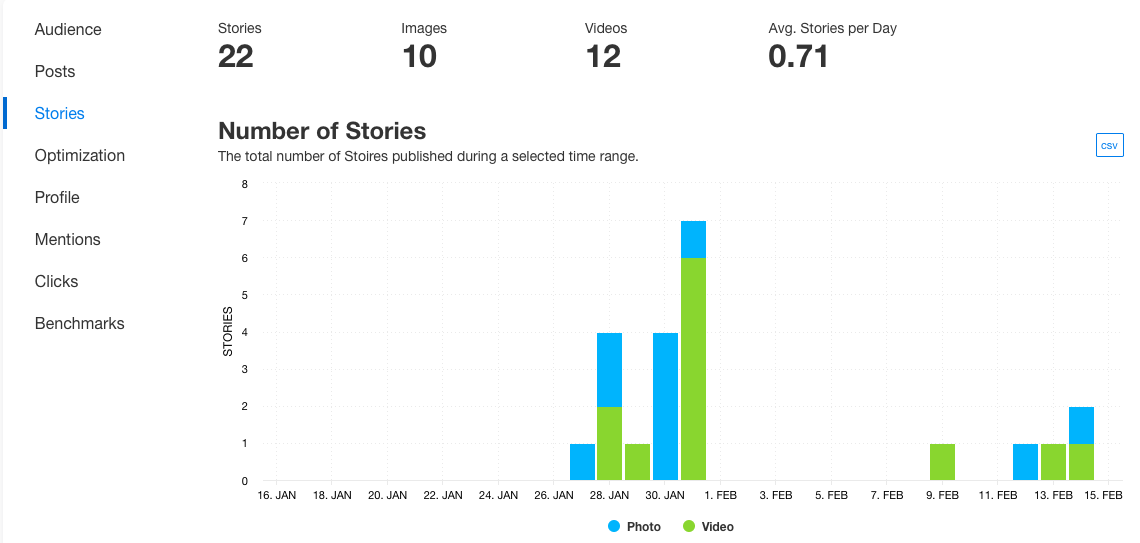
Stories
What’s the best time for your brand to post a story? Do picture or video stories work best for your brand? Minter.io makes it easy to see your use of stories and interpret the analytical data.
Minter.io provides you with a clear display of:
- story type (photo/video)
- number of stories within the selected time frame
- impressions
- replies
- exits
- taps forward
- taps back
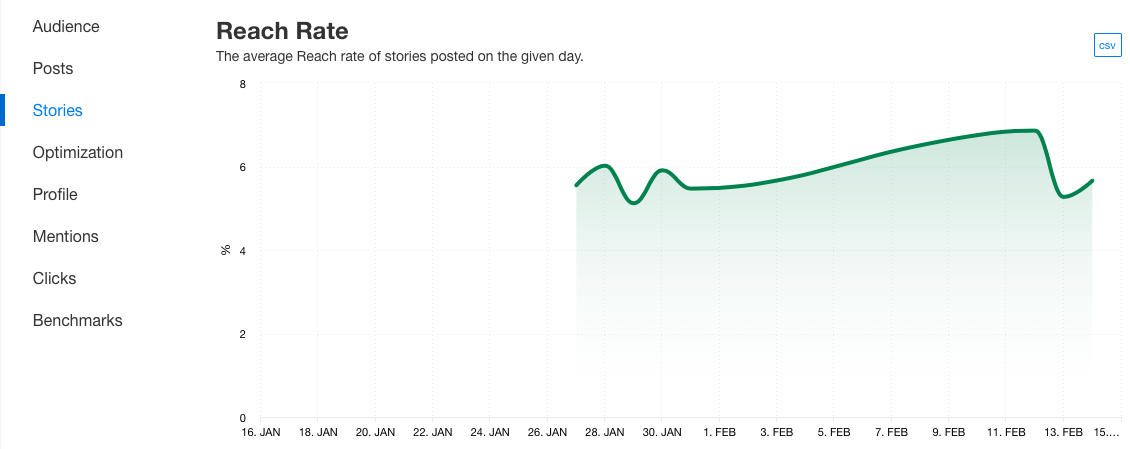
- reach rate
- completion rate
- full view rate
- best time to post
- top stories
What’s even better is that they are on one page, making it simple to see where you are excelling and where you can improve.
Mentions
Tracking mentions is incredibly handy, especially if you are running a campaign that asks product users to mention the brand (or ‘tag’ using the @ function) in their description.
Whether you are mentioned in a description or a comment, we make your brand mentions easy to find and filter. We put all your mentions in one place so that they are easy to track.
Hashtag Tracking
Hashtag tracking is particularly important if you are running a campaign that is based around hashtag use. When running campaigns which encourage user-generated content, tracking the campaign hashtag couldn’t be easier. Without the need to sieve through the search function in Instagram, you can see up to 1 million posts with your desired hashtag. You can also use this function to track trends within a hashtag and view associated hashtags.
Here is an example of the top posts for the hashtag #hygge, tracked through the hashtag tracking feature on Minter.io:
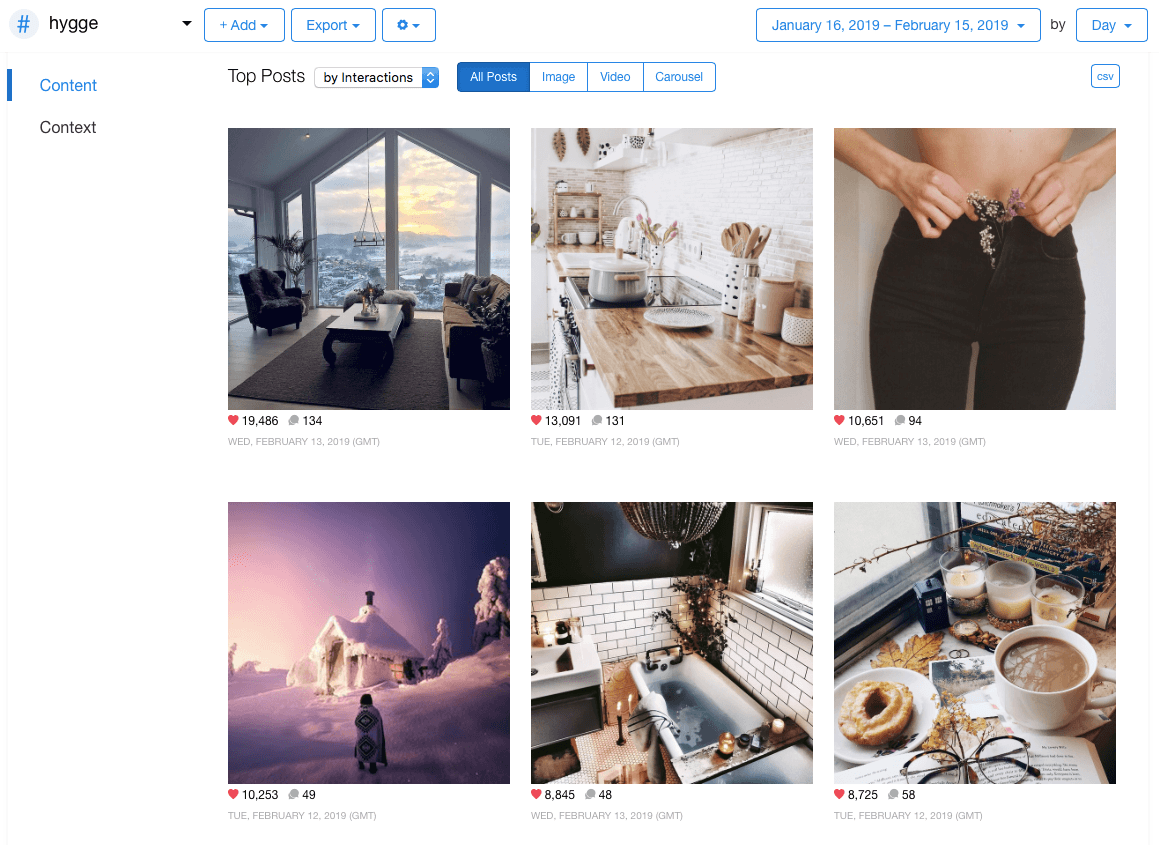
Minter.io provides content and context metrics for your tracked hashtag.
Content analytics include:
- total posts
- number of posts
- interactions
- post sentiment rate
- top posts
Context analytics include:
- associated hashtags
- number of hashtags (used alongside your selected hashtag)
N.B. Hashtag reports need to be added in advance as Minter.io holds no historical data for this metric.
Additionally, we provide you with information about your own brand’s hashtag use and show you which hashtags you are currently using that are the most effective.
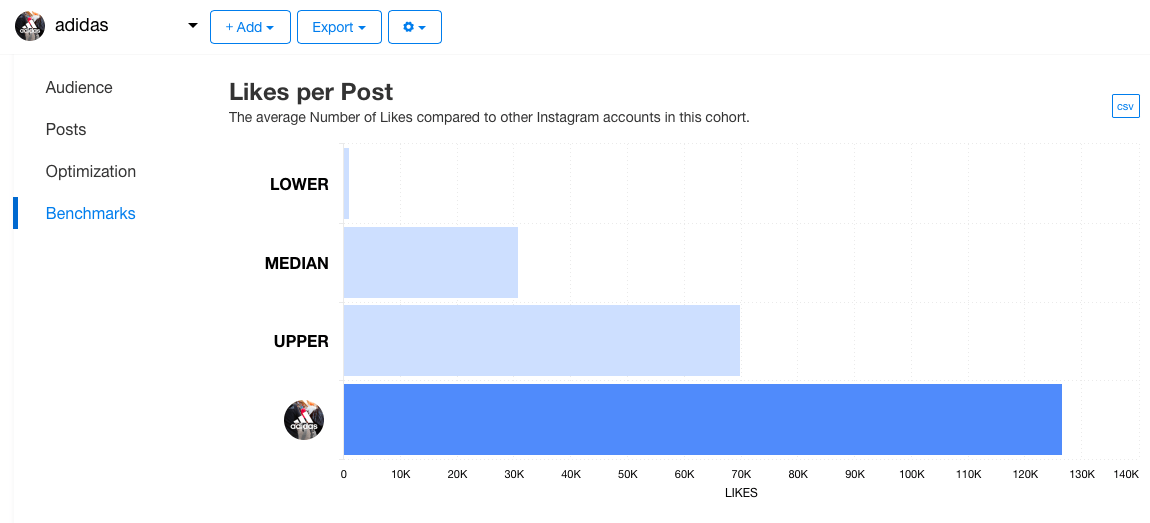
Competitors
The days of hunting down your competitors, and going out of your way to check out their latest posts, are over! View insights for competitor brand accounts’ audiences, post optimisation and how they benchmark against other accounts with a similar amount of followers.
If you’re seeking an Instagram analytics tool, which will help take your brand’s social media presence to the next level, you’ve come to the right place. Take the guess work out of your Instagram optimisation. Sign up for your free trial of Minter.io today!