


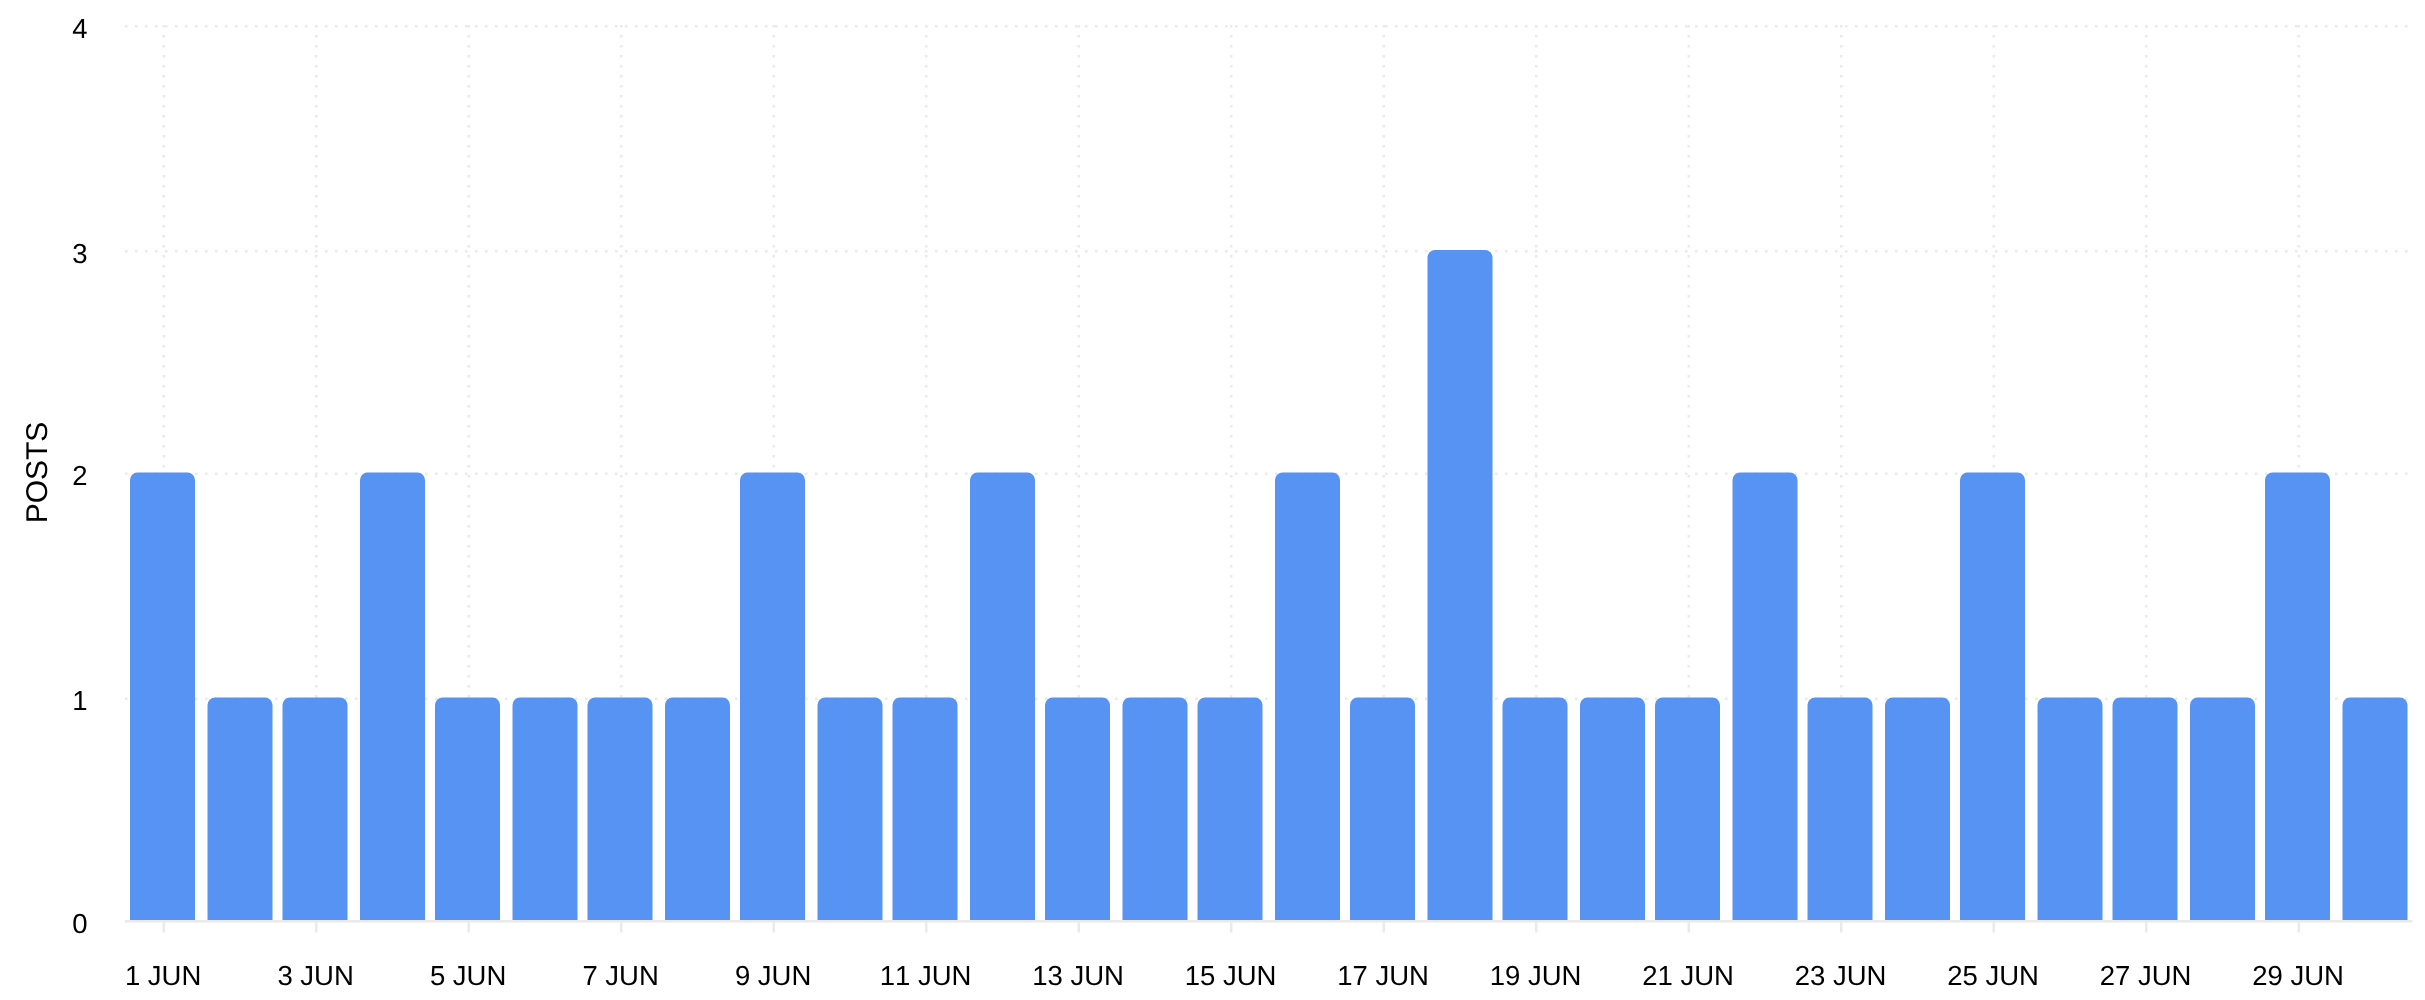
Posts
The number of Posts published during the selected date range.
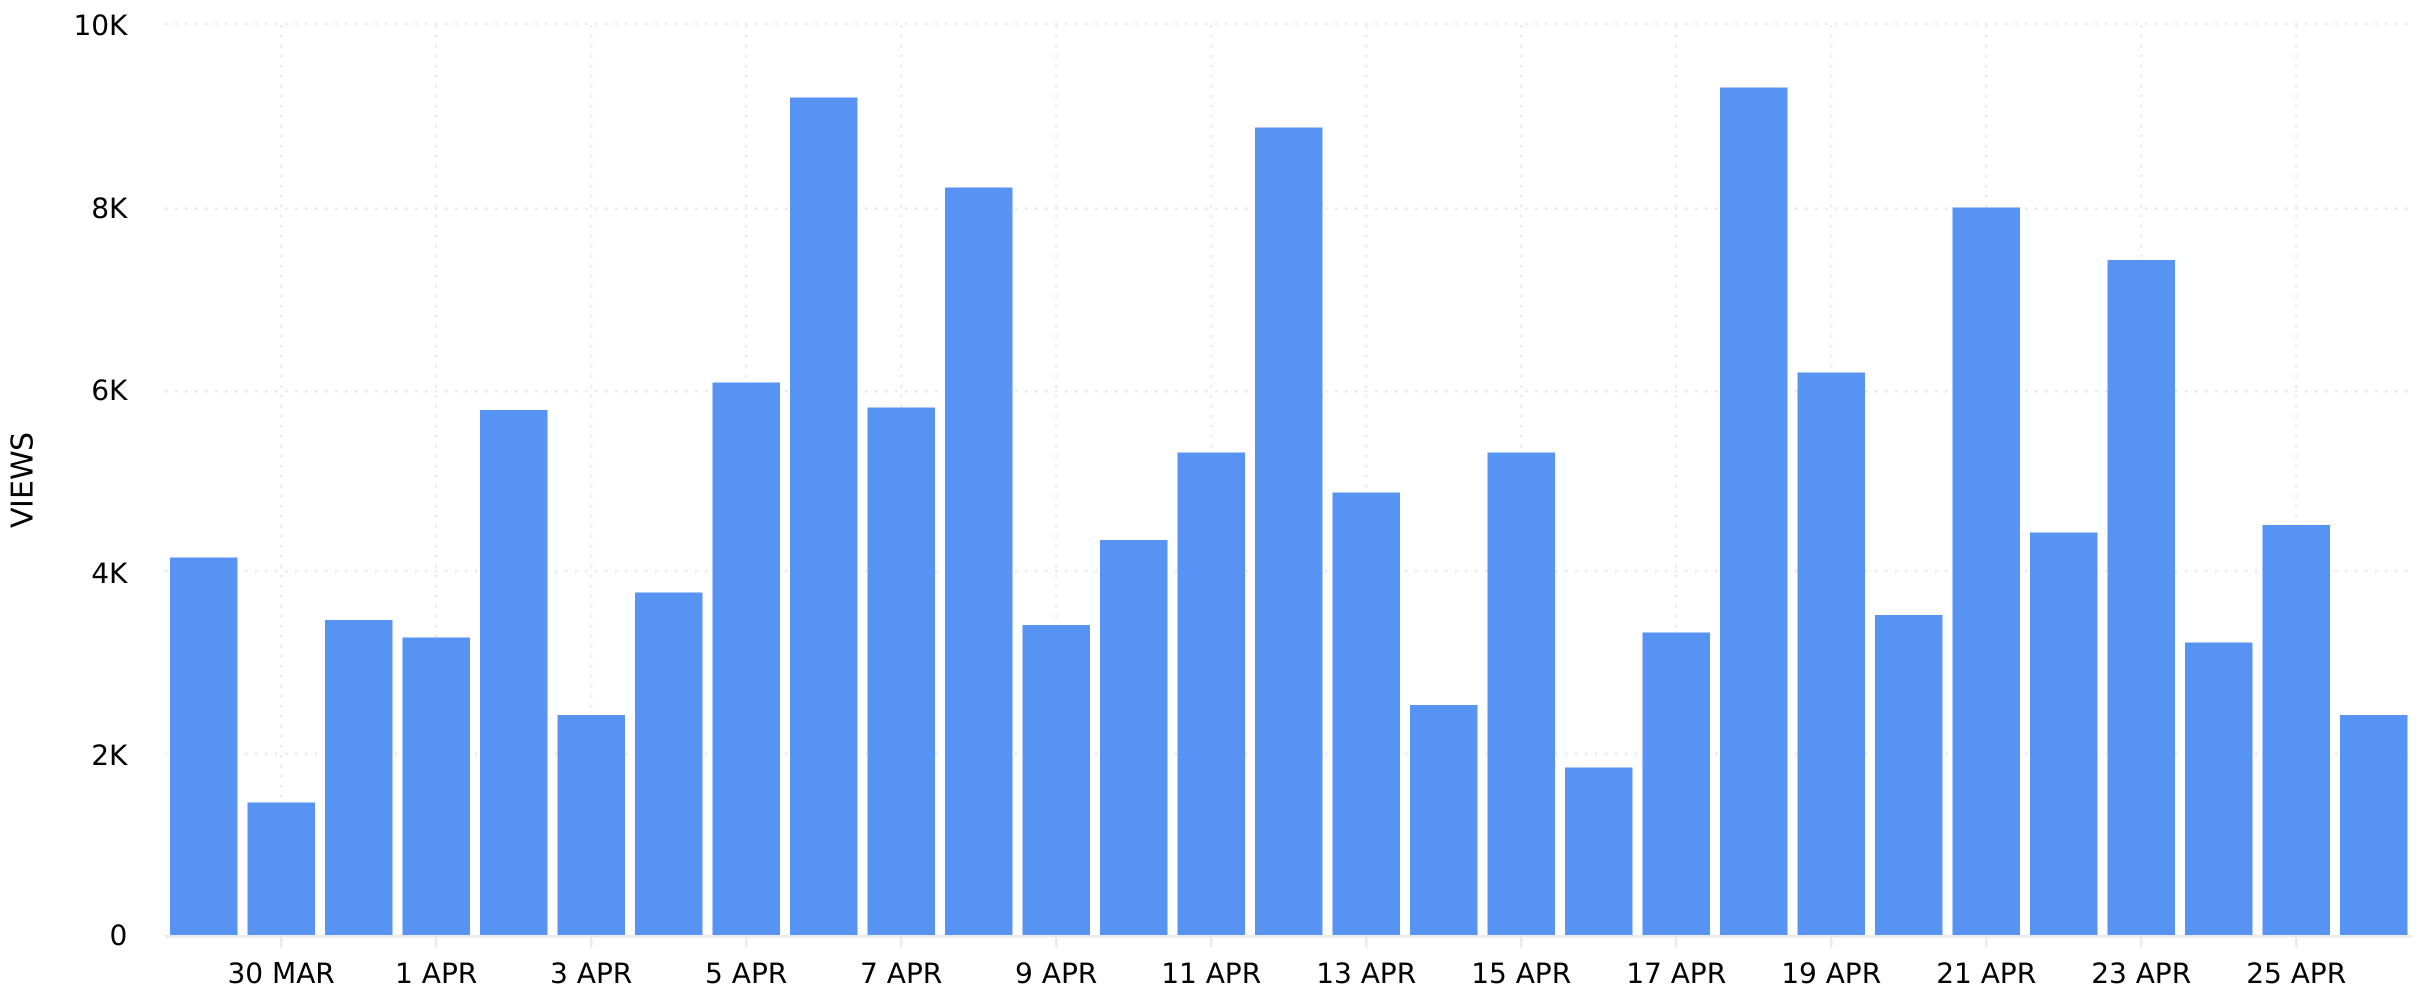
Views
The number of times Posts published during the selected date range were viewed, including repeat views from the same account.
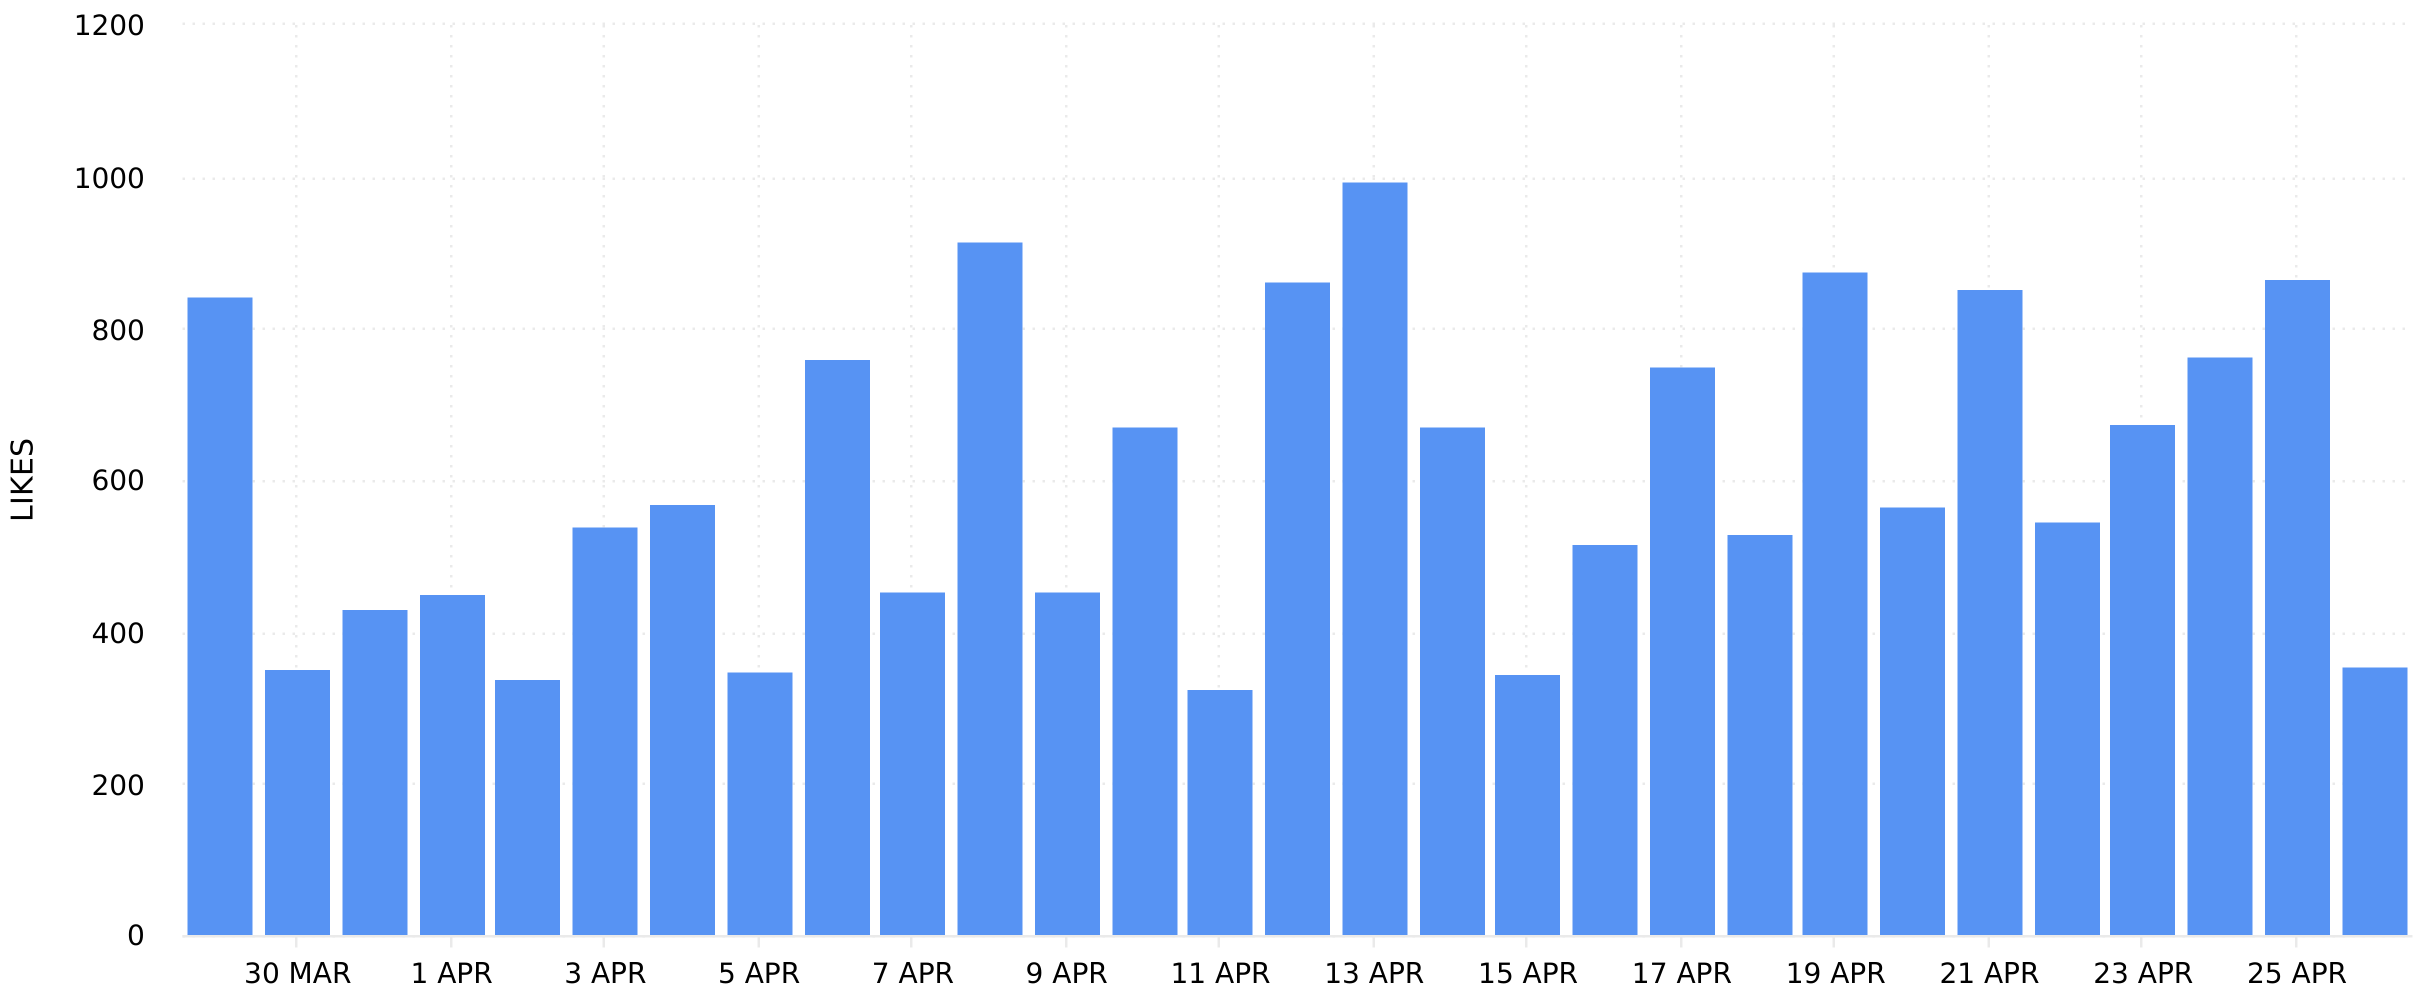
Likes
The number of likes on posts published during the selected date range.
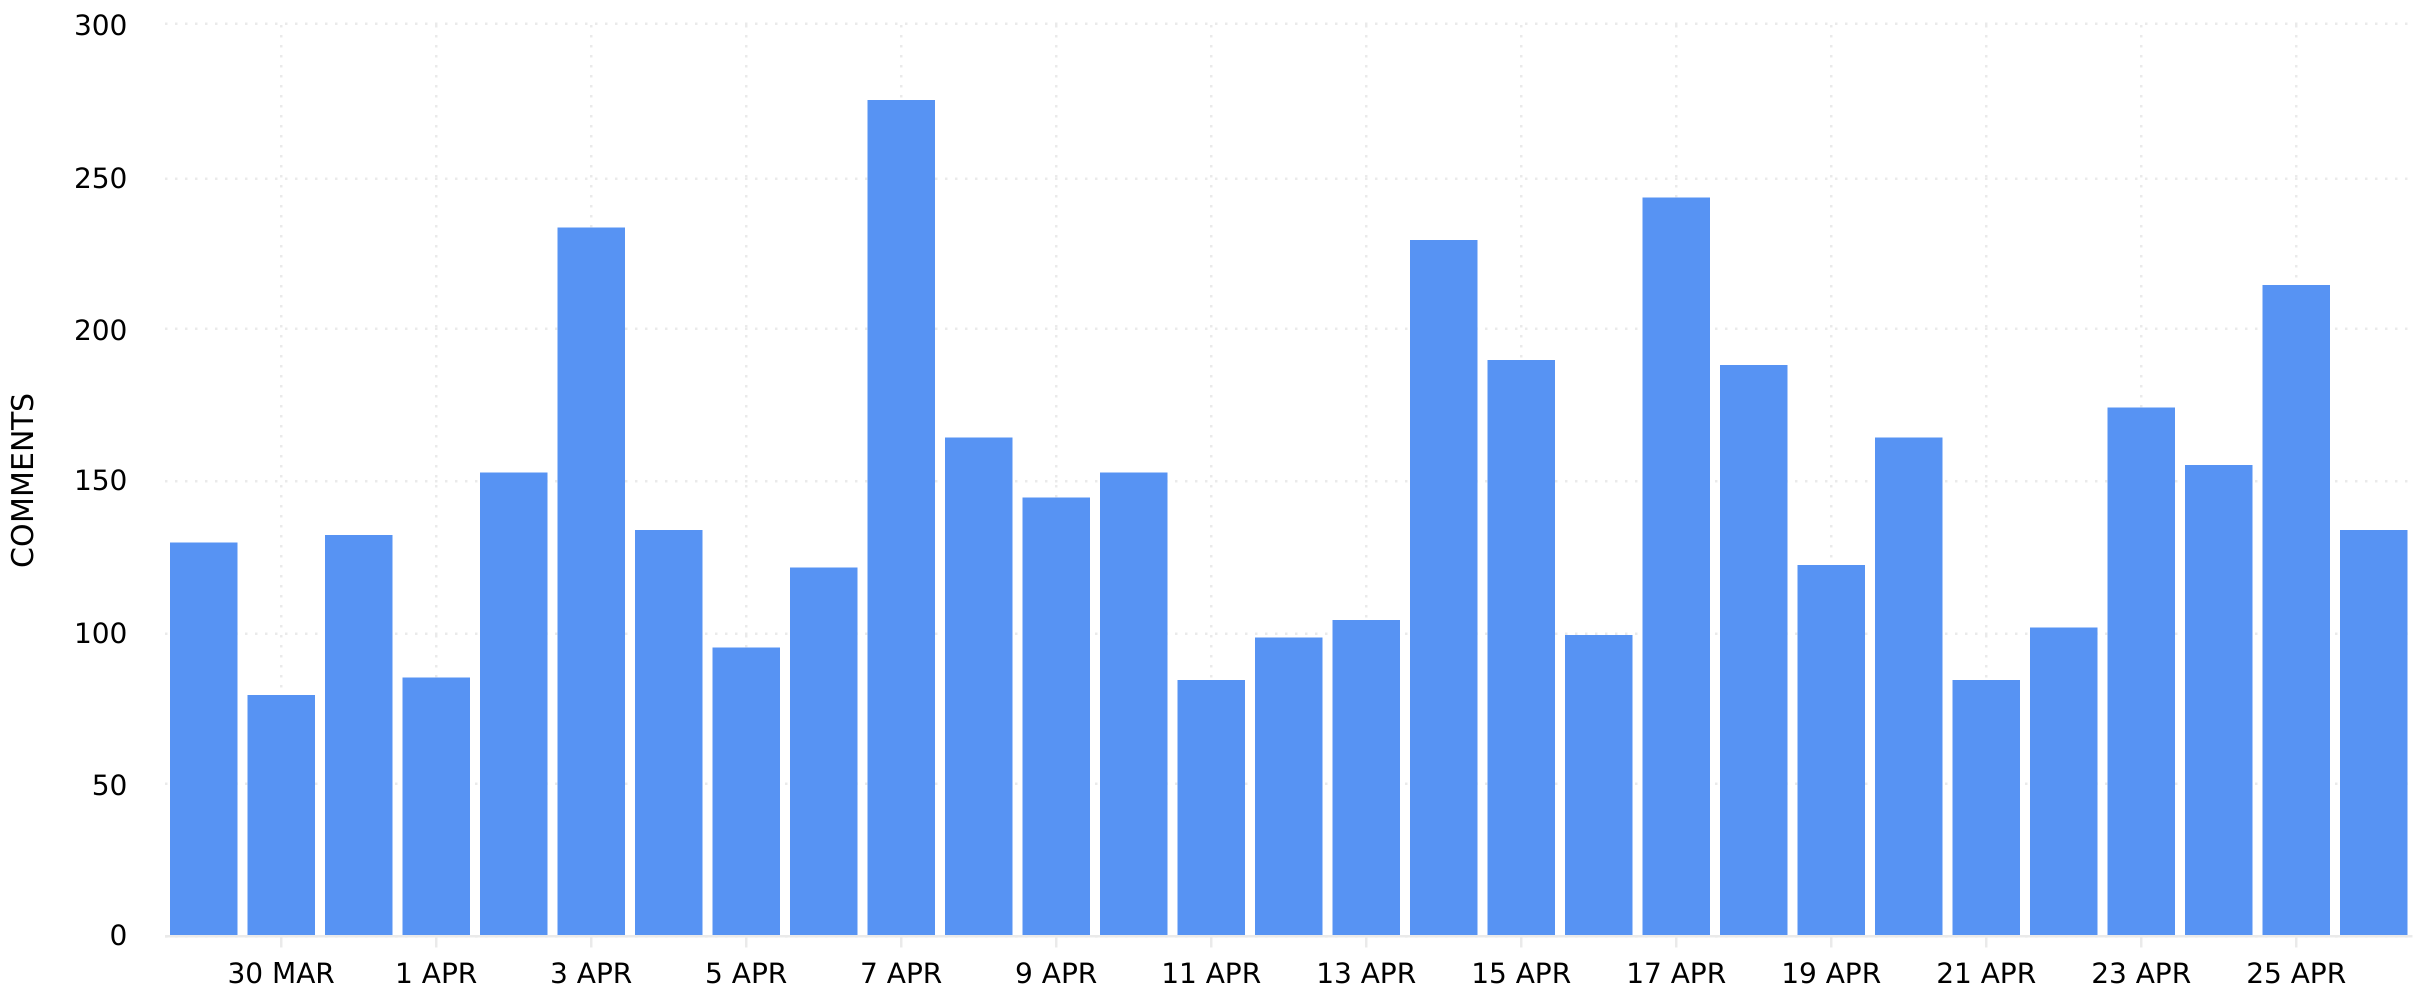
Comments
The number of comments on posts published during the selected date range.
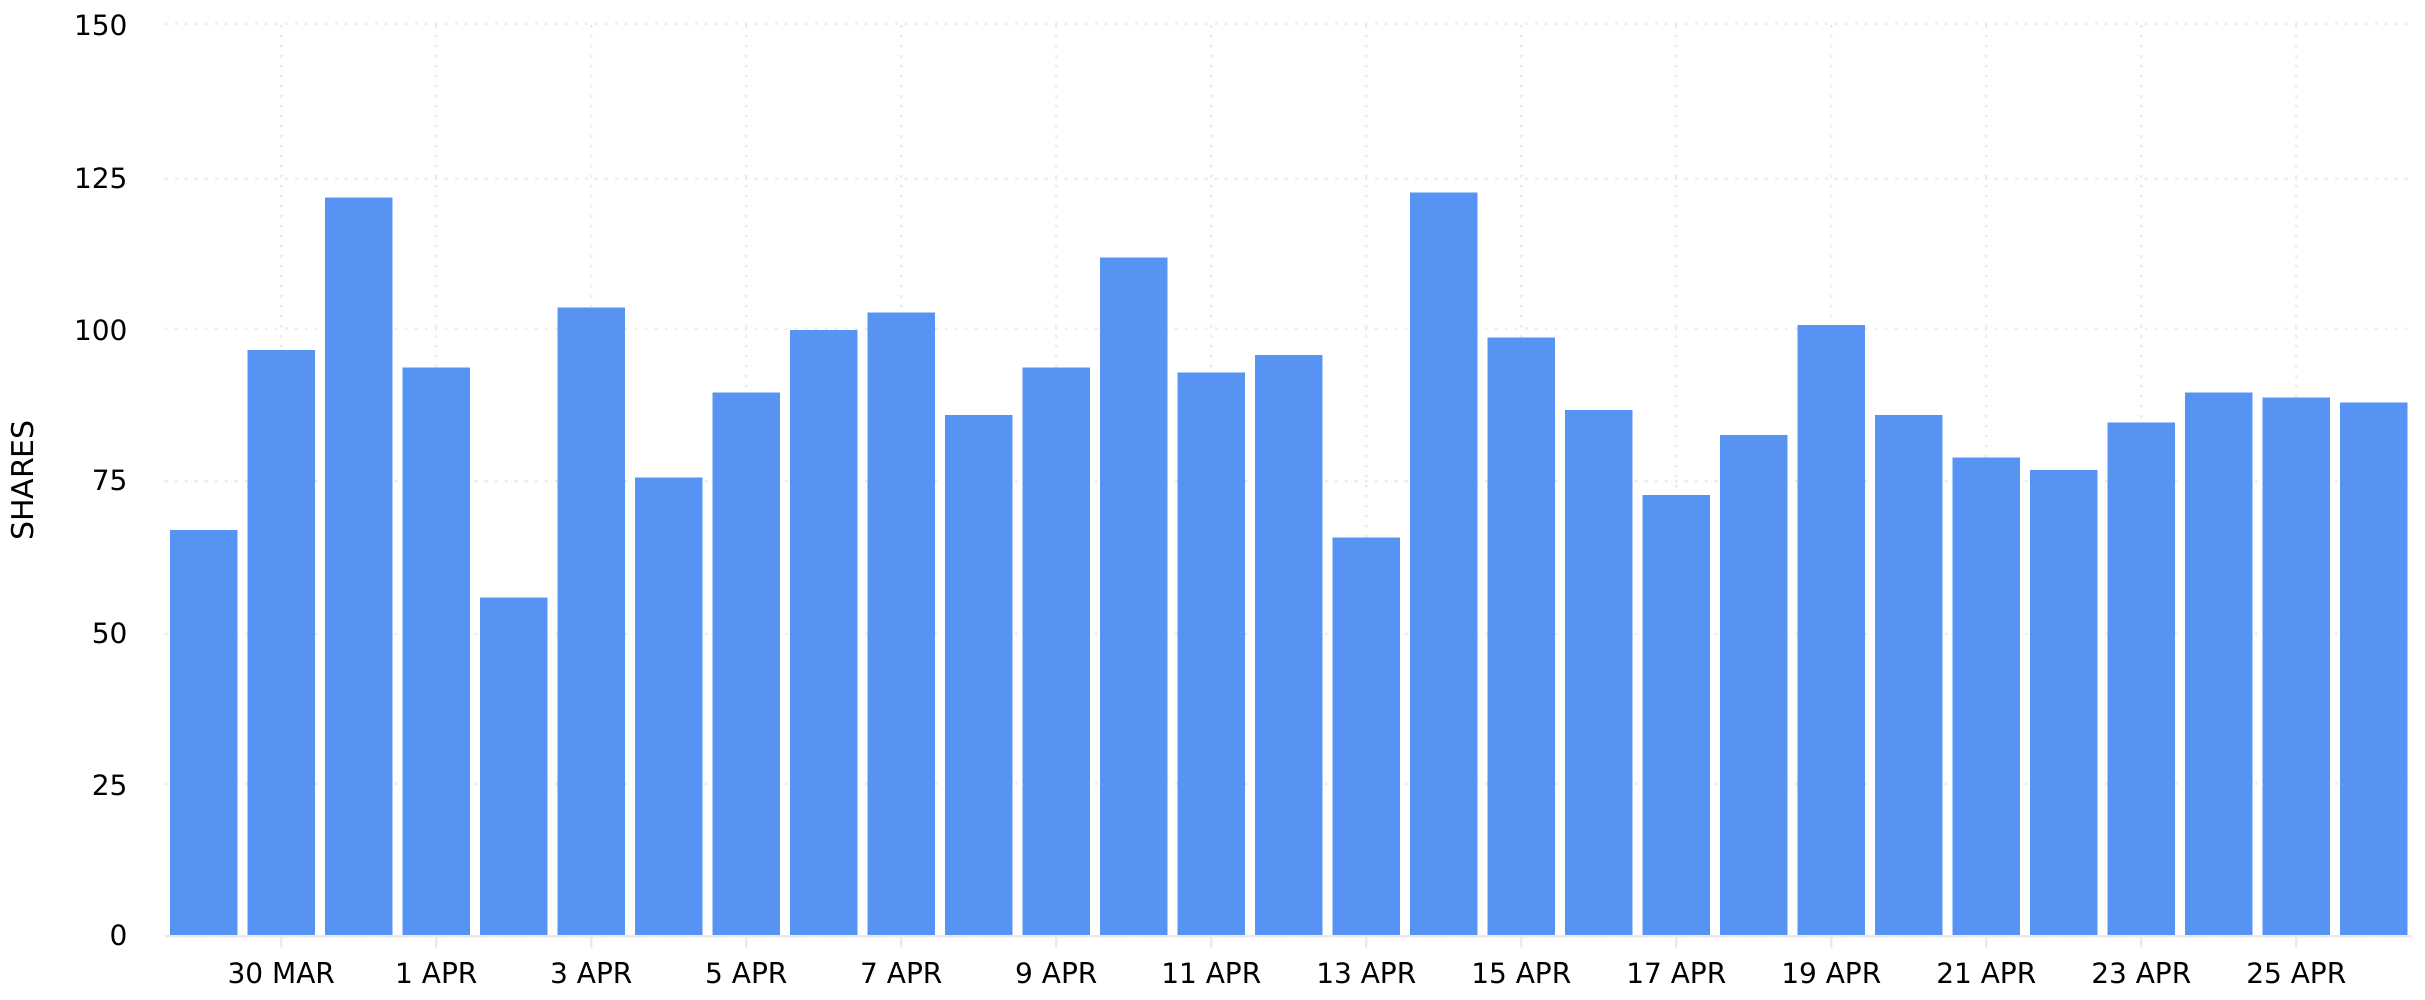
Shares
The number of times Posts published during the selected date range were shared.
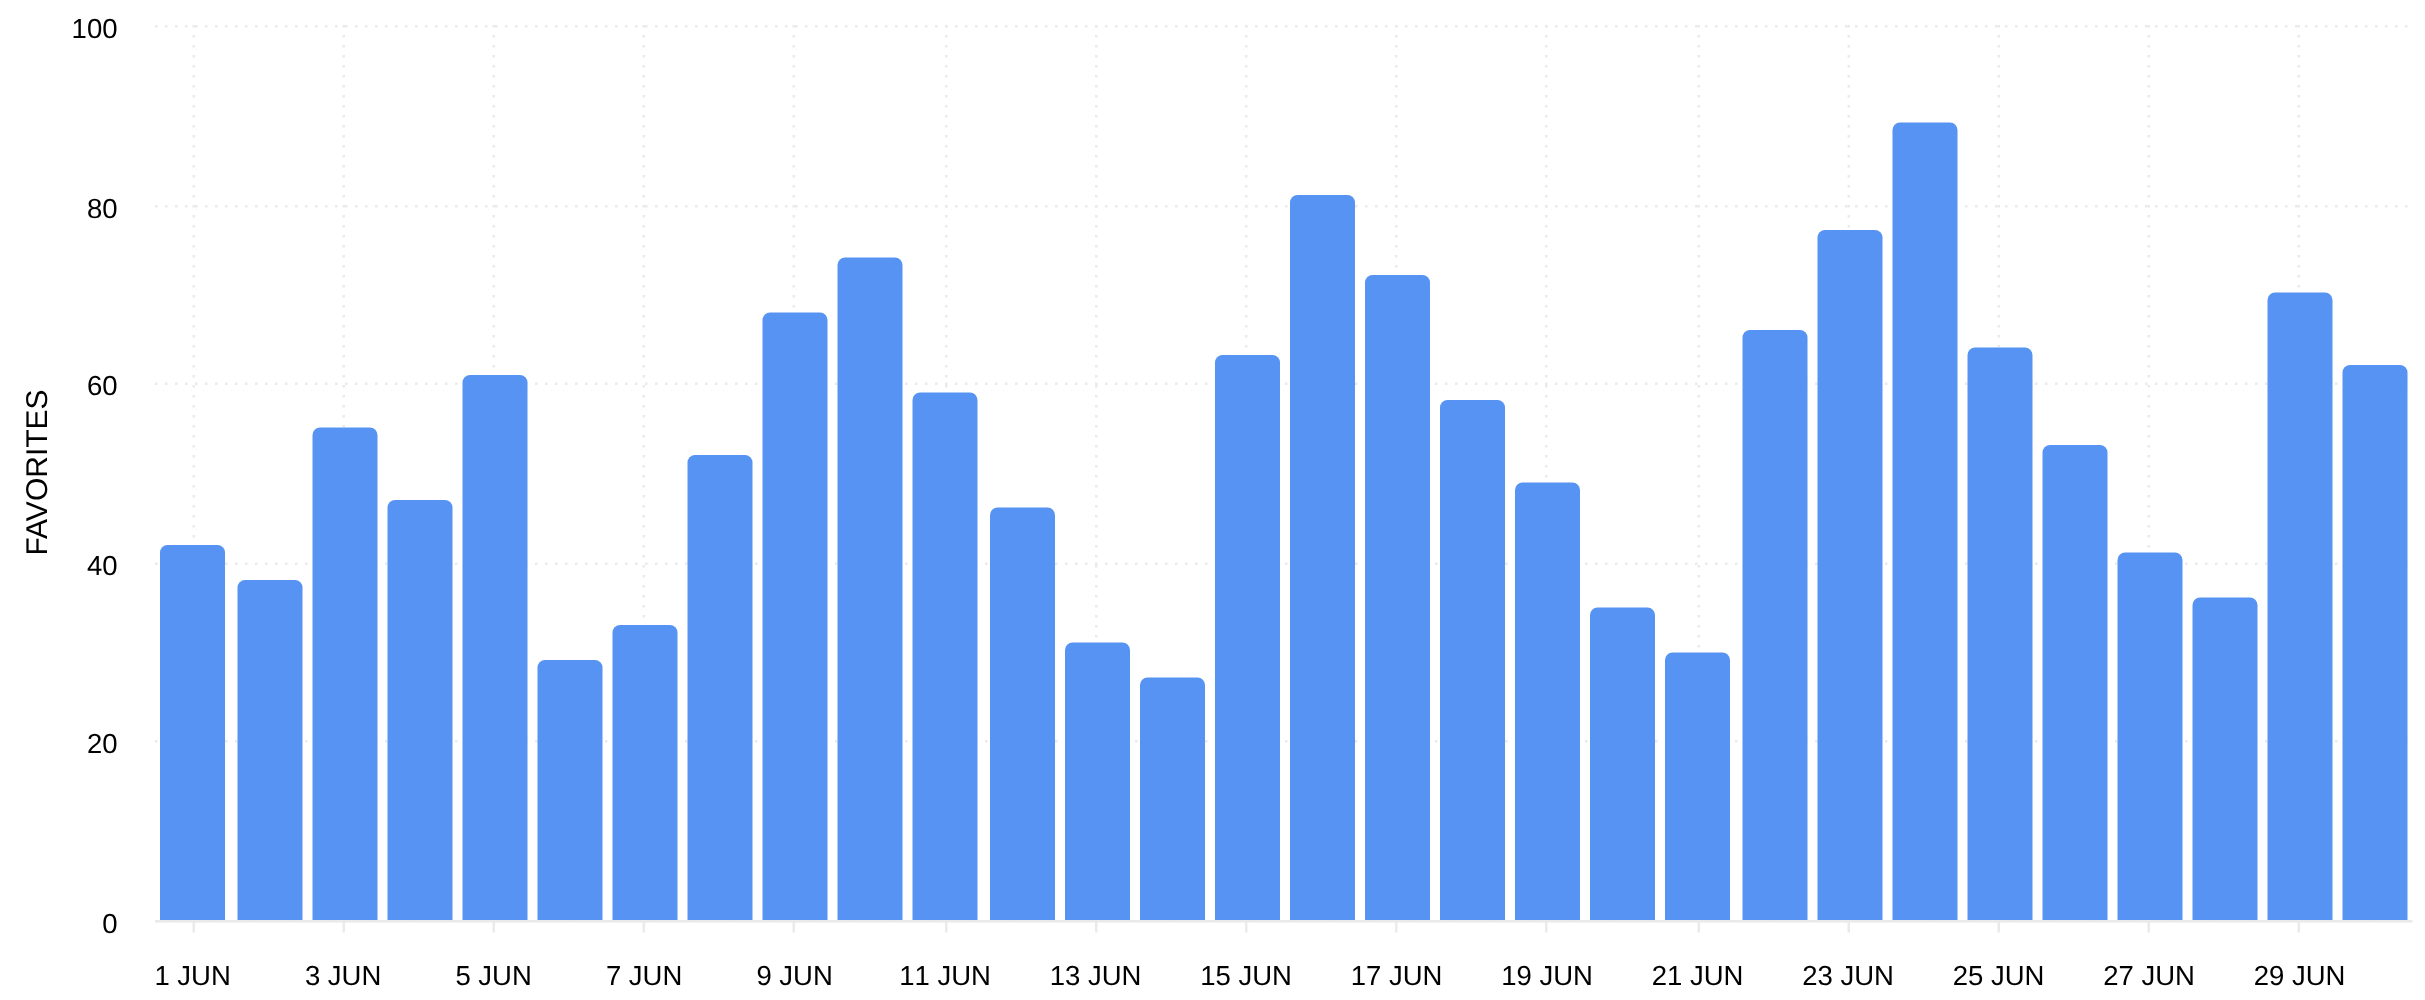
Favorites
The number of times Posts published during the selected date range were added to Favorites.
Post Engagement Rate
The sum of Likes, Comments and Shares divided by the number of Views on a given day during the selected date range. This shows the percentage of Views that resulted in interactions, for Posts published during the selected date range.
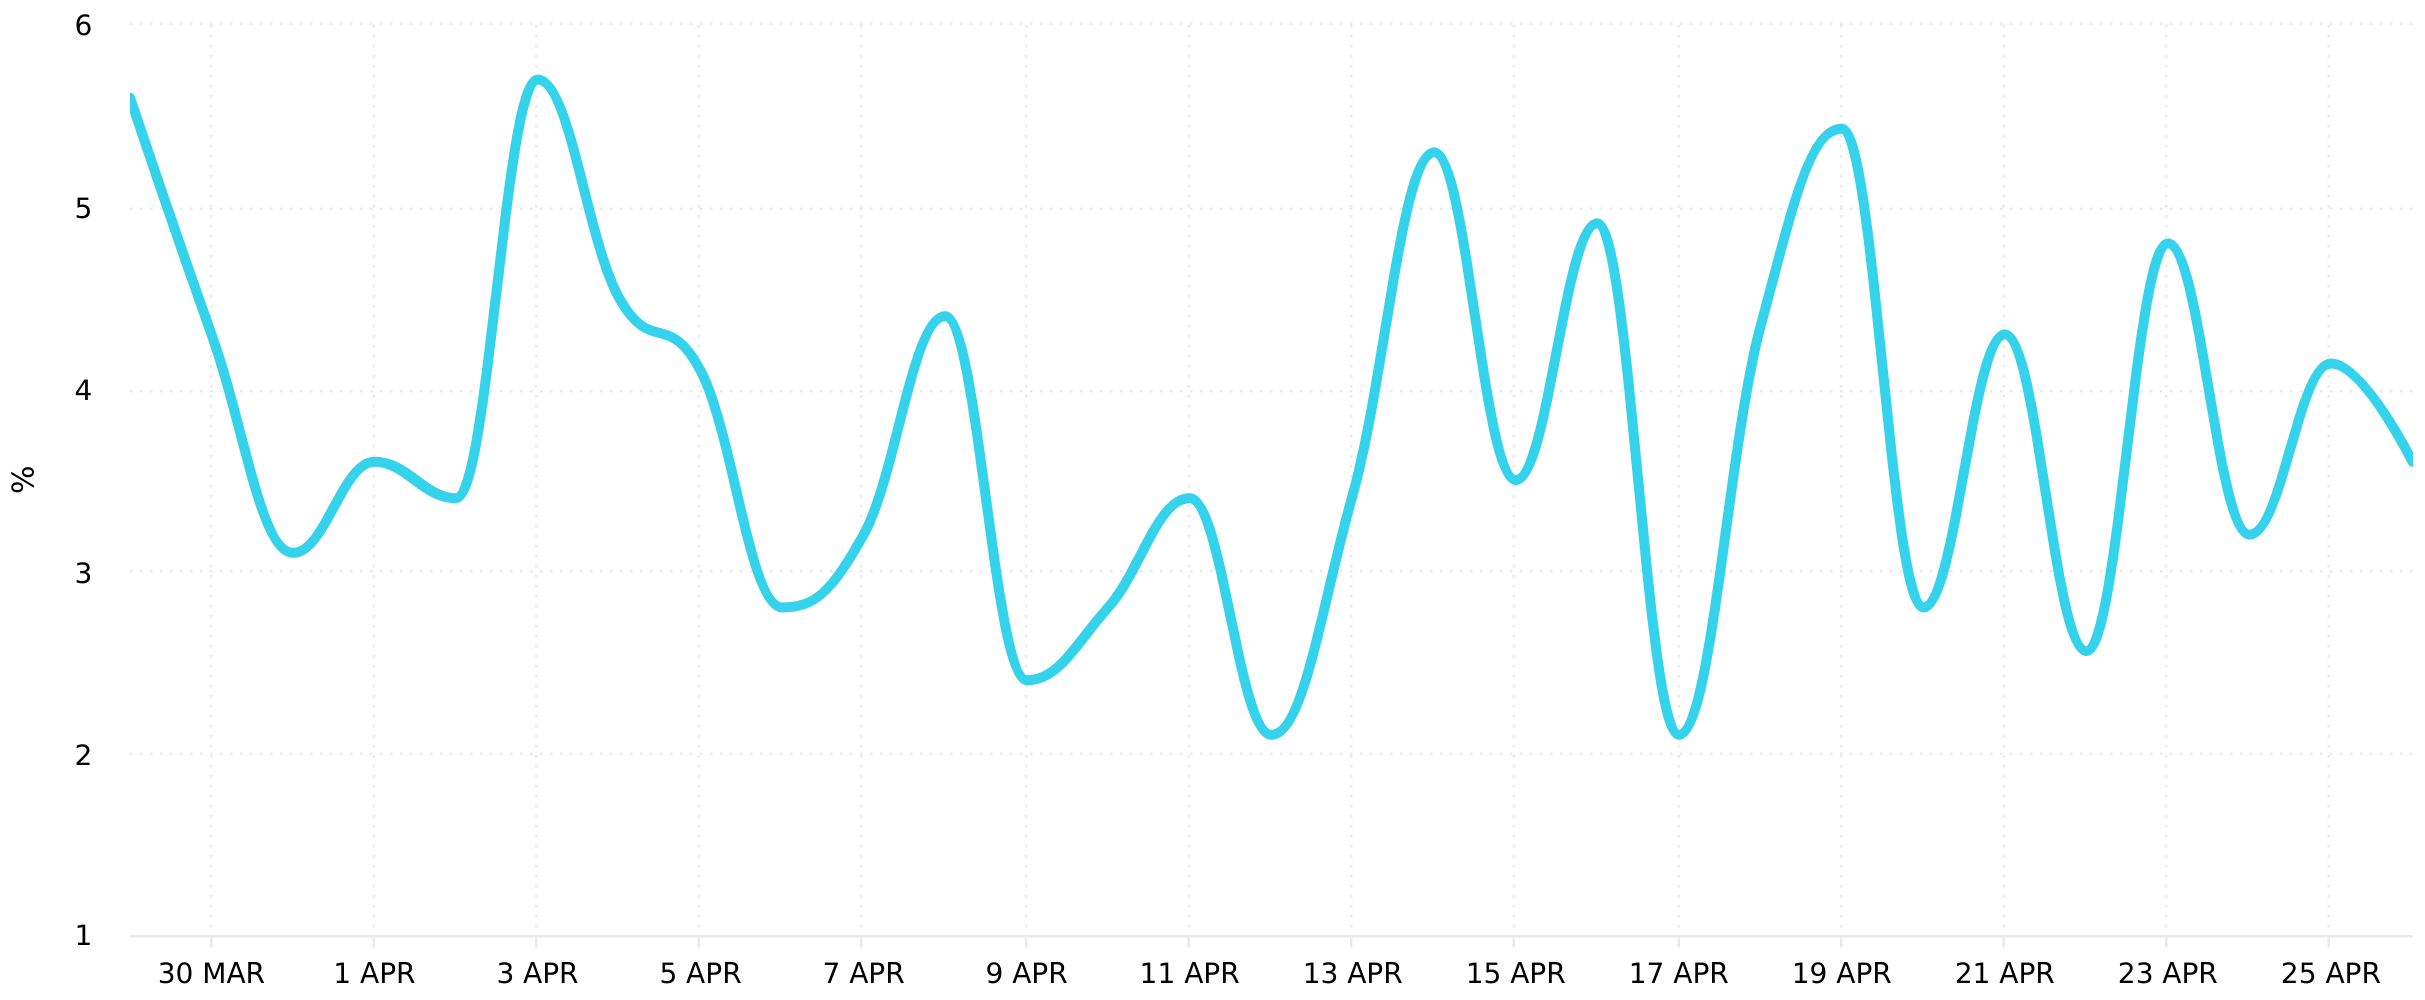
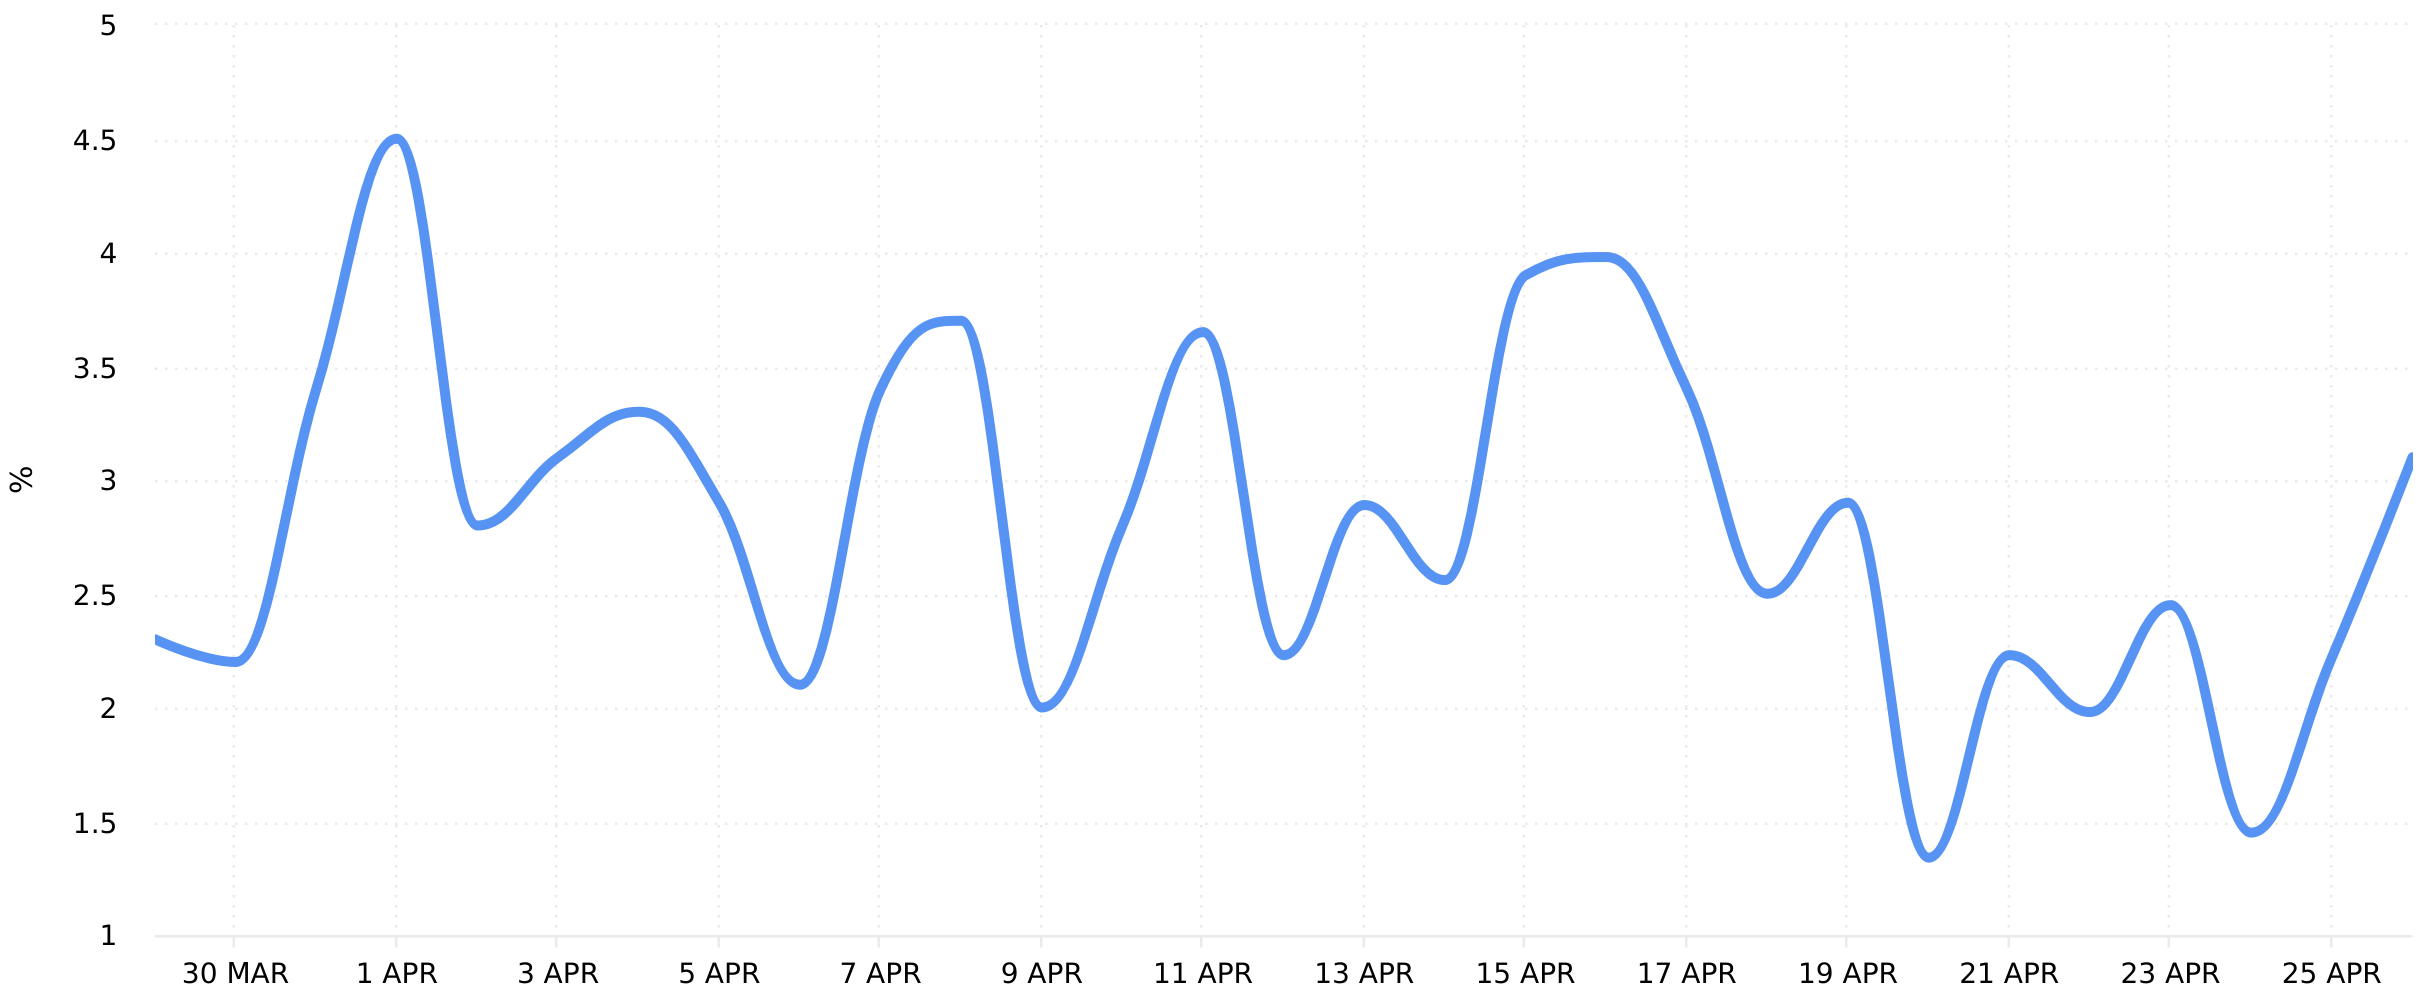
The graph shows the average Engagement Rate of Posts published during the selected date range, calculated daily, weekly or monthly depending on the period selected.
Reach Rate
The average Reach Rate of Posts published on a given day during the selected date range. Calculated by dividing Reach by the number of followers. This metric shows how many people saw your Posts relative to your follower count.
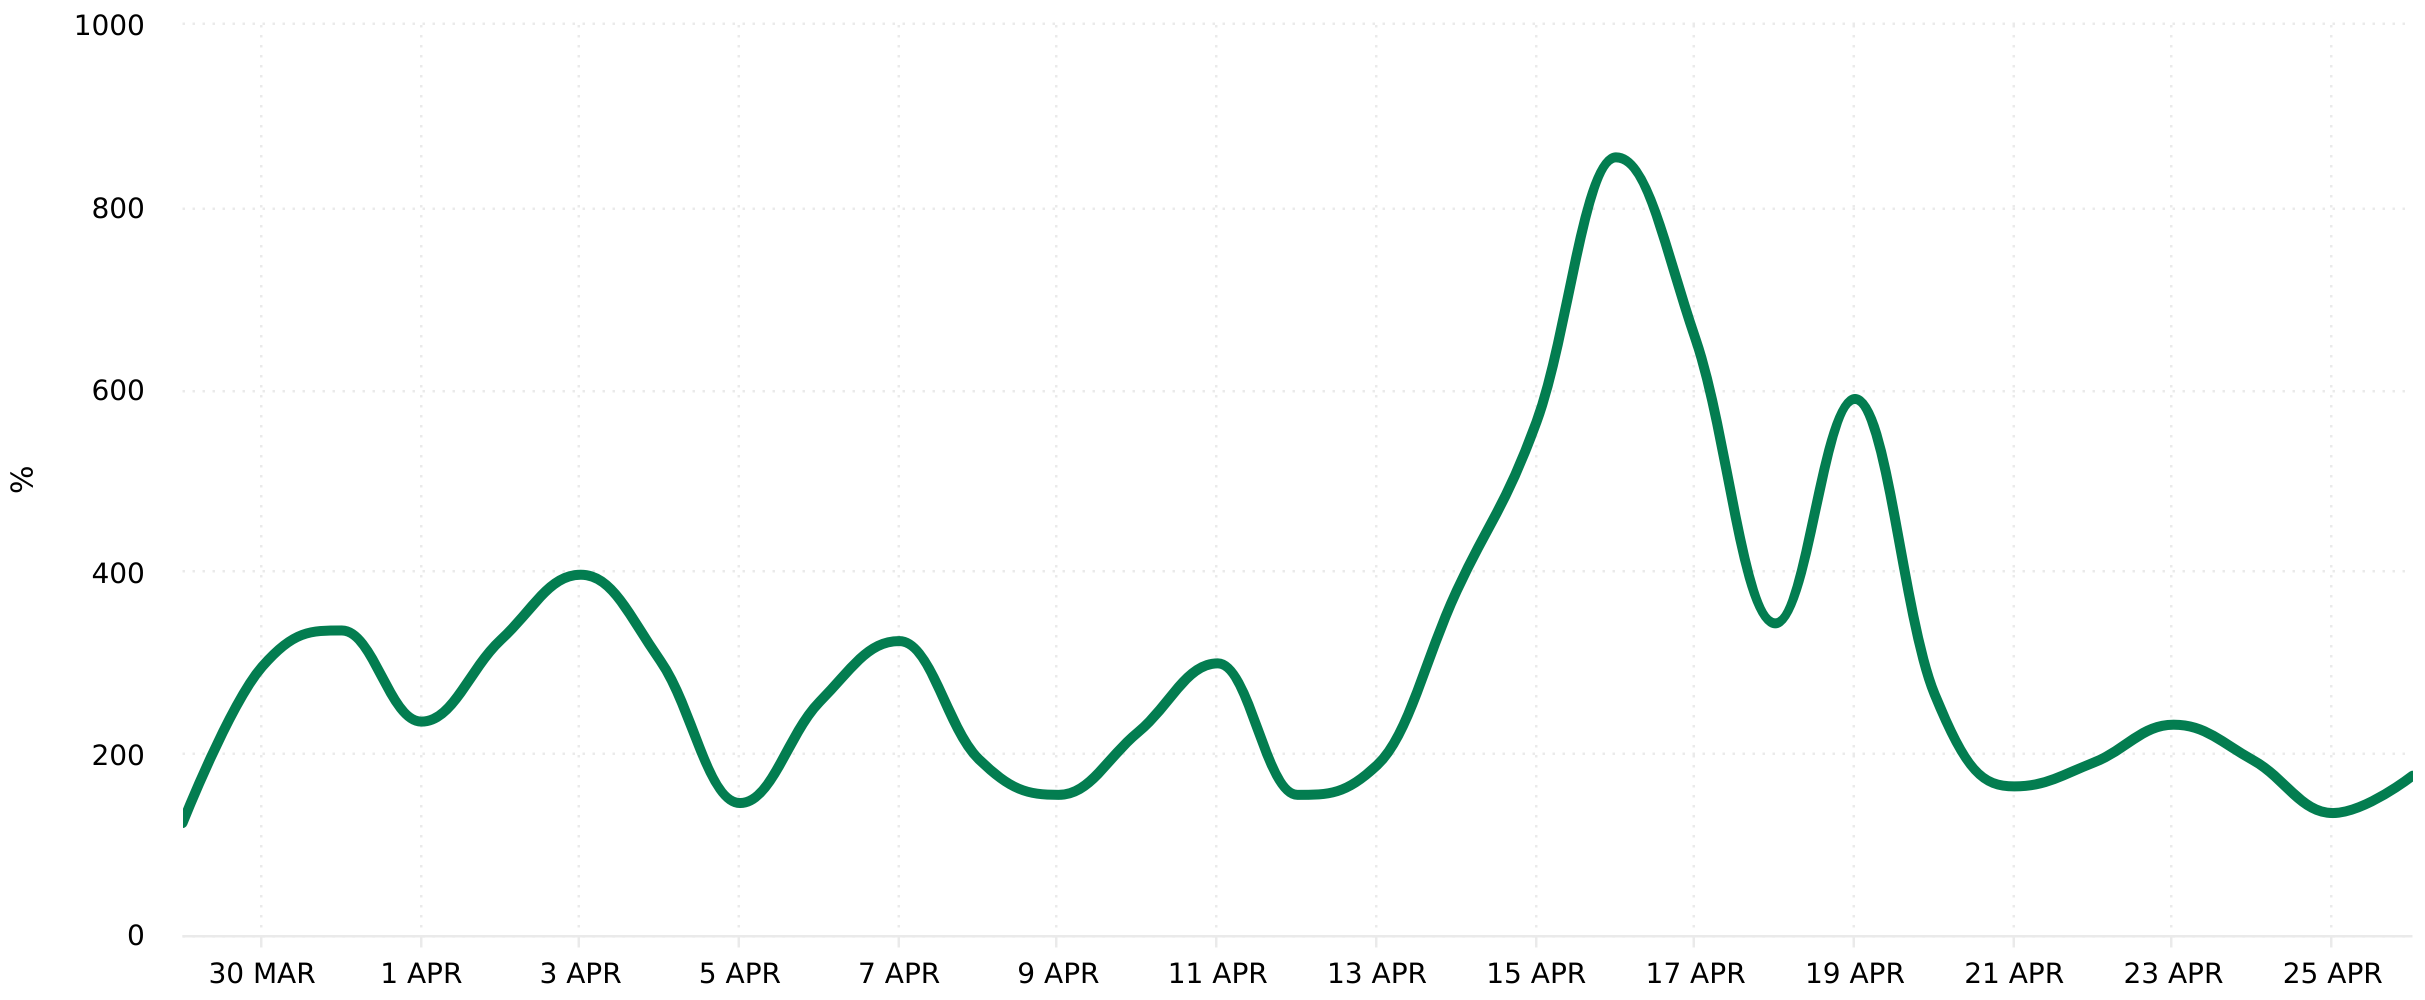
Engagement Rate by Reach
The average Engagement Rate by Reach of Posts published during the selected date range. Calculated as the sum of all Likes, Comments and Shares divided by Reach. Engagement Rate by Reach shows the percentage of accounts reached who interacted with your Posts.
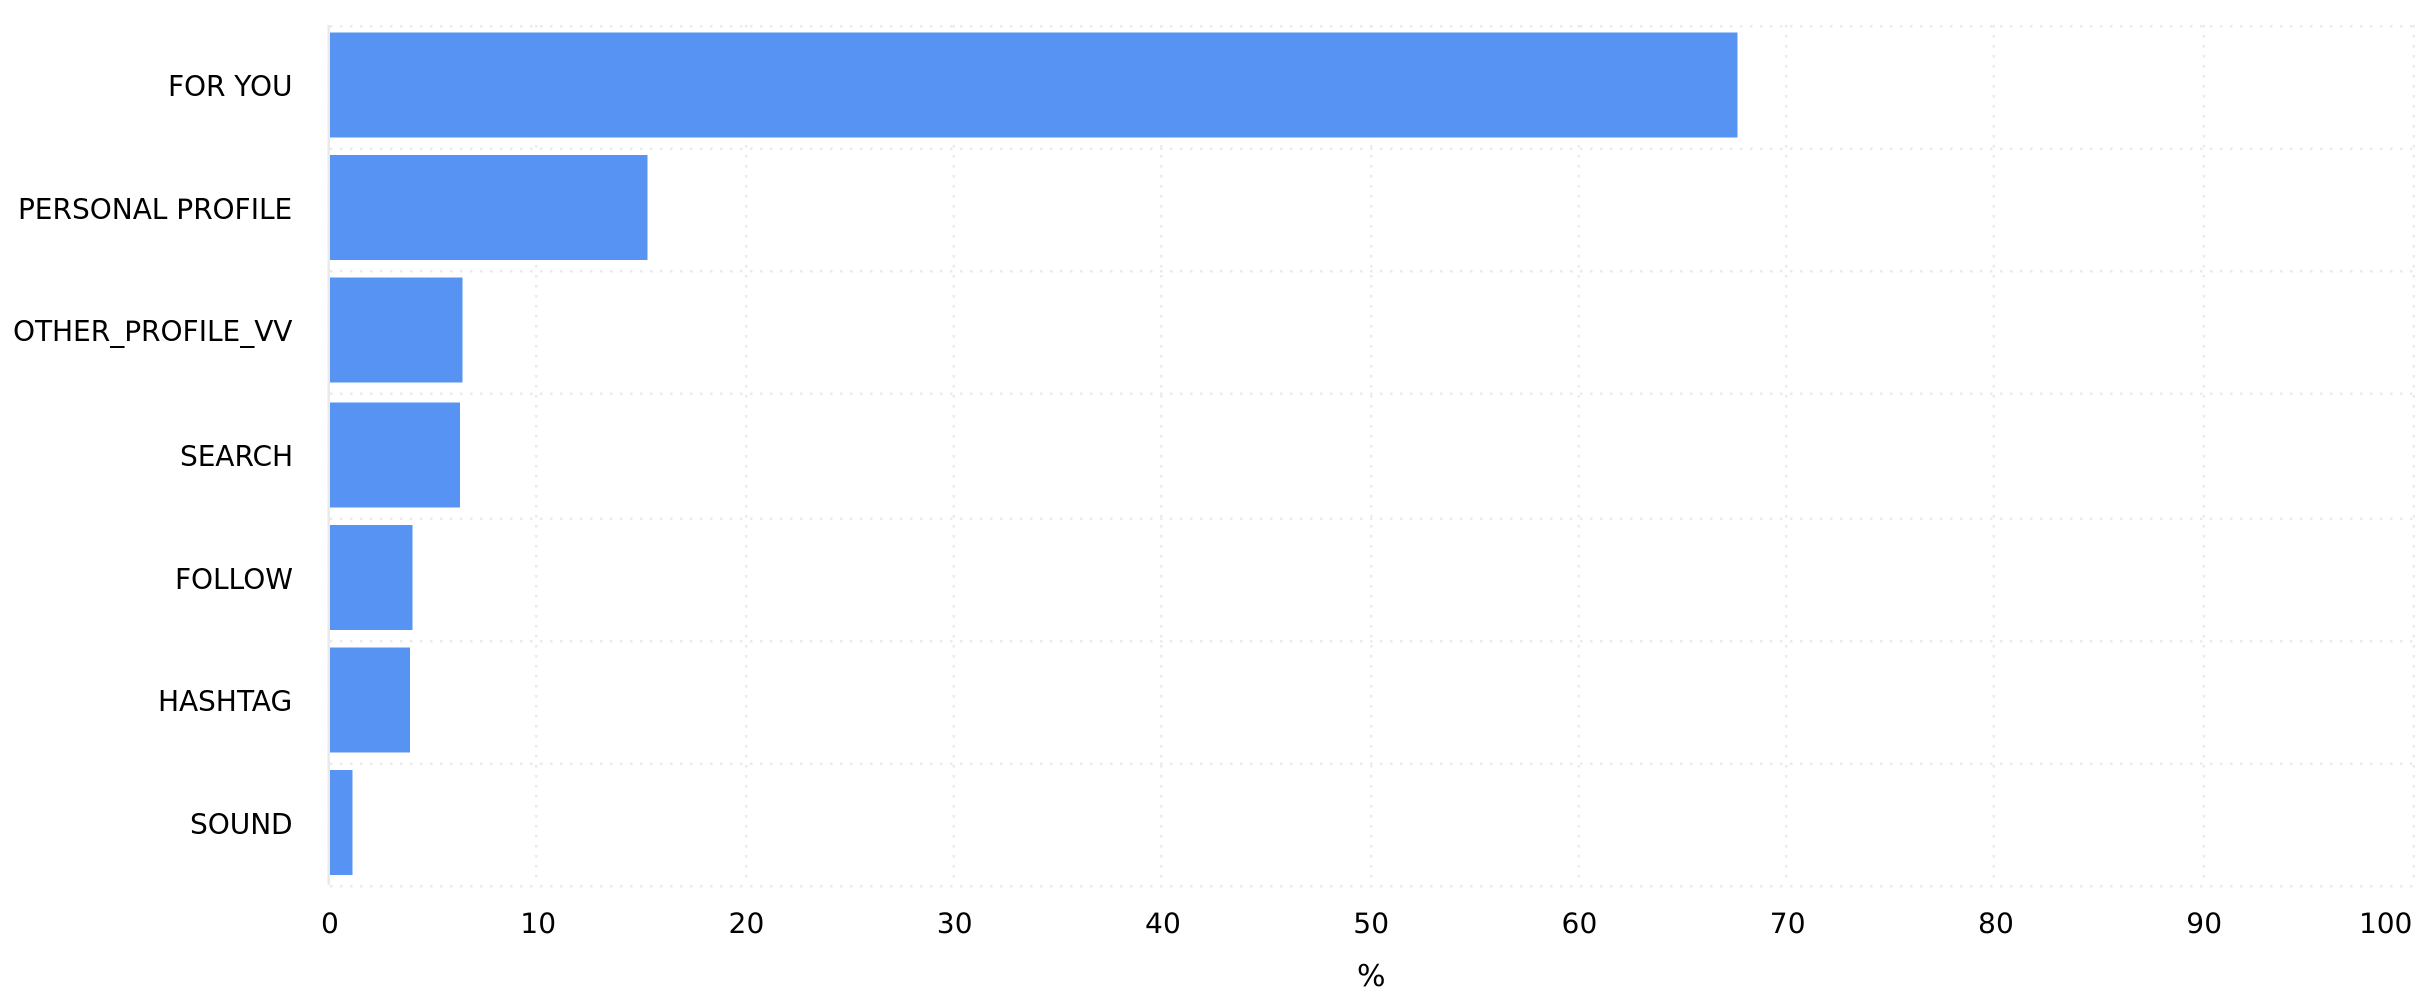
Source of Impressions
The list of places where viewers discovered Posts published during the selected date range, ranked by the number of impressions.
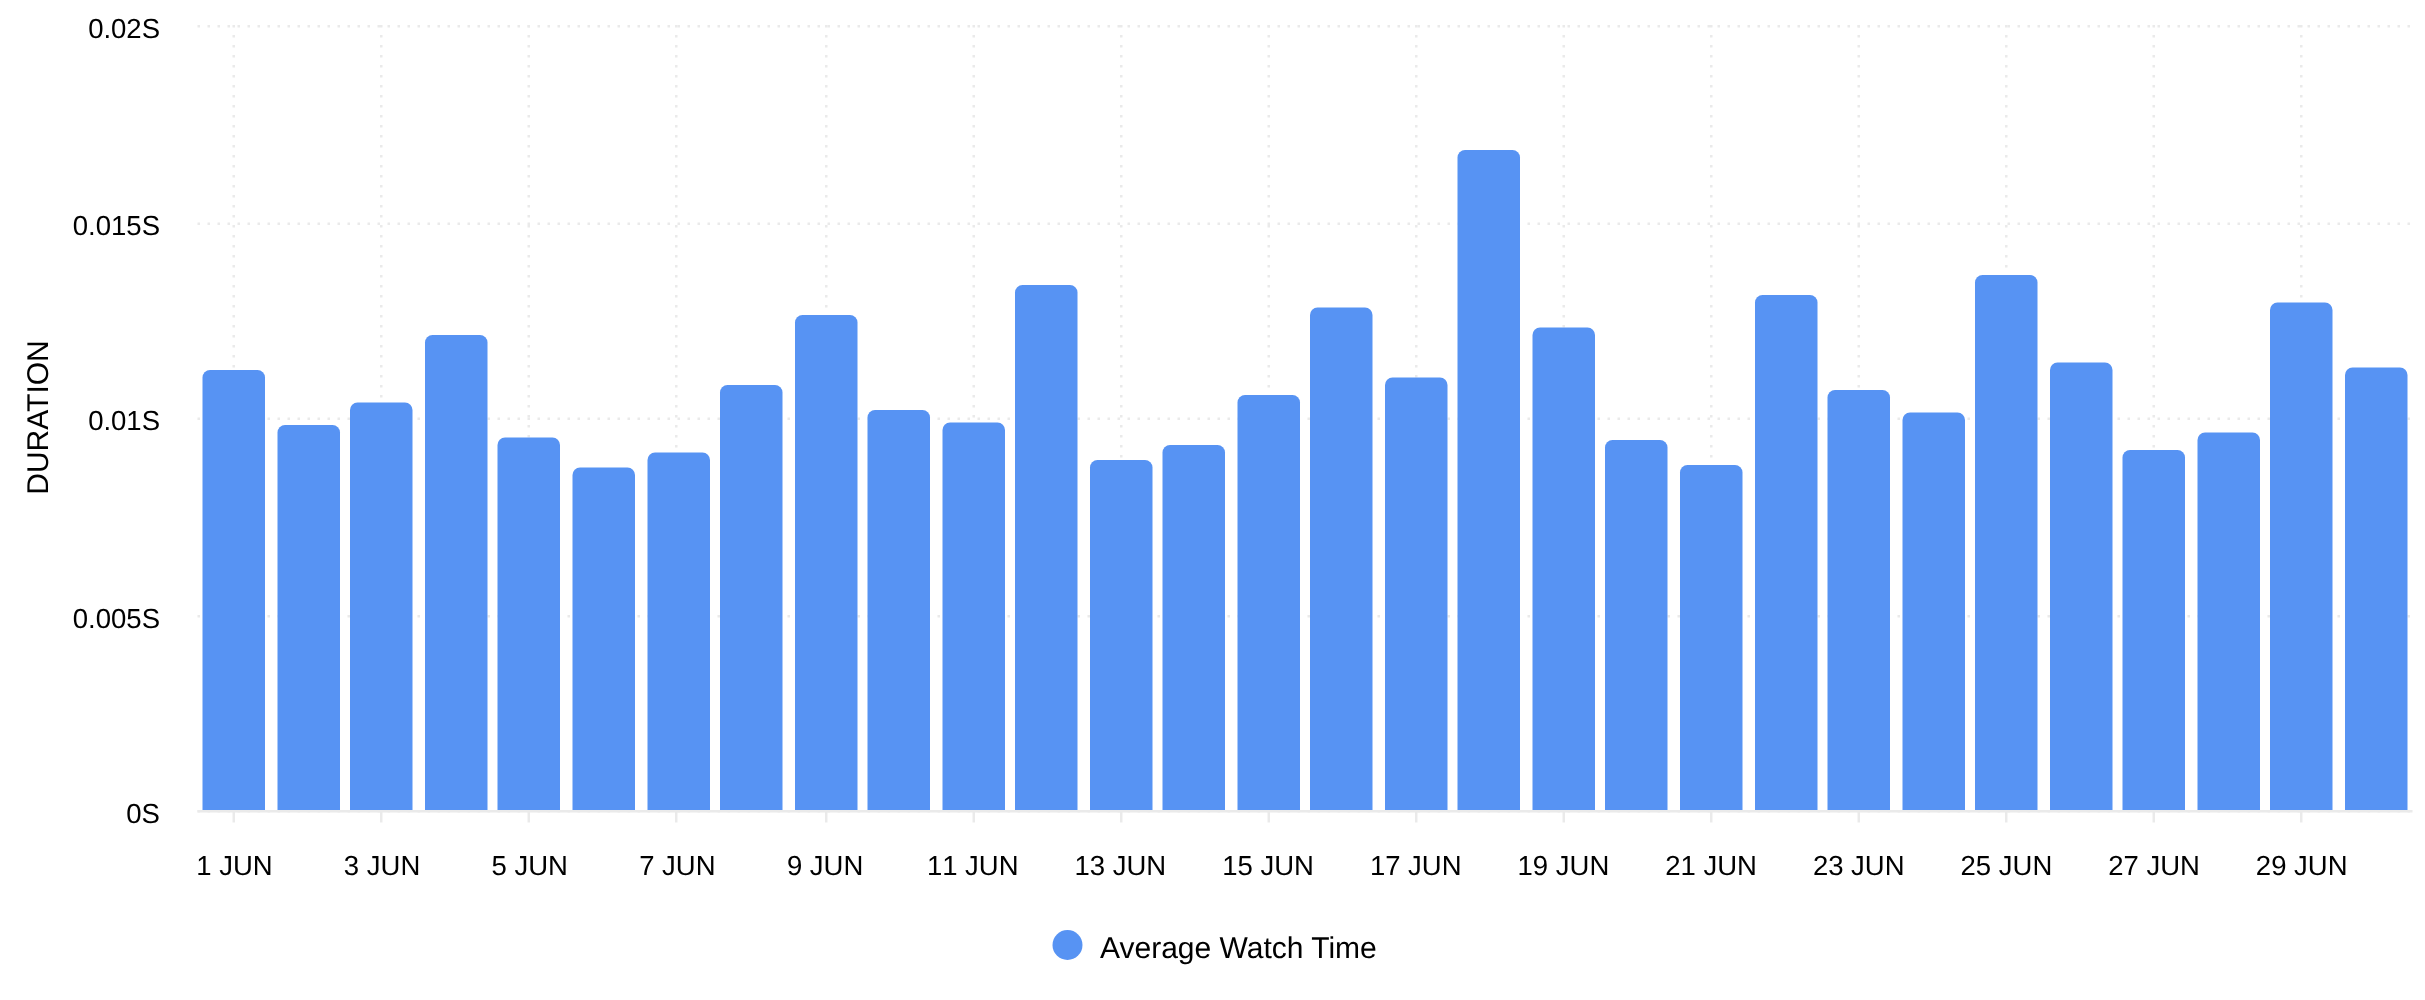
Average Watch Time
The average watch time of posts published during the selected date range.
Best Time to Post
The average Engagement Rate of Posts published at specific times of day and days of the week.
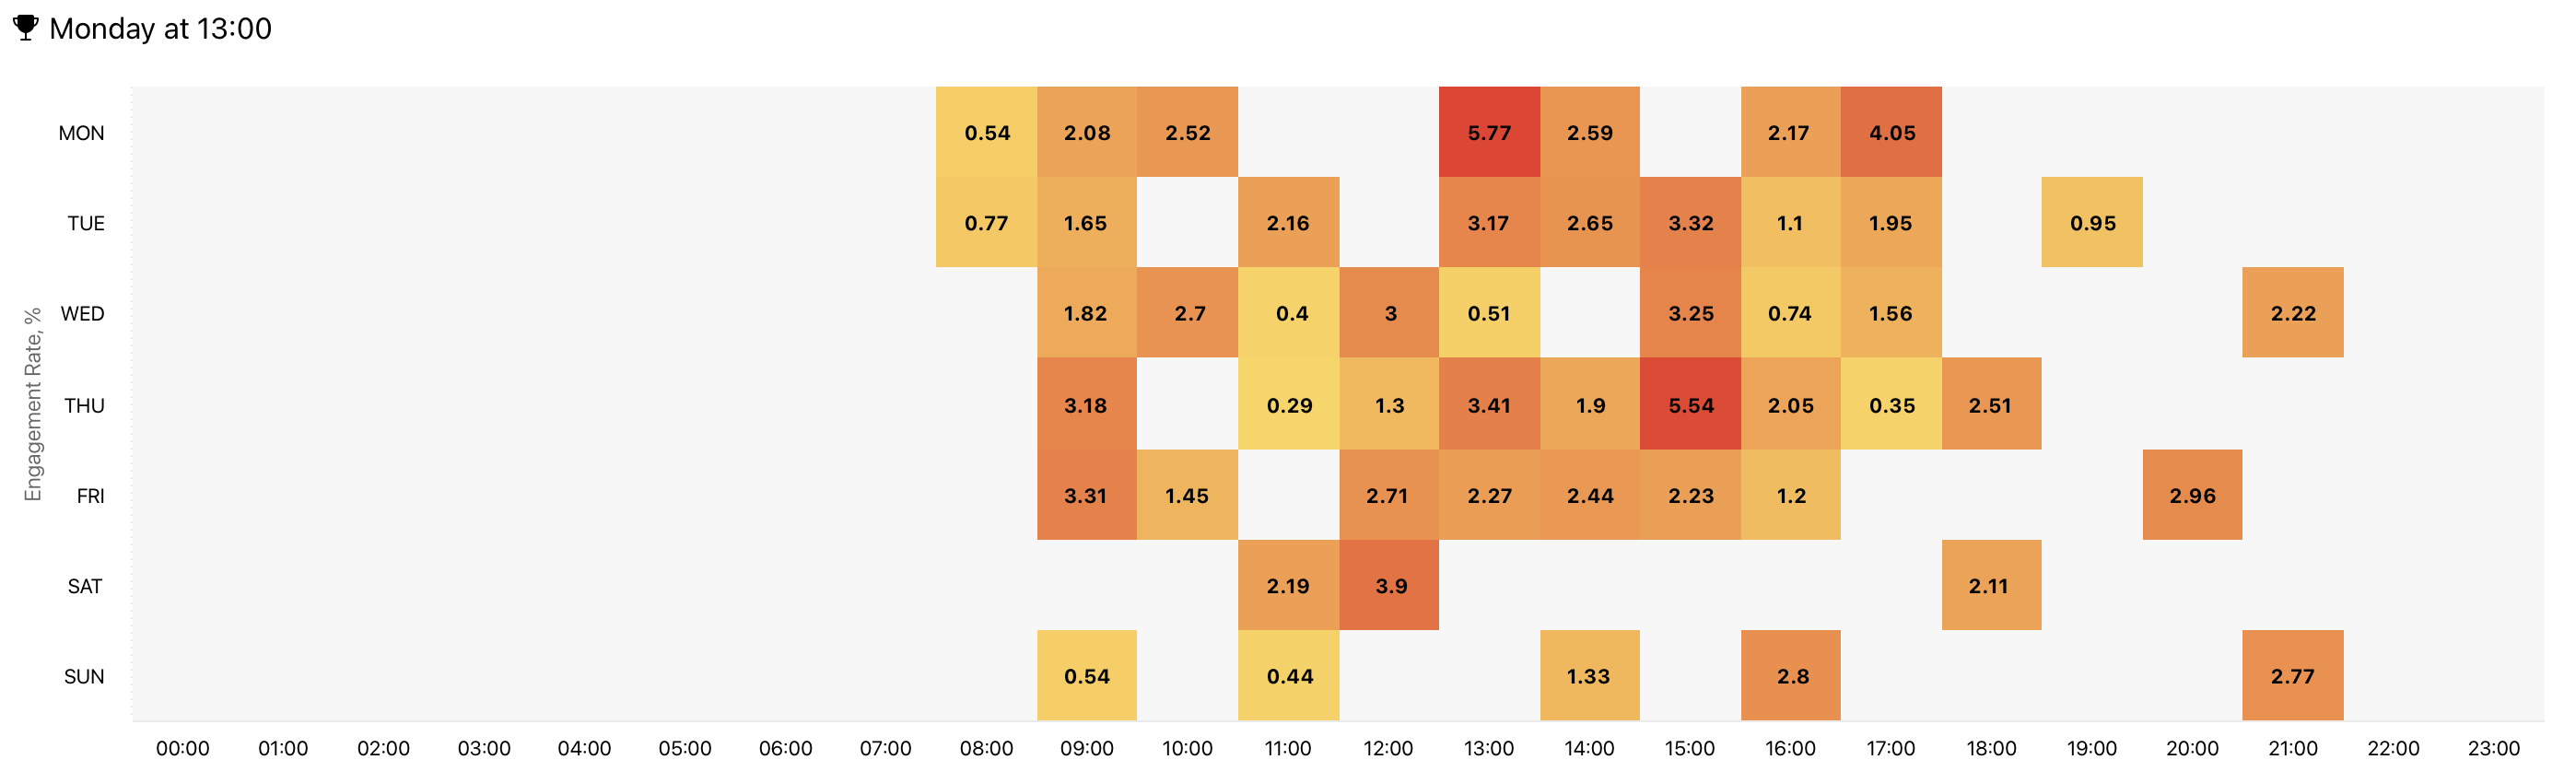
Note: Times are shown in your account's timezone. Times with no published posts show no data.
Posts
All posts published during the selected date range, with individual metrics for each post. Sort by any metric to surface your top-performing content. You can also view detailed performance data for your posts in the first 72 hours after publishing.
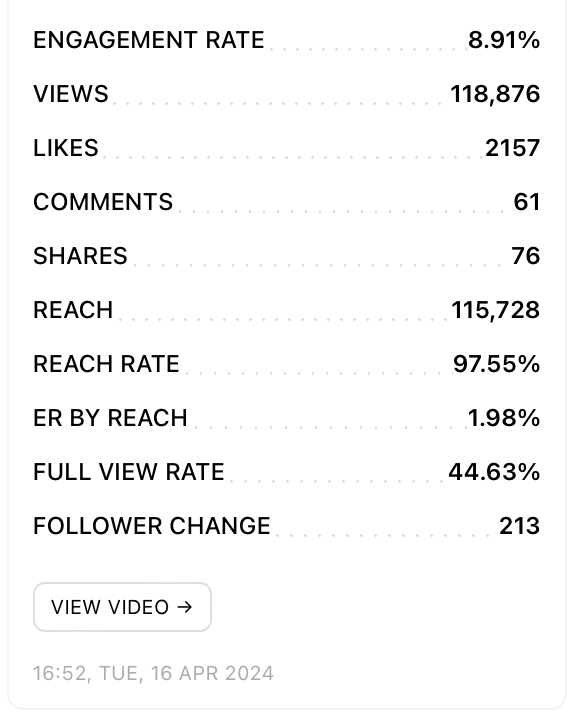
Follower Change
The change in the number of followers on the profile in the first 24 hours after the post was published. This data is available on the Gold, Platinum, and Agency plans and free trials.
Full View Rate
The percentage of Views where the video was watched in full.