A Look Back At Minter.io In 2020
2020 has certainly been a year that’ll be difficult to forget. At Minter.io, we’ve been working that little bit harder to make your life online that little bit smoother, so we thought we’d take a look back at all the new mods and cons we’ve added to Minter.io this year.
Ads Section For Instagram
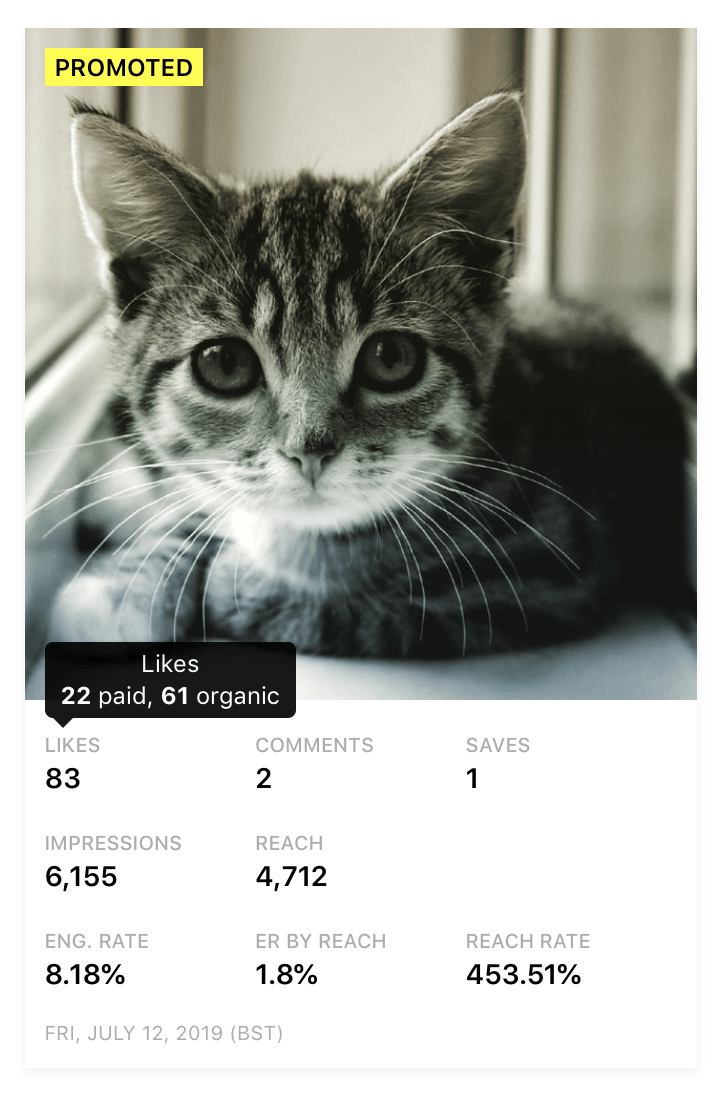
Before this year, your Minter.io analytics covered organic and promoted posts for Instagram. As we have witnessed so many of your companies grow and develop ads on social media, we have grown and adapted alongside you to give you all the information you need to keep you going from strength to strength. Creating an ads section for your Instagram analytics, covering both dark and promoted posts, was a logical step to give you more information across more of the posts that matter to you.
The Ads section gives you access to performance metrics for all your Instagram promoted posts and your separately created Instagram ads (dark posts). It also gives you a breakdown of your paid and organic likes and comments and a breakdown of your paid and organic reach and impressions for promoted posts. Furthermore, the Ads section is the place for detailed analytics for your dark posts, including paid Likes, Comments, Reach, Impressions, Engagement Rate, and Ad Clicks.
Twitter Analytics
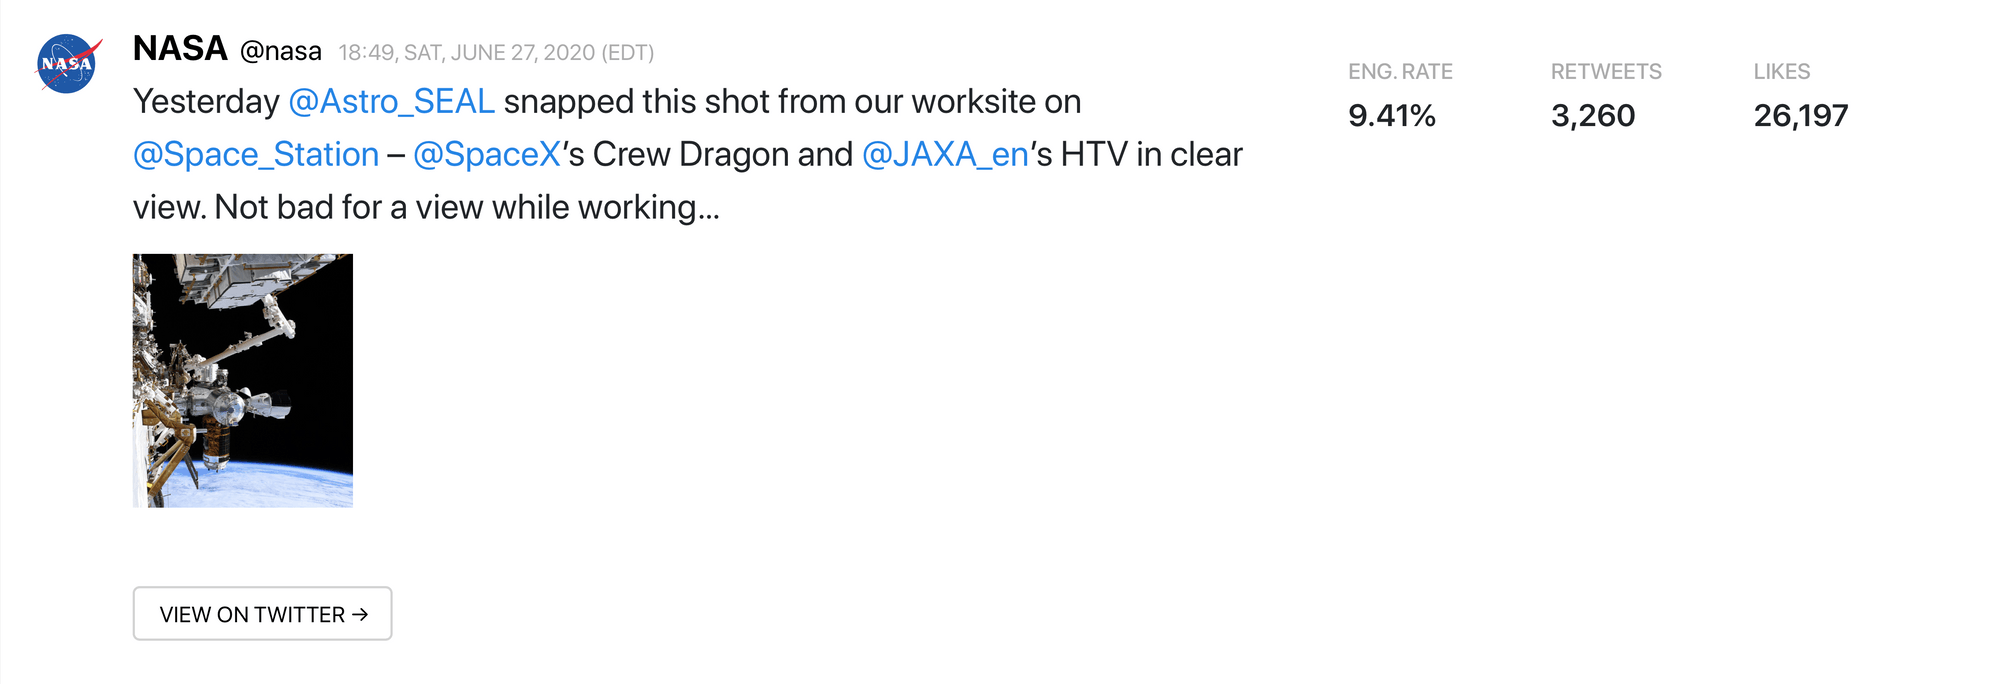
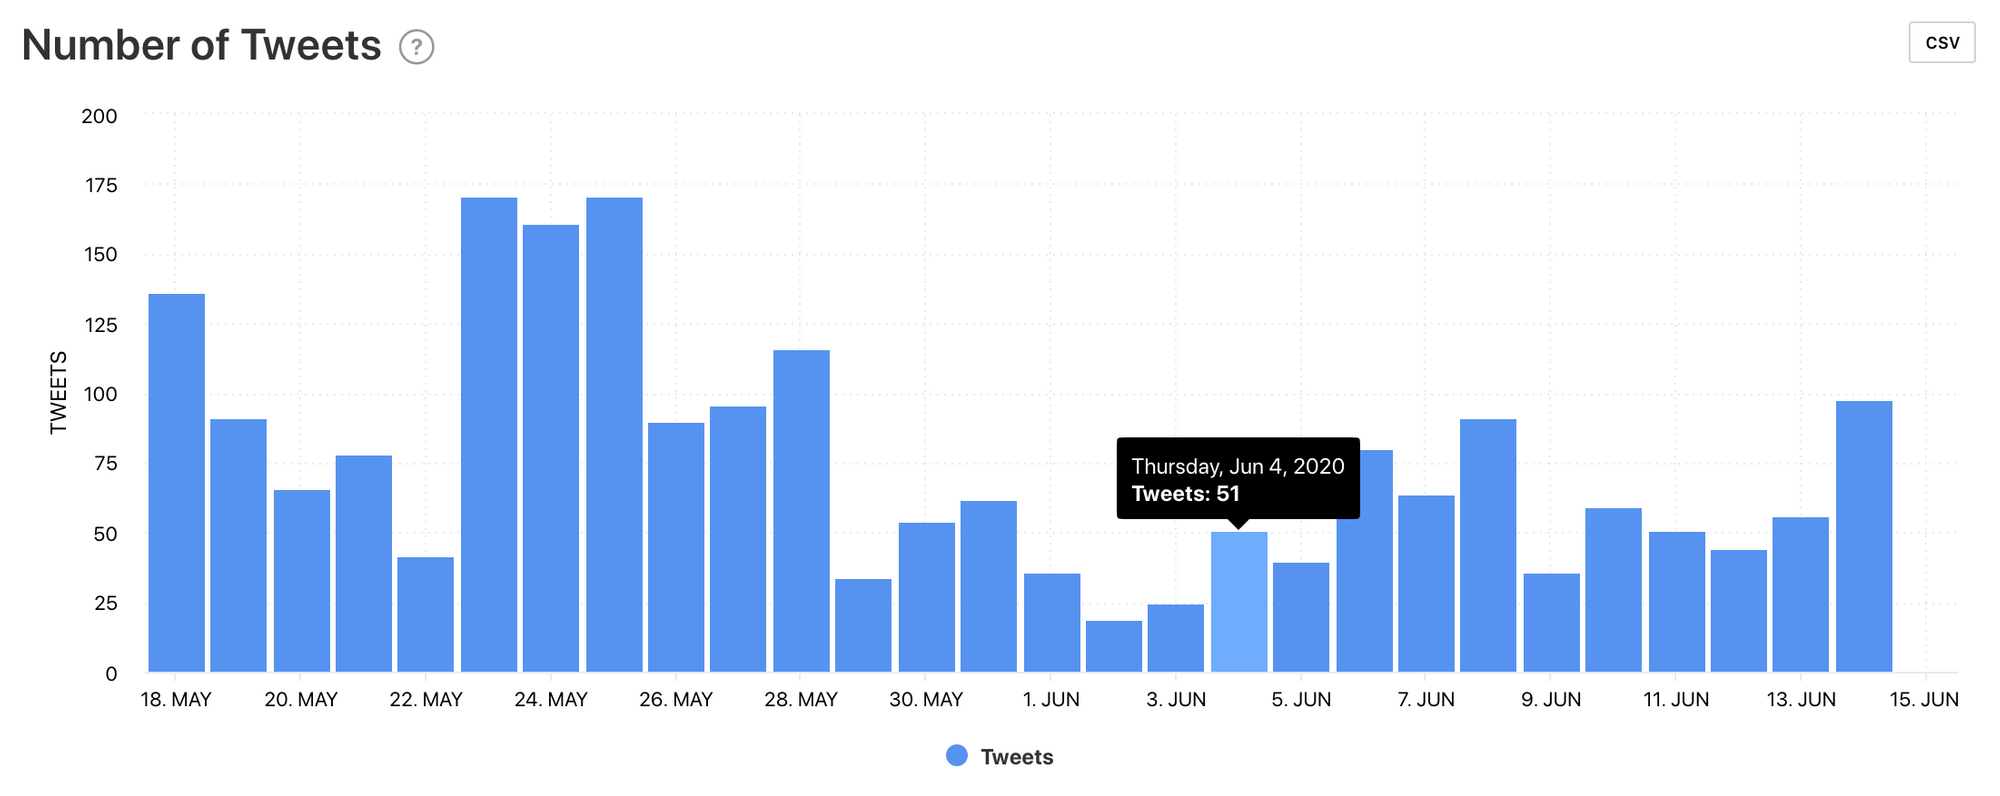
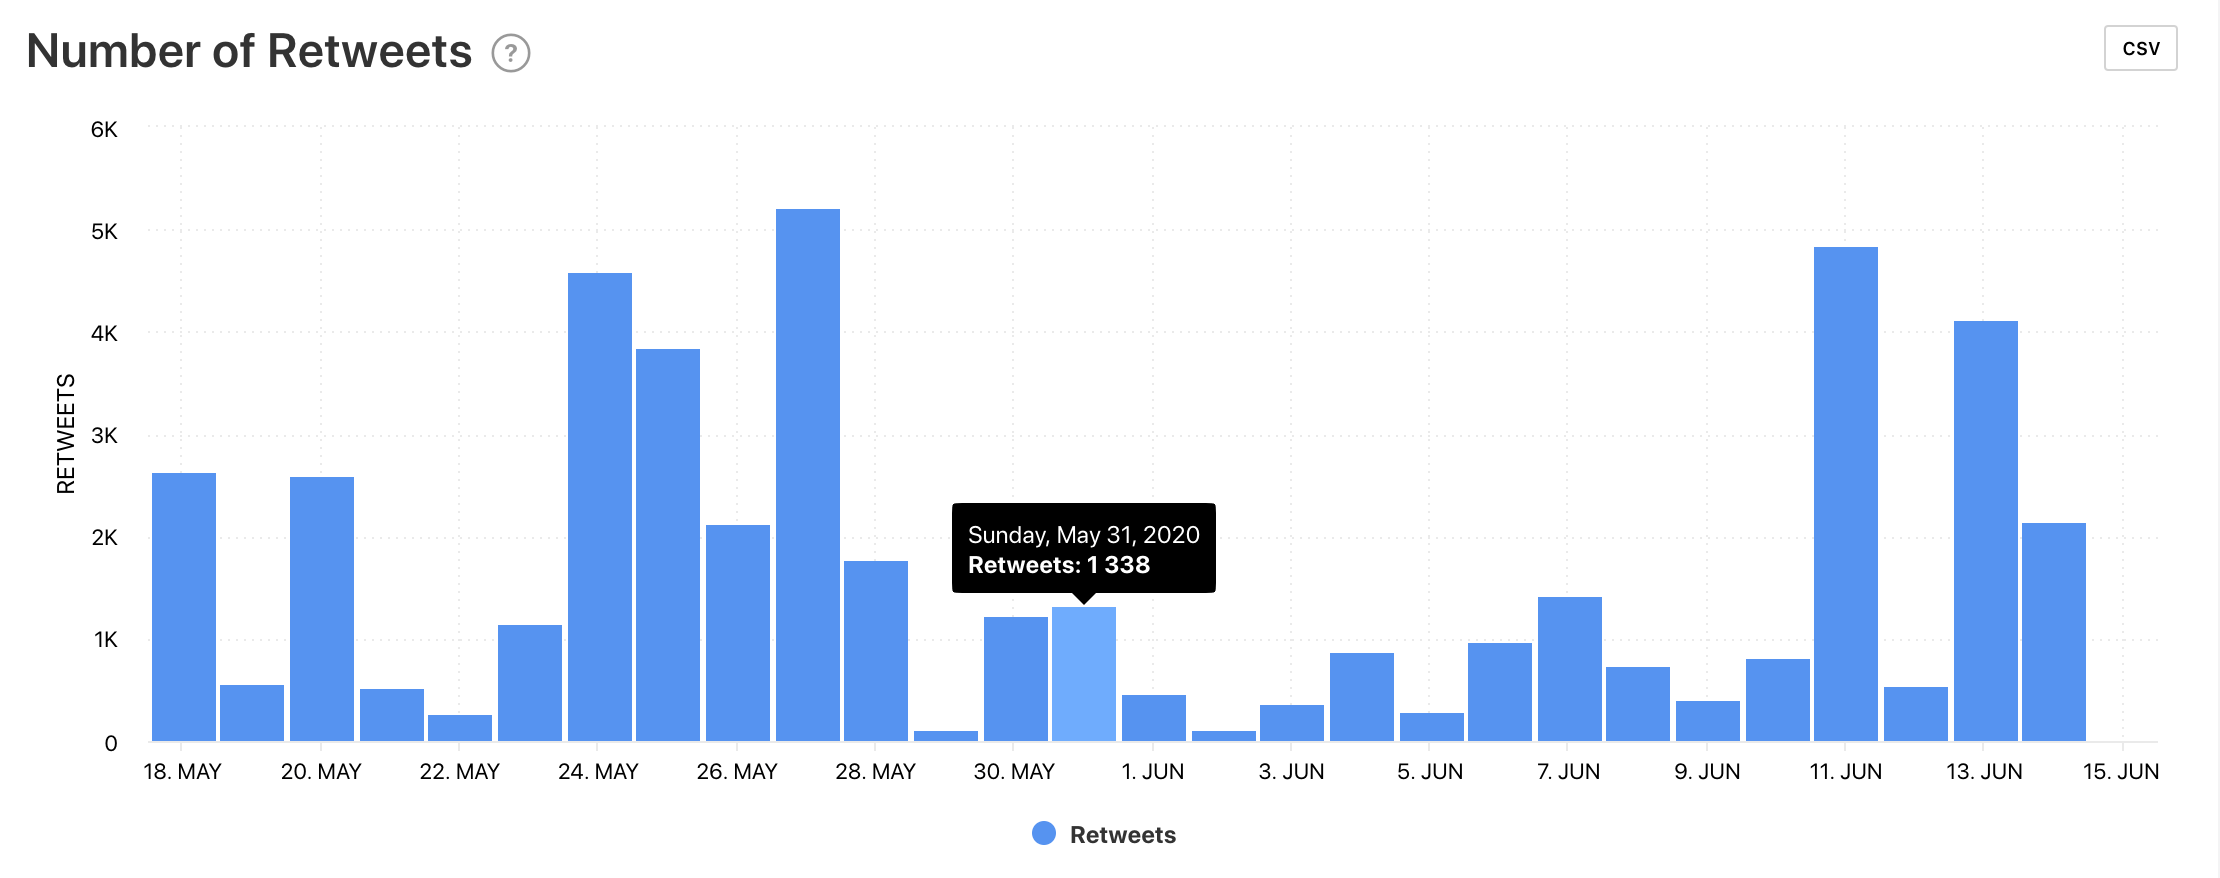
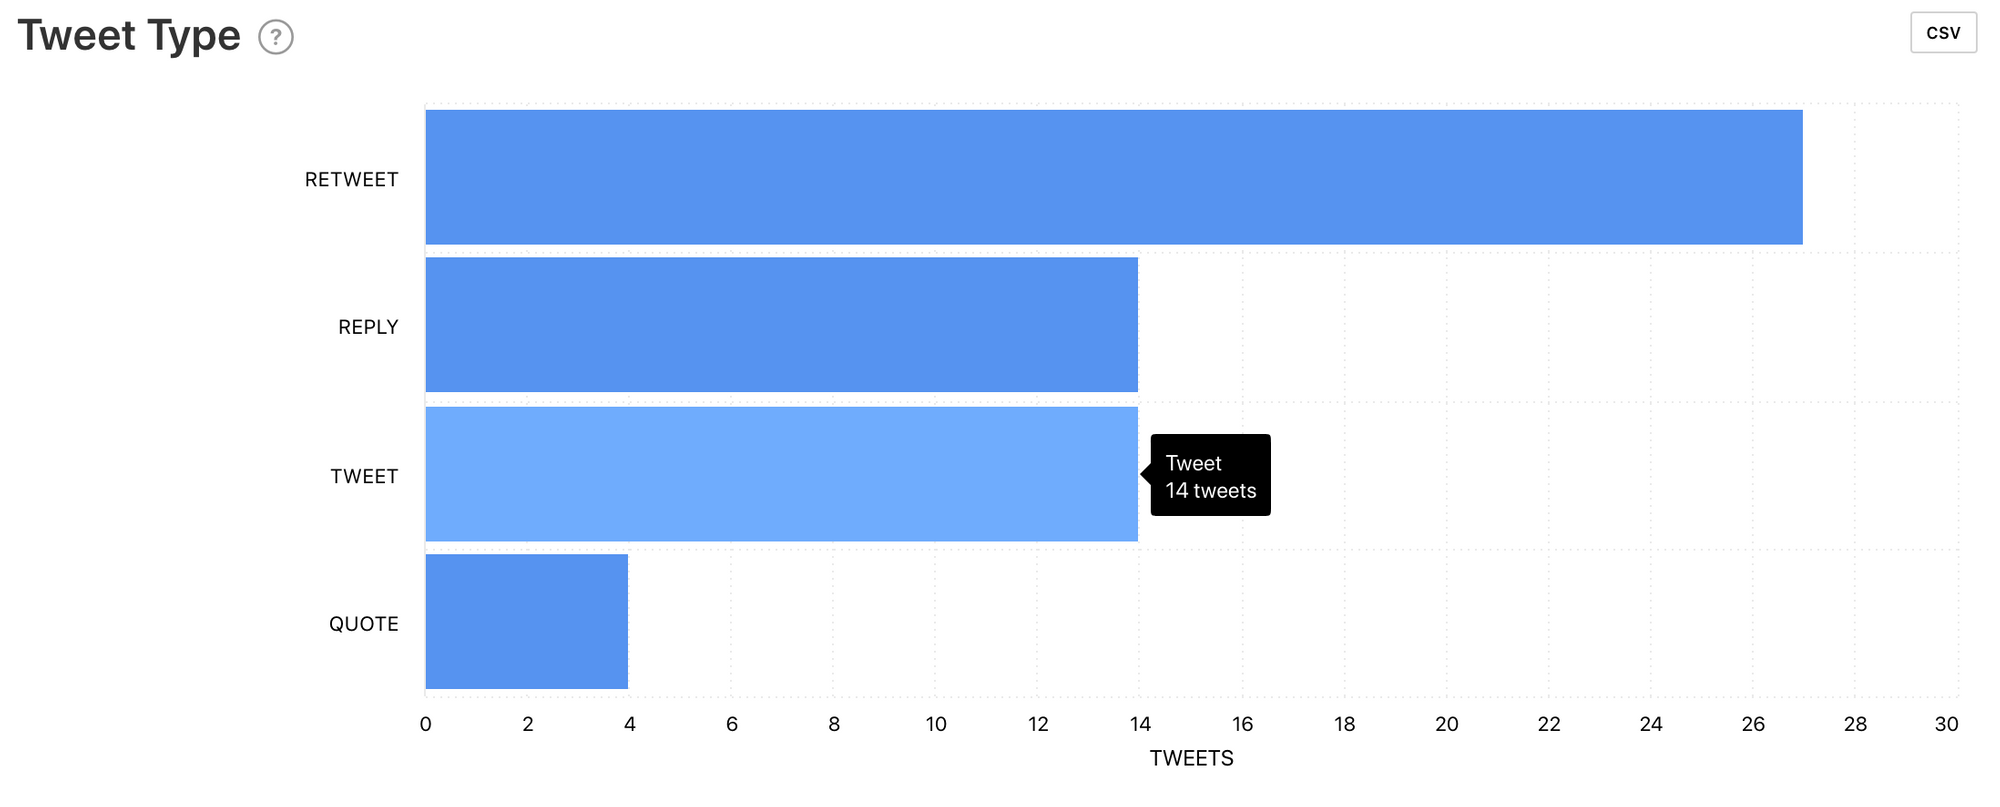
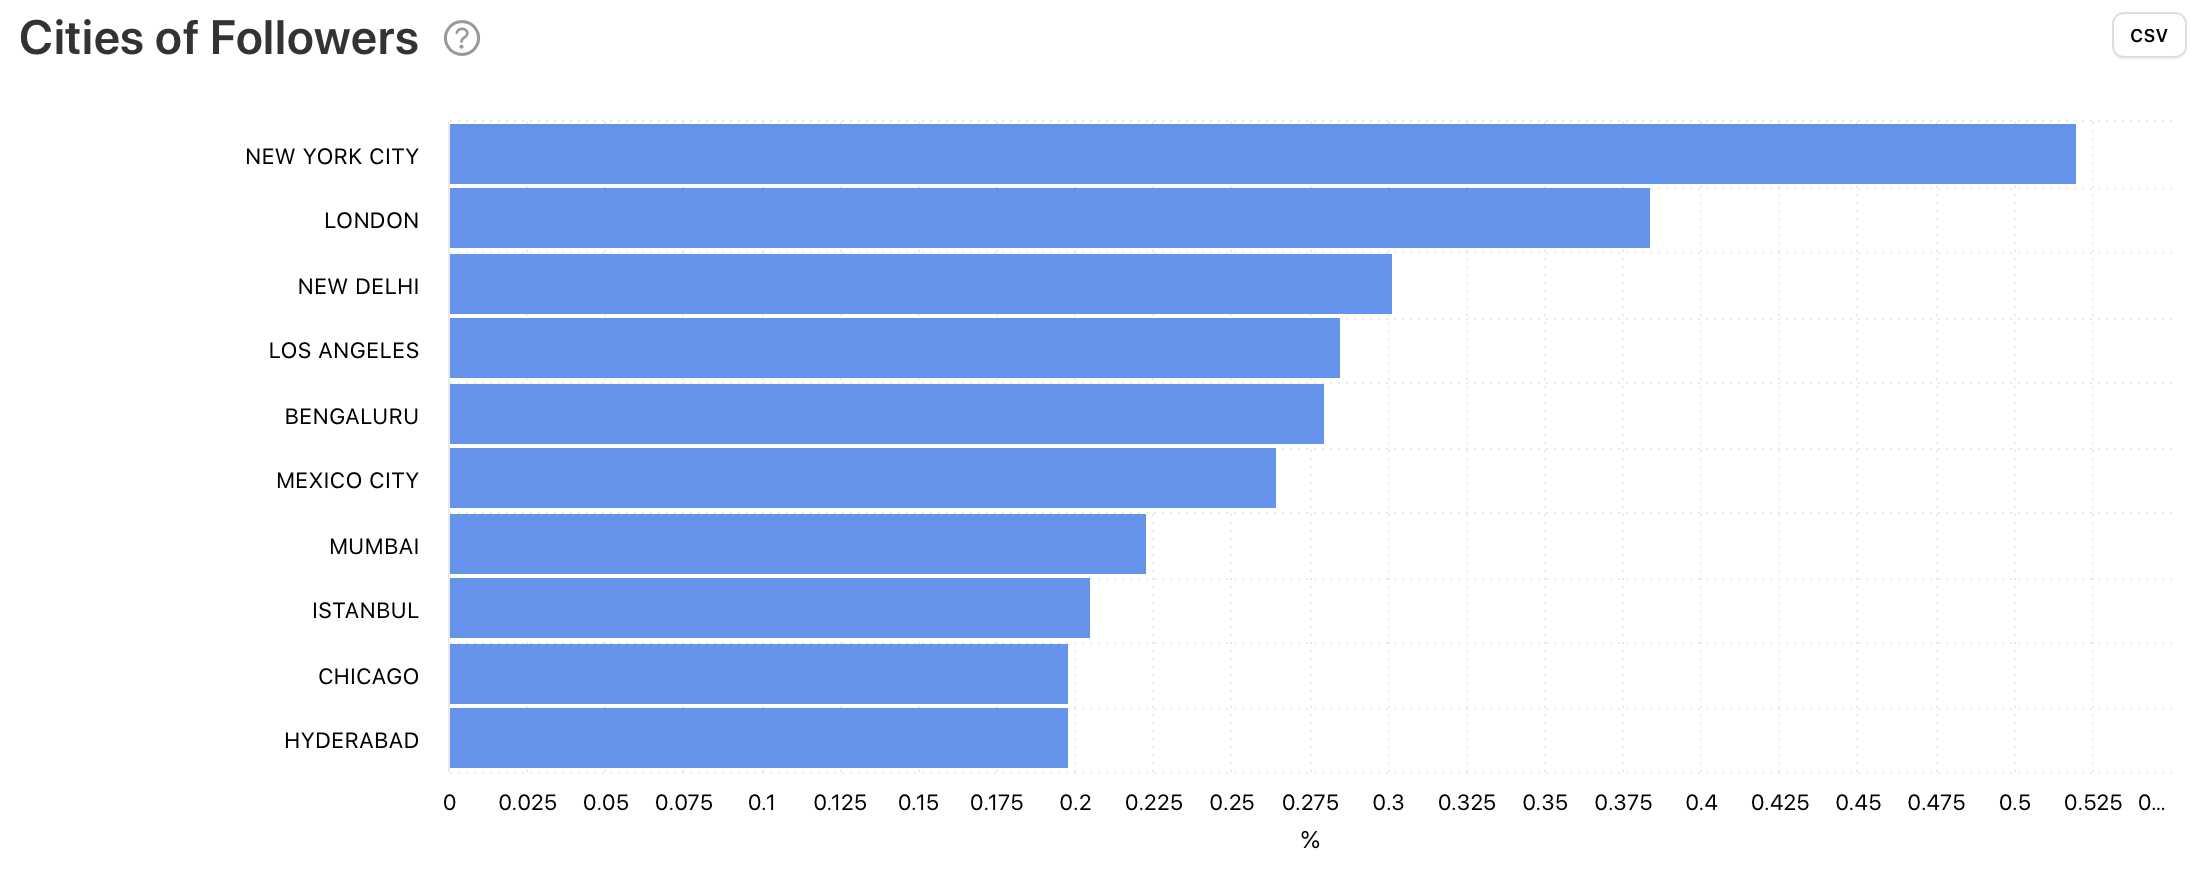
A milestone for our analytics tool this year was branching into additional social media platforms, providing even more analytical data for your businesses. The first of these additions was the inclusion of Twitter analytics, bringing you audience demographics, content performance, mentions and full competitor reports, alongside the many features you were already familiar with through our Instagram analytics.
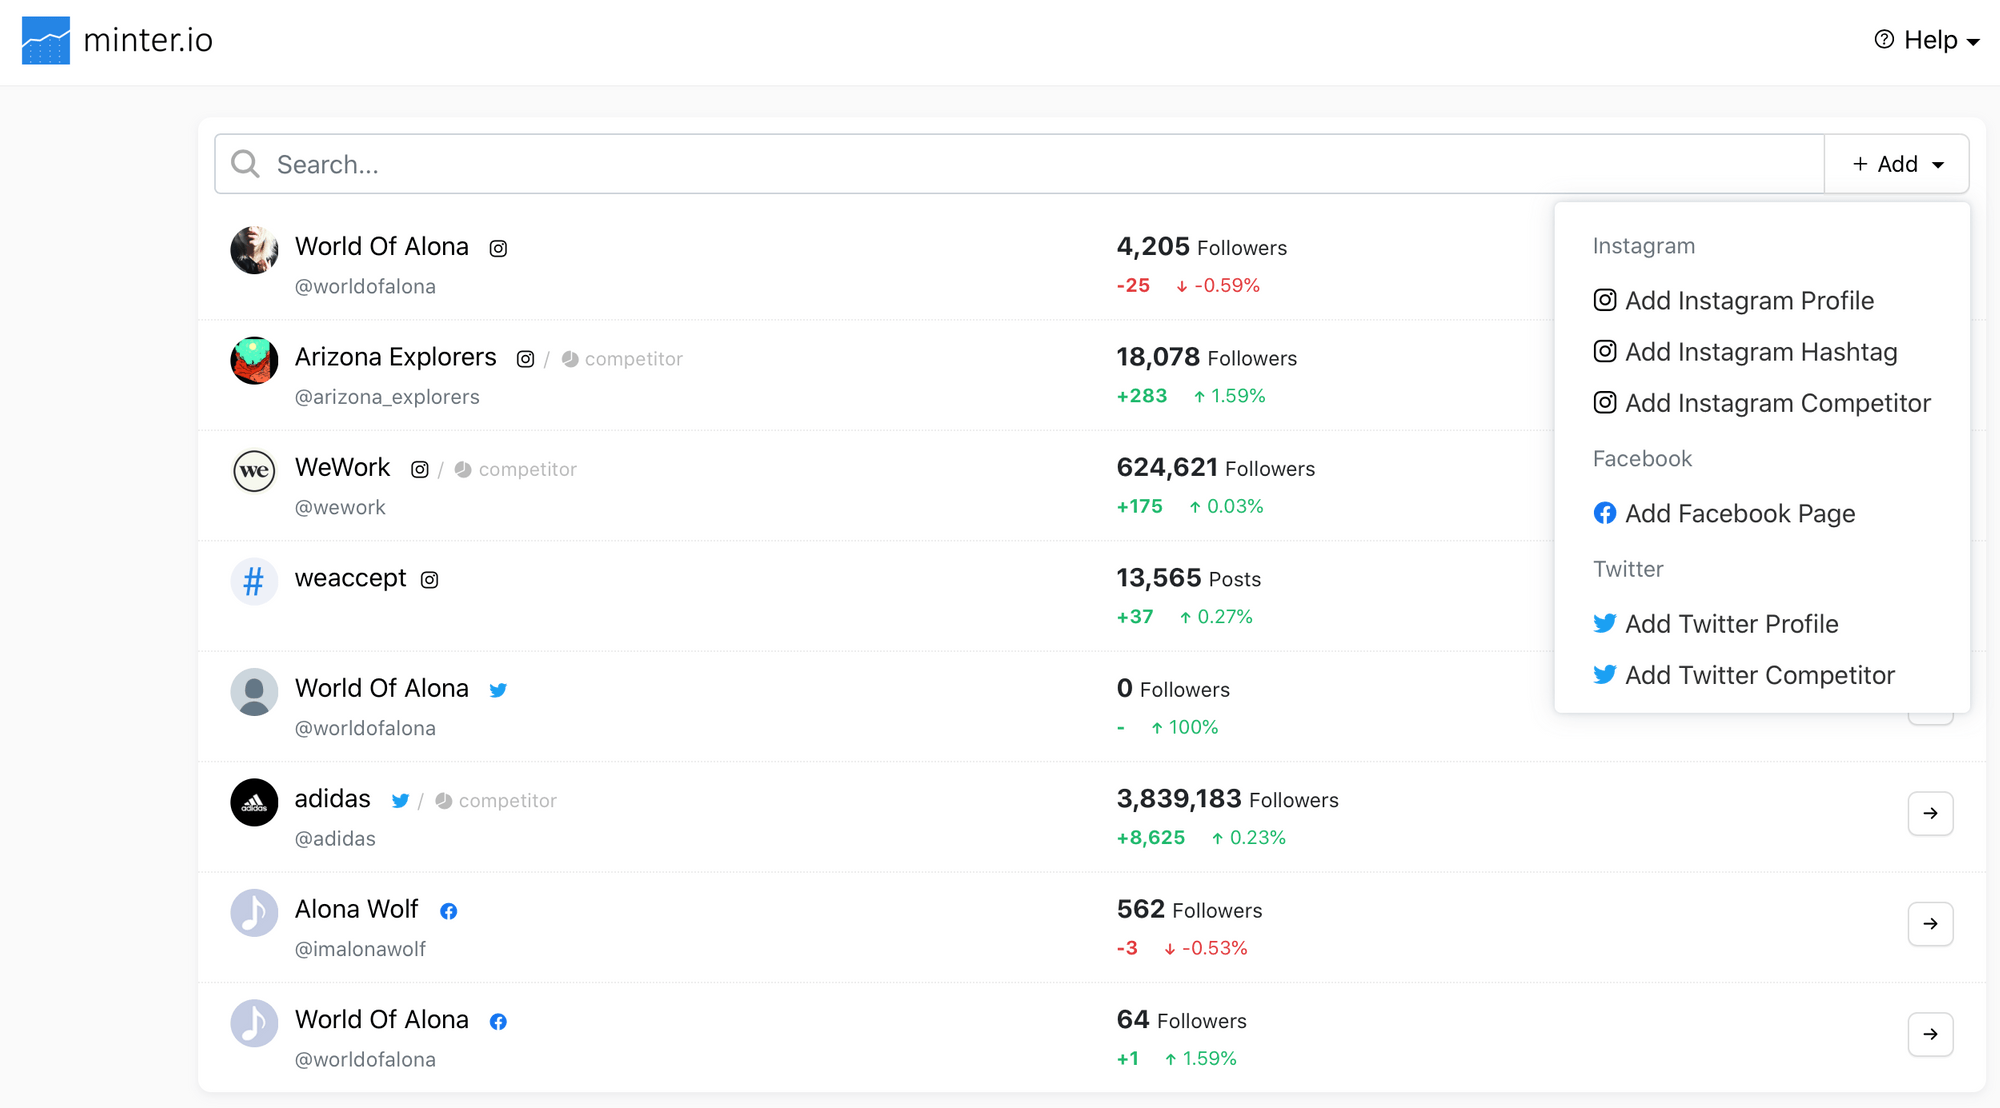
Dashboard With All Your Reports
The dashboard was a nifty addition to the website, so that you can see all your reports in one window. This makes navigation through your social media analytics profiles that little bit easier.
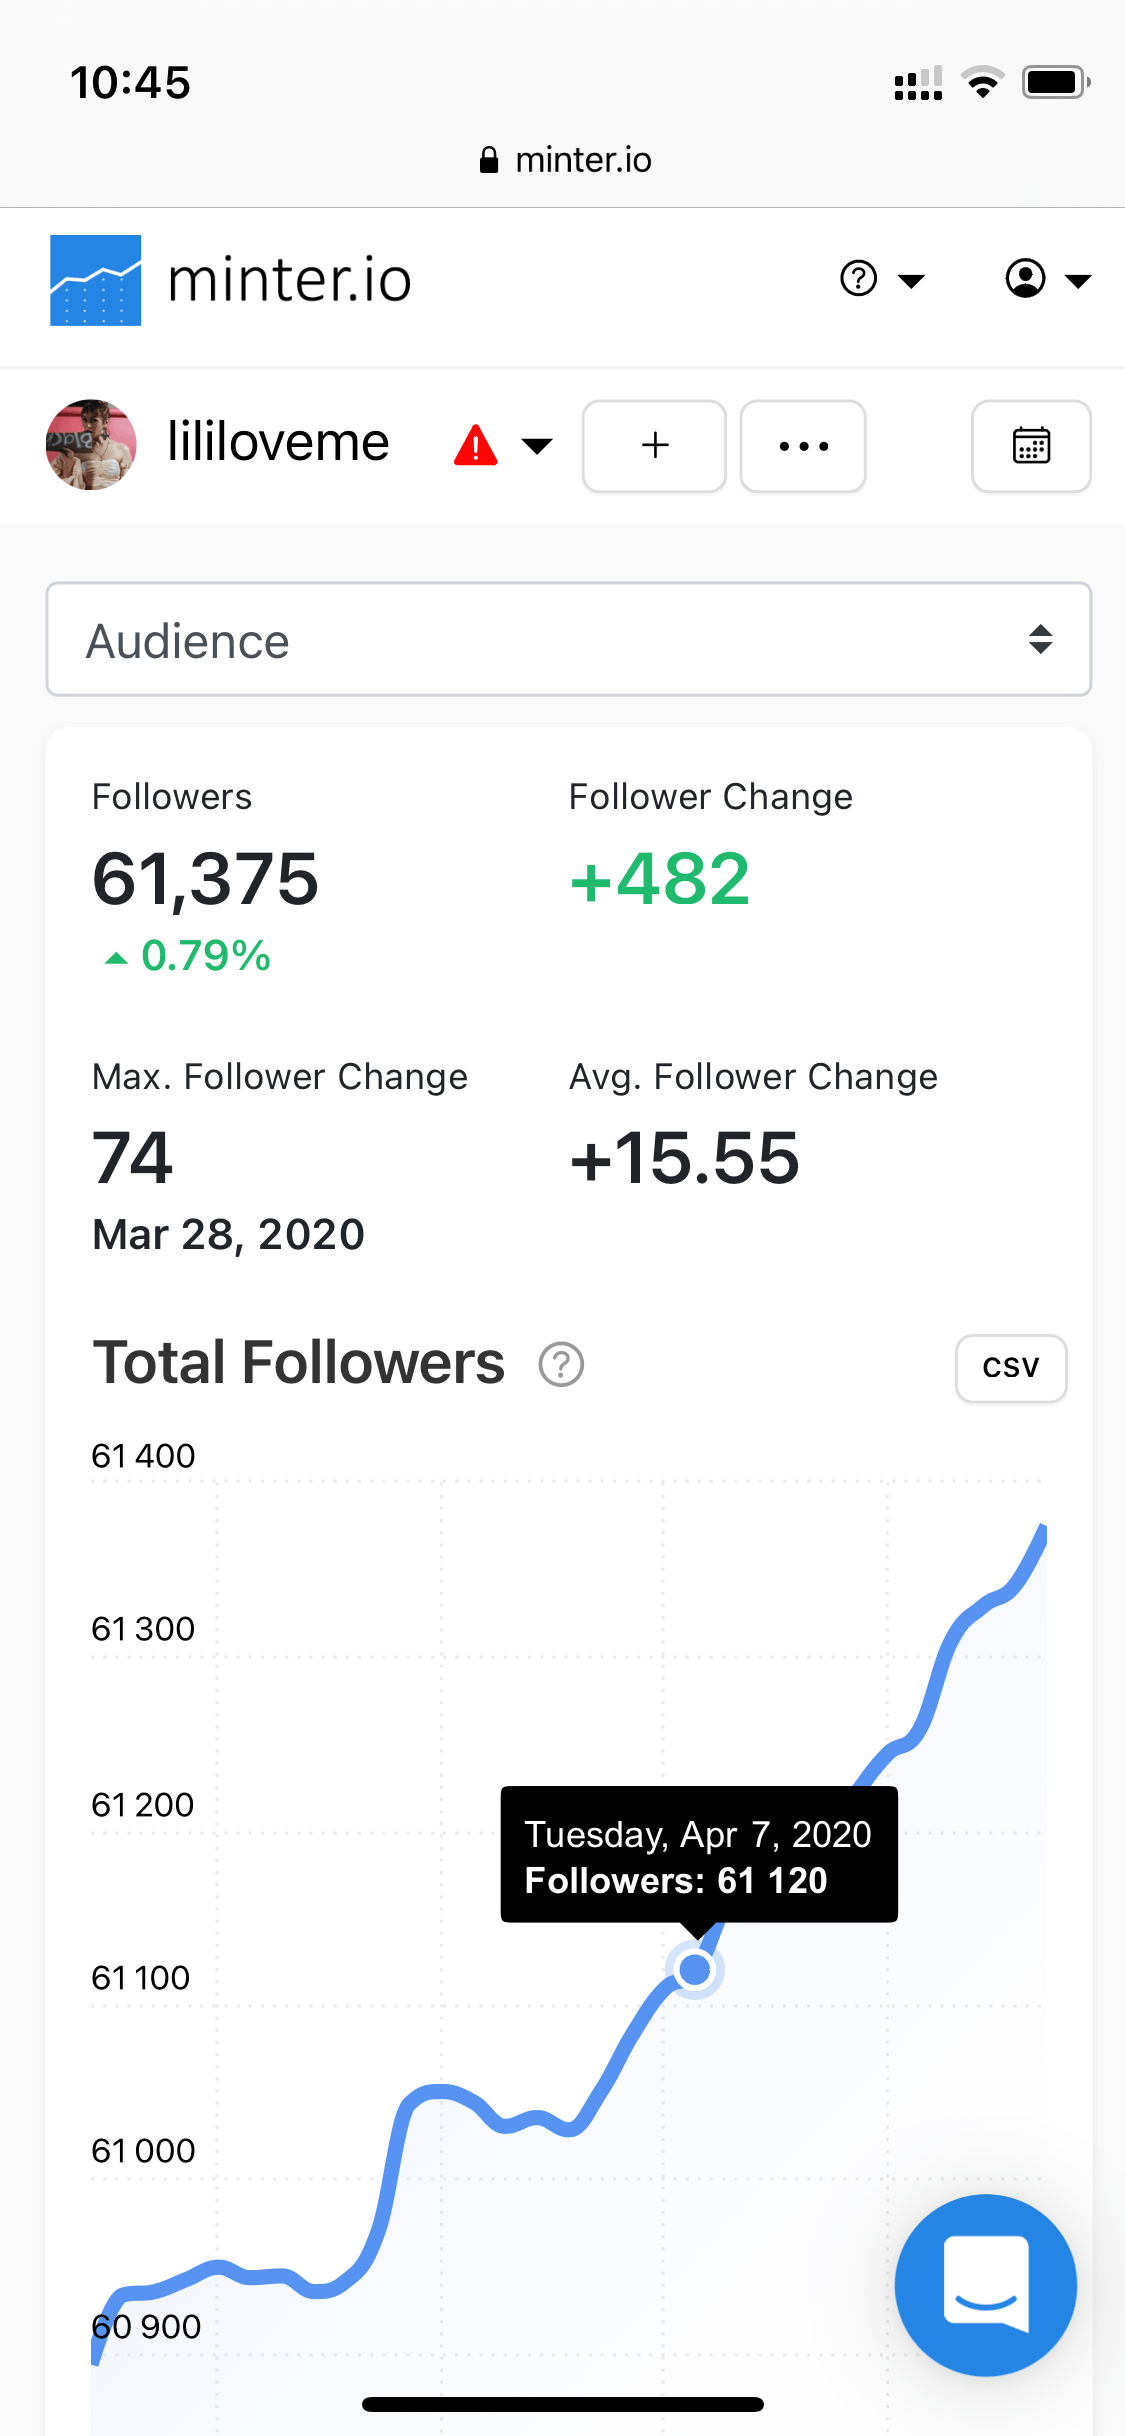
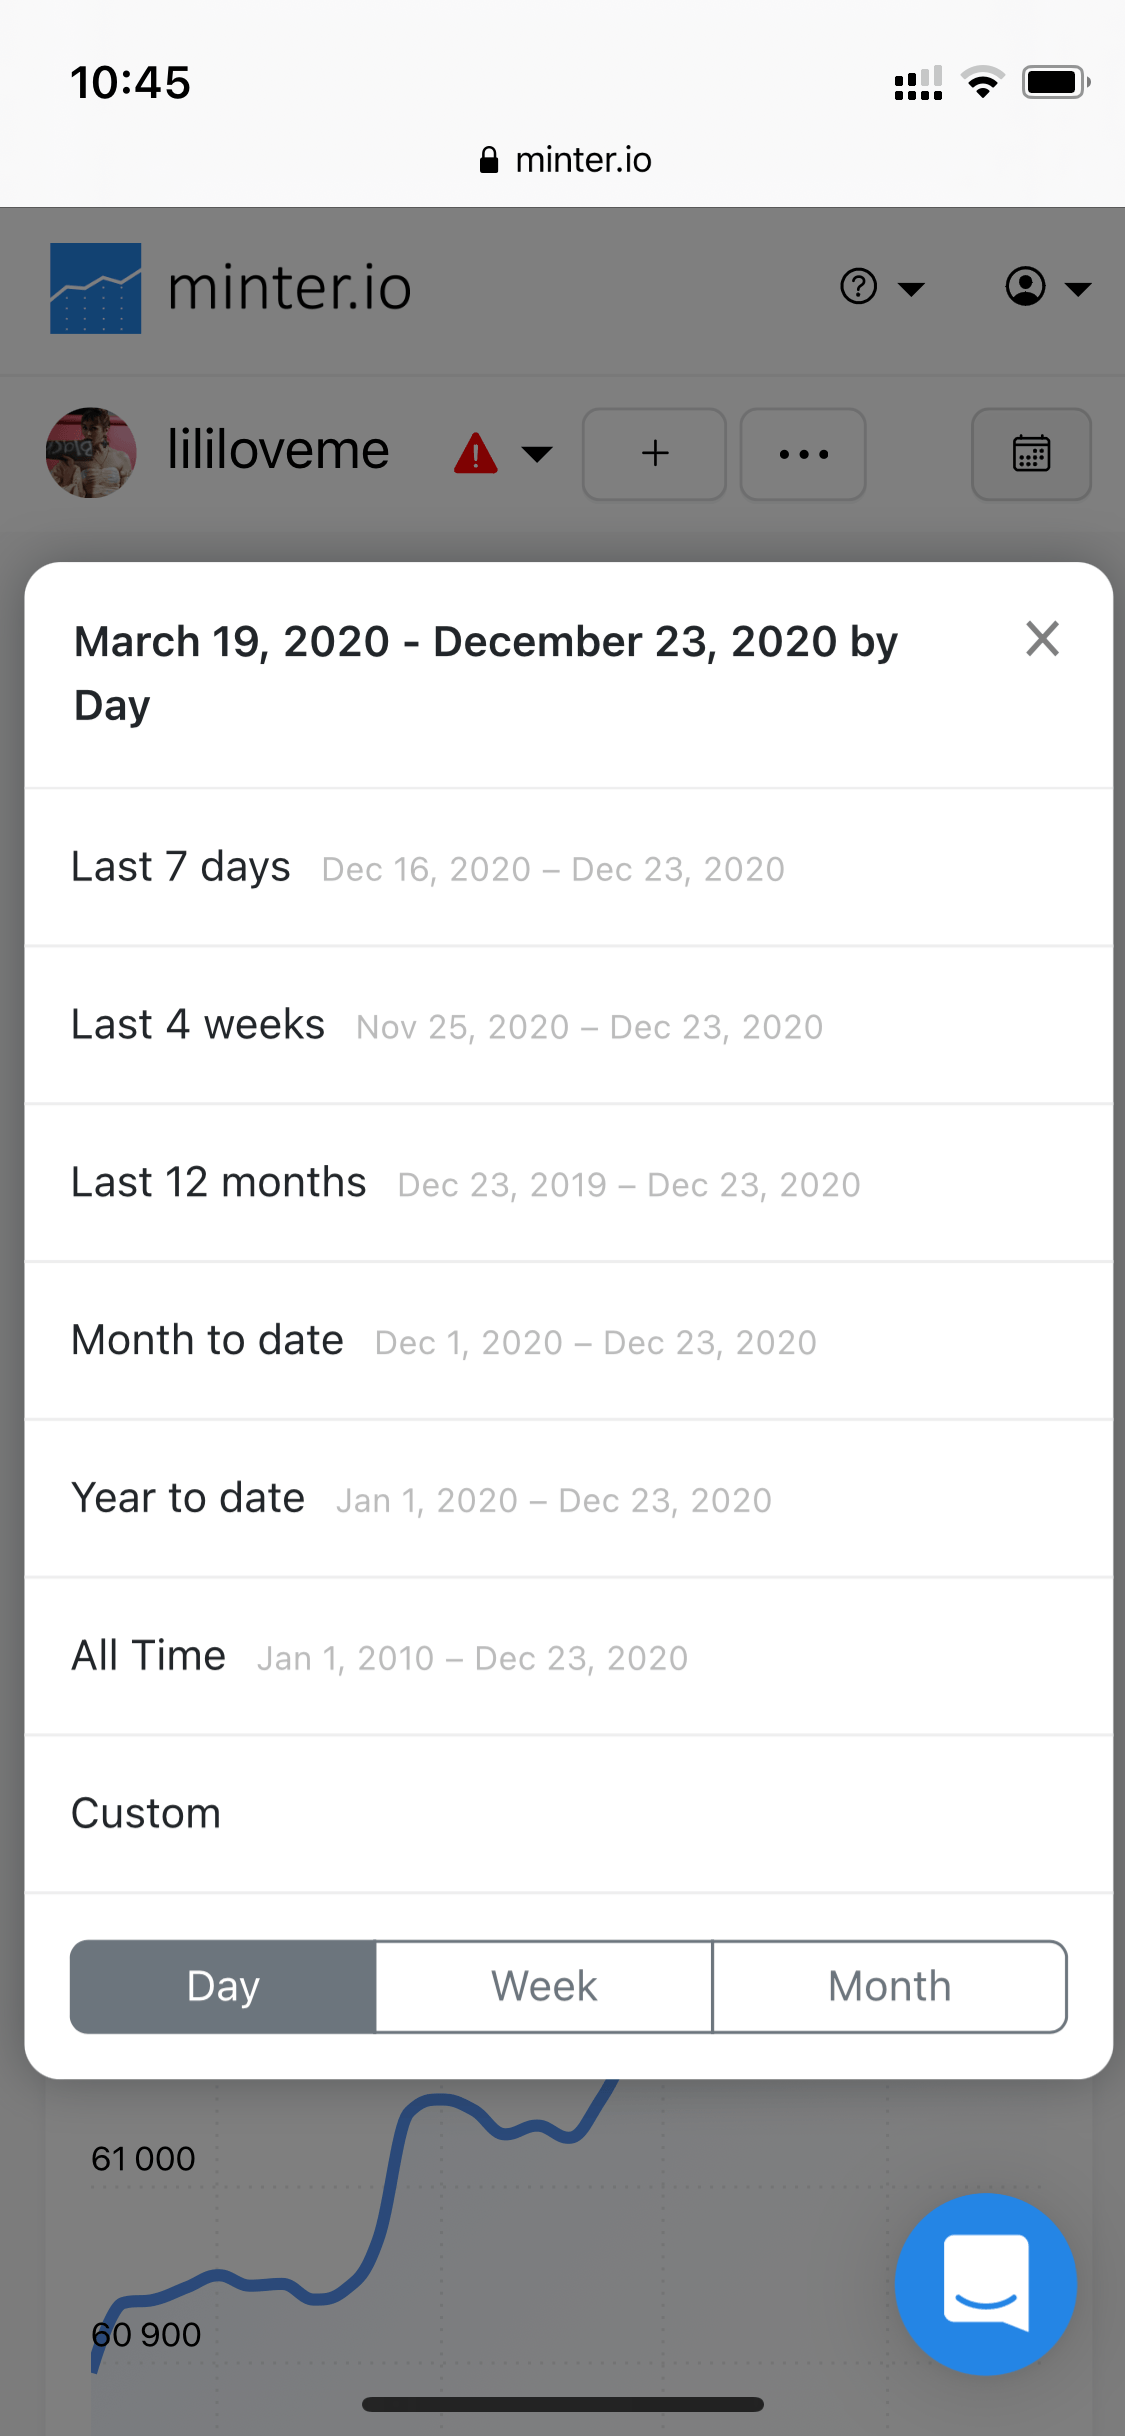
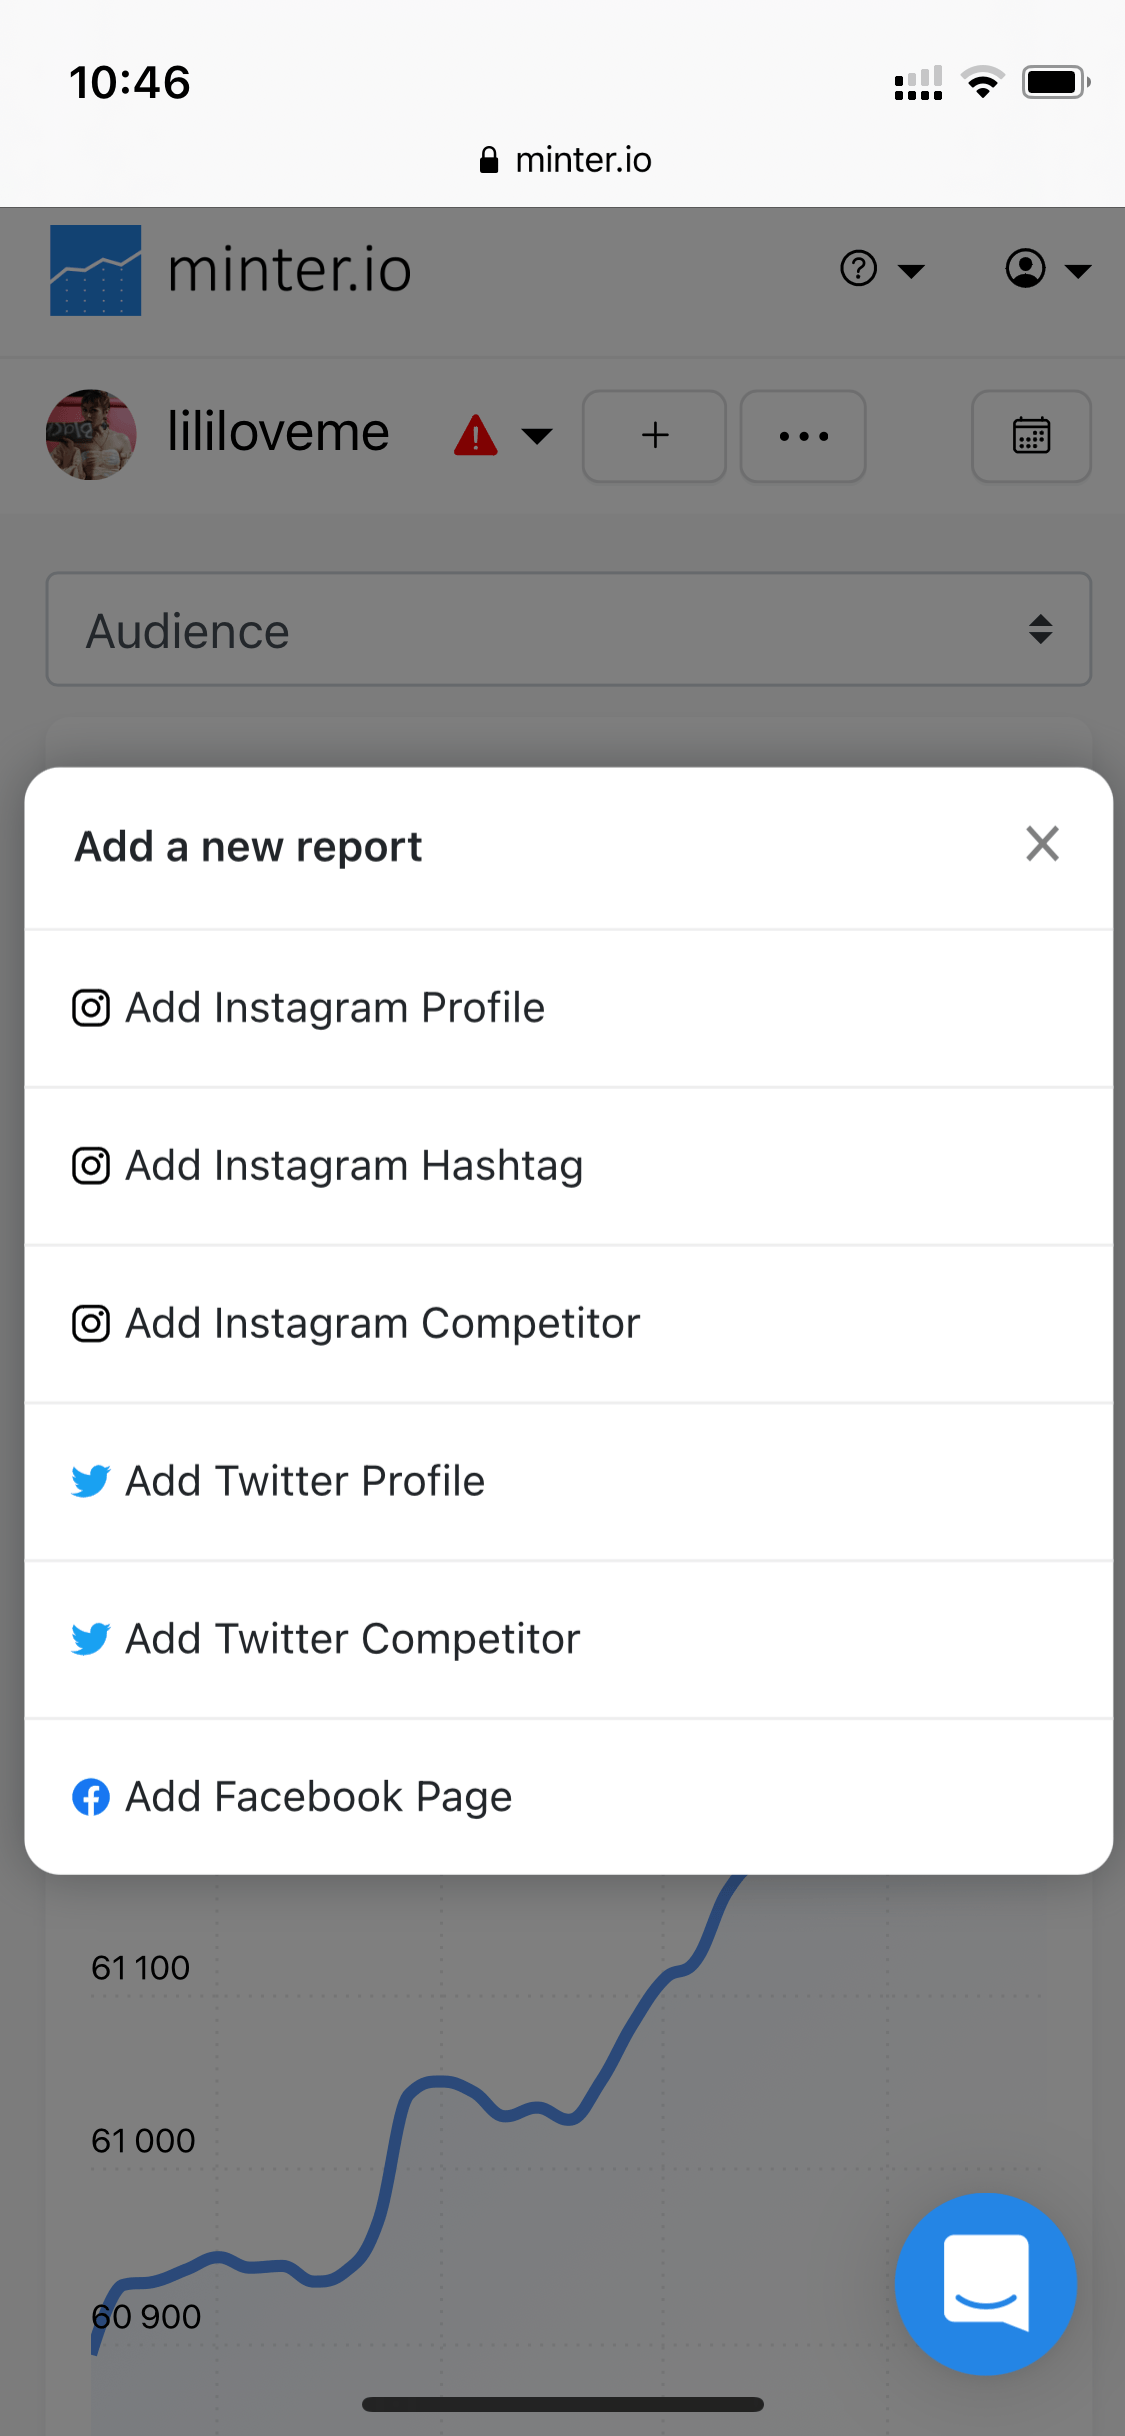
Mobile-friendly Version
We want our analytics tool to be wherever you need it, and that’s why this year we welcomed a mobile-friendly version of Minter.io to the screens in your pockets. Whether you’re checking updates on the train, out in the rain or on holiday in Spain, we’re right there with an optimised version for your ease of use.
Facebook Analytics
Once we brought you Twitter analytics, another logical step was to branch into Facebook analytics, as so many of you are active on what is still the biggest social media platform. We brought you audience demographics, content and page performance, mentions and promoted post analytics, alongside many other features you already associate with our in-depth analytical tool.
We would like to extend a huge thank you to each and every one of you who has welcomed Minter.io into your social media marketing strategy. With even more developments to come in the future, we hope to continue to grow while bringing you the value your business needs to thrive in the online environment.