How To View And Export Historical Instagram Stories Insights
When the success of your business is tied in with your social media performance, having as much relevant analytical information to hand is extremely valuable. One piece of information that just isn’t available currently through Instagram’s in-built insights is the ability to view and compare insights over significant periods of time. We’ve put this article together to shine some light on why having historical data to hand is so important and how you can access your own historical stories Instagram data.
Why Historical Instagram Data Is Useful
When building a successful campaign, it’s imperative to know what works for your brand and your target audience. By looking at a lot of data, over a significant period of time, you can compare lots of posts to find which types of content sparks the response you want from the viewer. You might want to encourage a specific type of engagement such as a reply to a story, or you could want to create a string of stories posts that are likely to hold a viewer’s attention.
With historical data you can:
- Compare lots of posts
- See how your posts are performing over time
- Note trends in your audience and engagement
- Find posts that encourage a specific response
- See the types of posts that work for your brand (type, image, video, specific filters or effects)
- Note particular posts that hold viewer attention
Data doesn’t lie and the more you have to hand, the more accurately you can create posts that work for your brand. Having historical stories analytical data can help you see what has been working for your brand (and what hasn’t), making it easier to tailor new stories posts for your audience.
Stories Insights on Instagram
You can only see insights for your stories if you have an Instagram business or creative account (not a personal account). Find out how you can change your personal Instagram account to a business account in this article. Changing your account is free of charge and a fairly simple process.
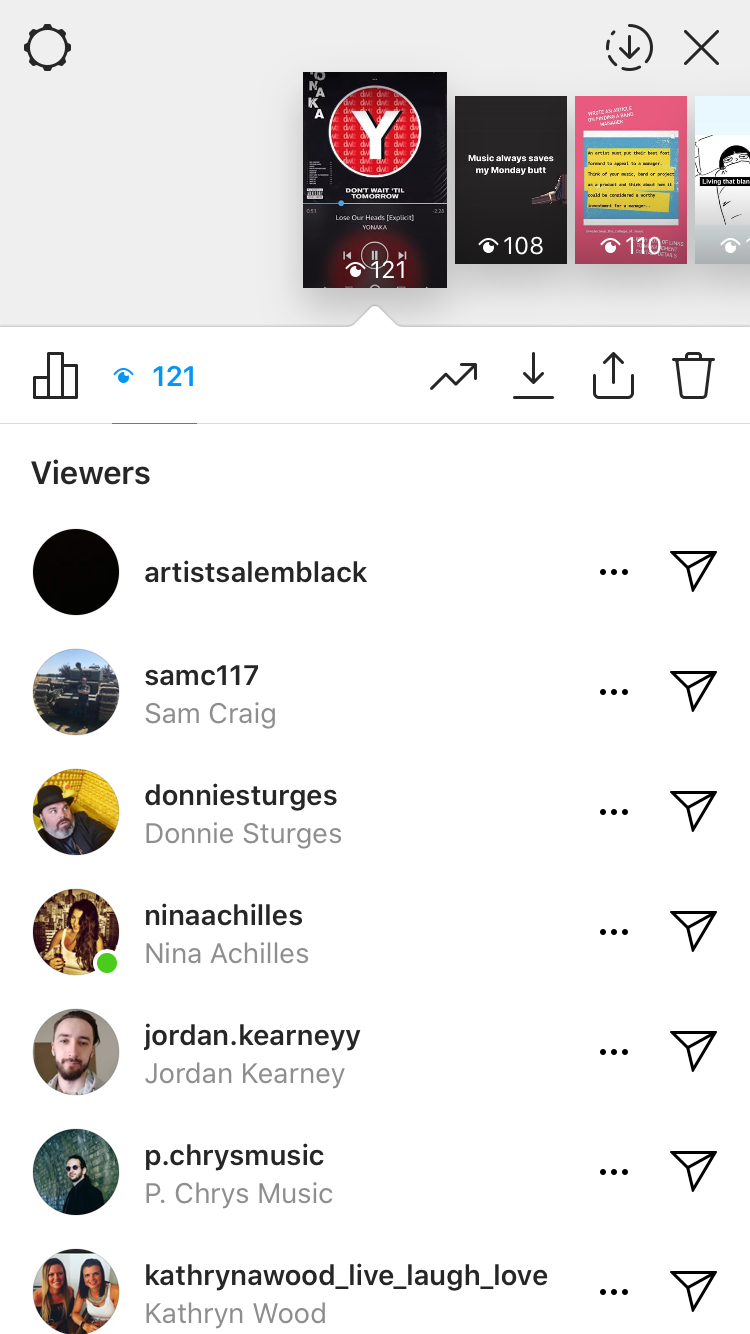
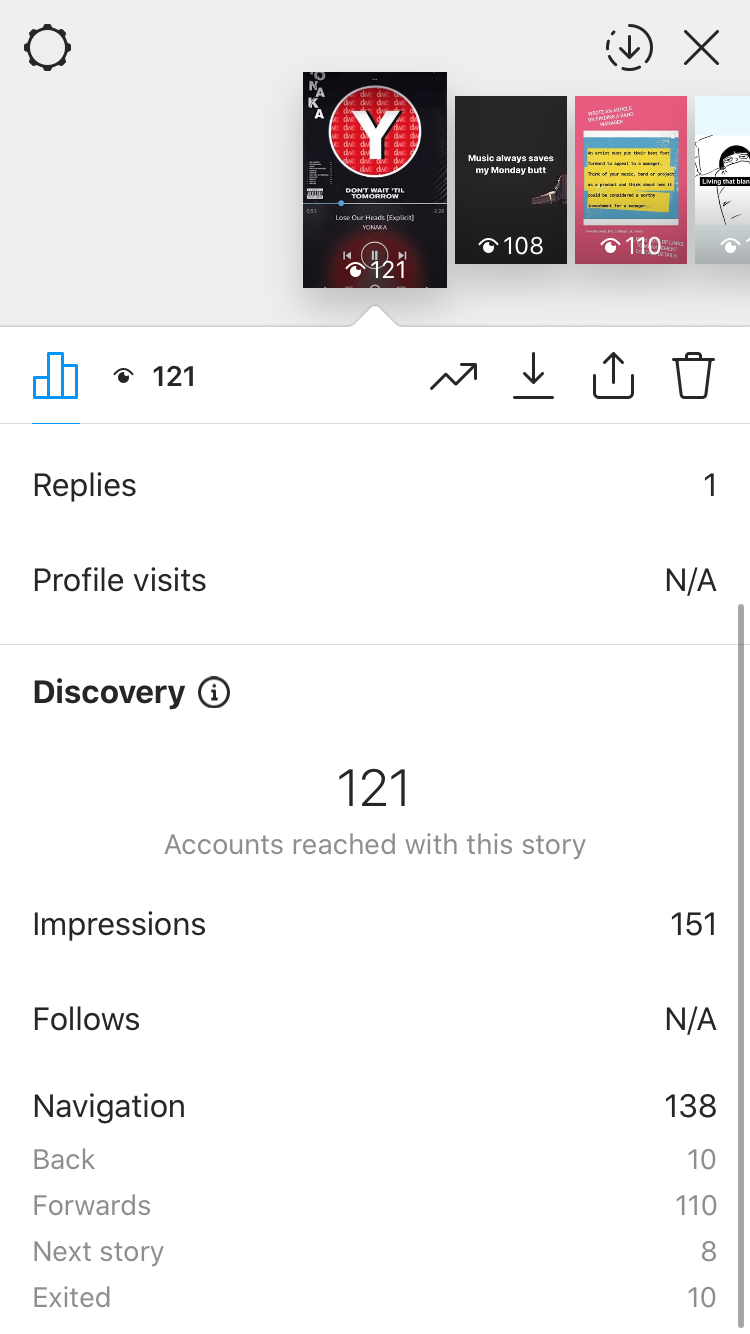
To quickly see a snapshot of information for a particular story that is currently being shared, go to your profile and select your profile picture to view the stories post, select ‘Seen by (number)’ in the bottom left-hand corner and then select the insights icon to the left of the number of viewers. This will give you insights of your current or very recent stories post.

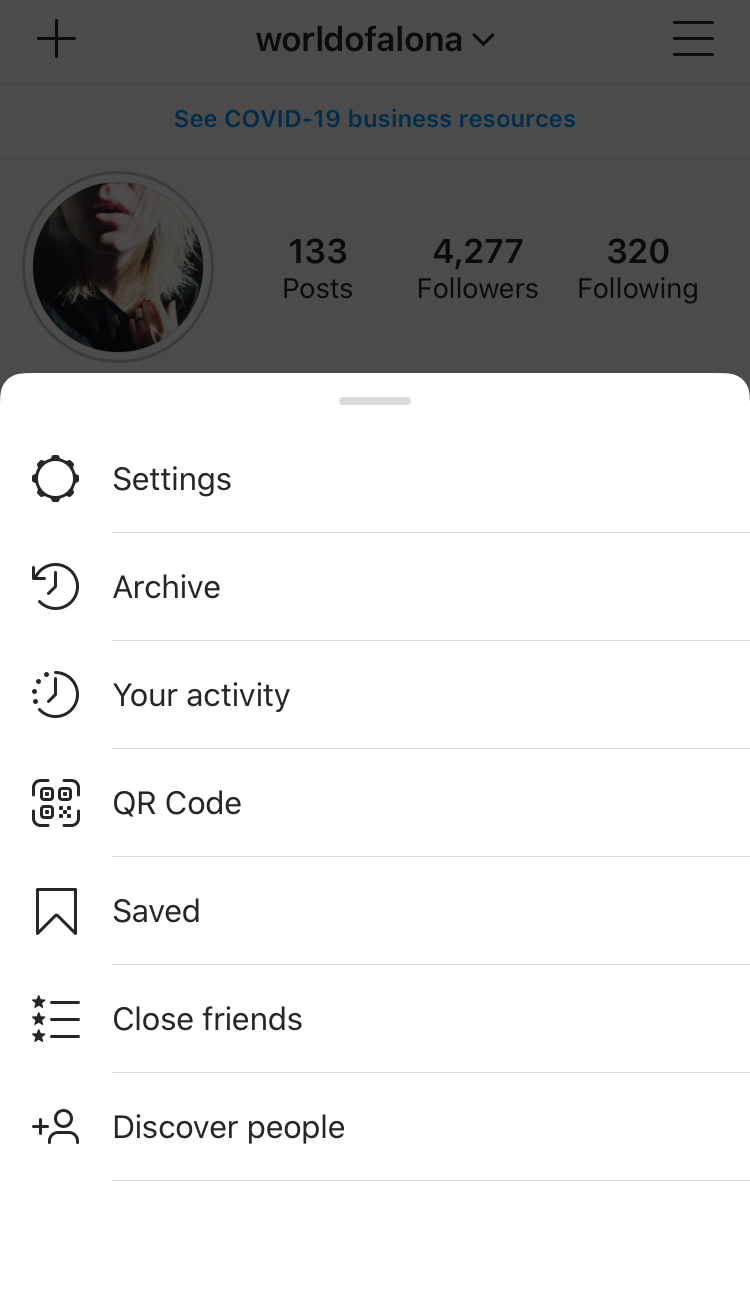
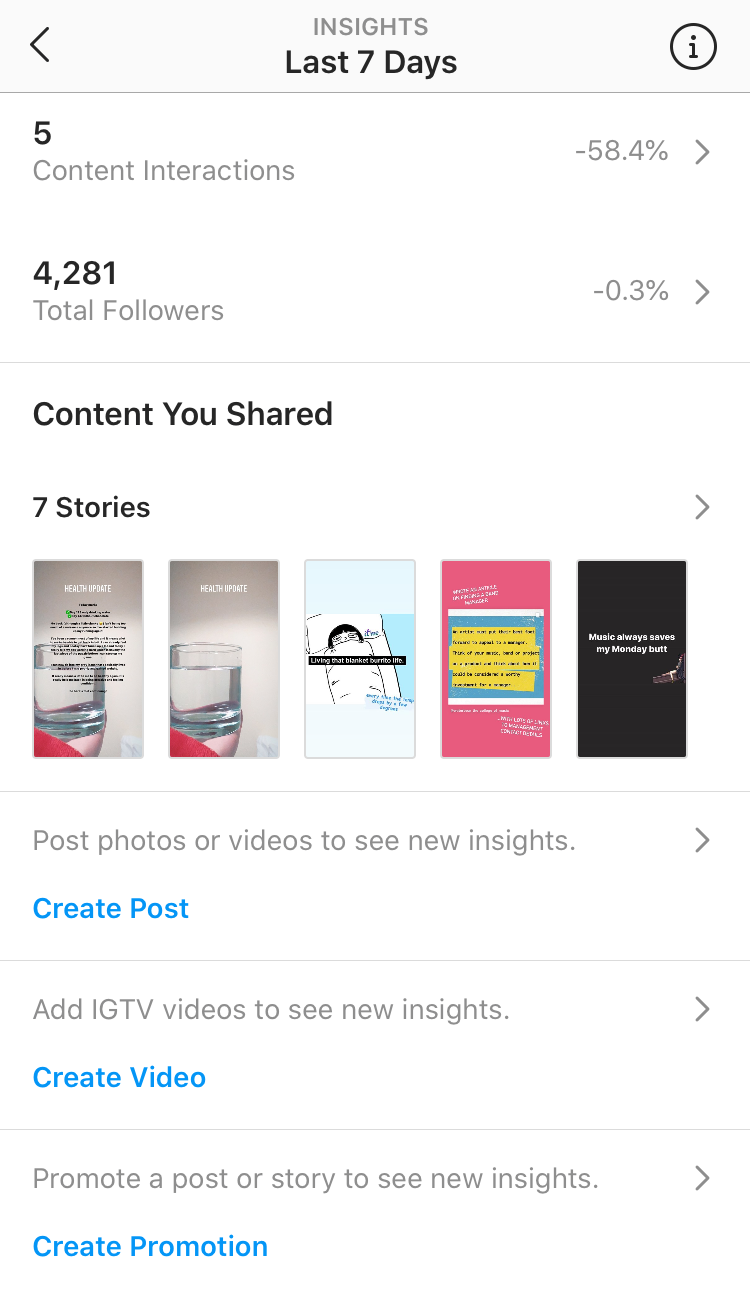
The best way to view Stories Insights from Instagram is to go to the menu from your profile (the three lines in the top right-hand corner) and select ‘Insights’. Then scroll to ‘Content You Shared’ and select the amount of stories.
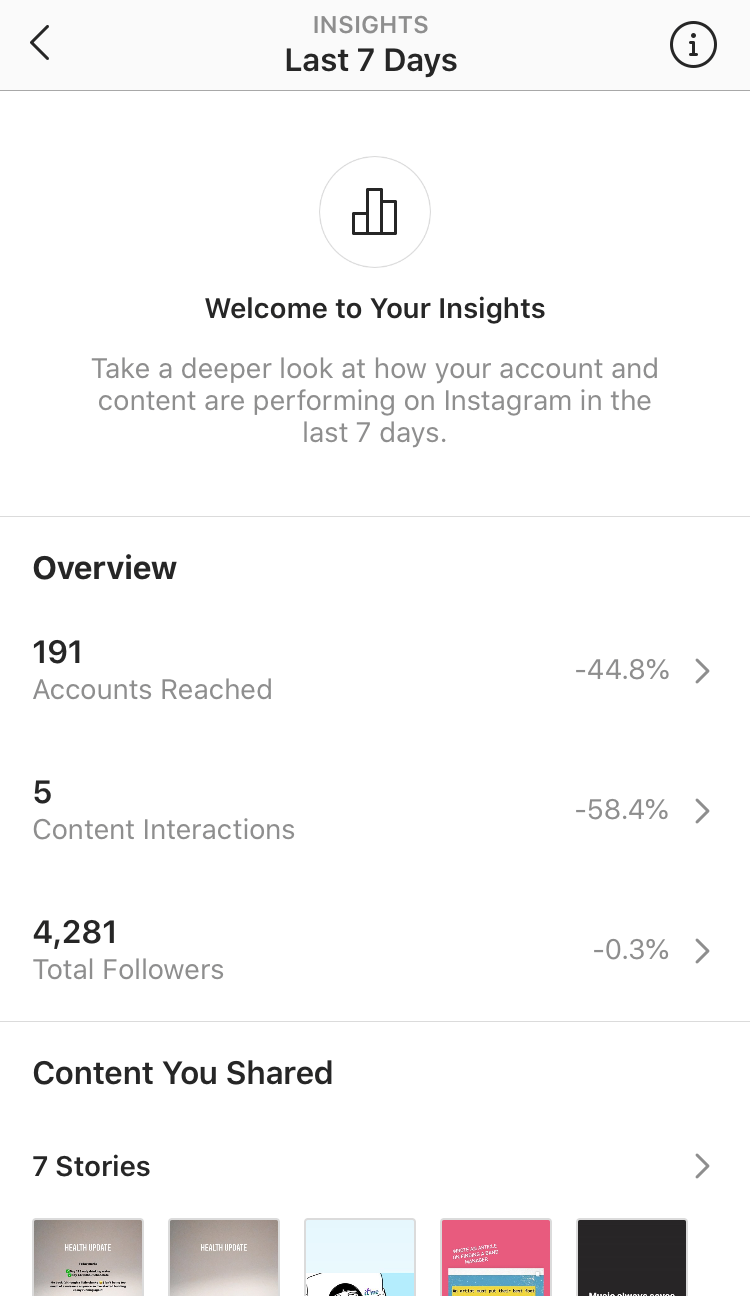
From within the stories content insights you can select the metric you’d like to evaluate and the time period you’d like to look at using the drop-down menus at the top of the screen.
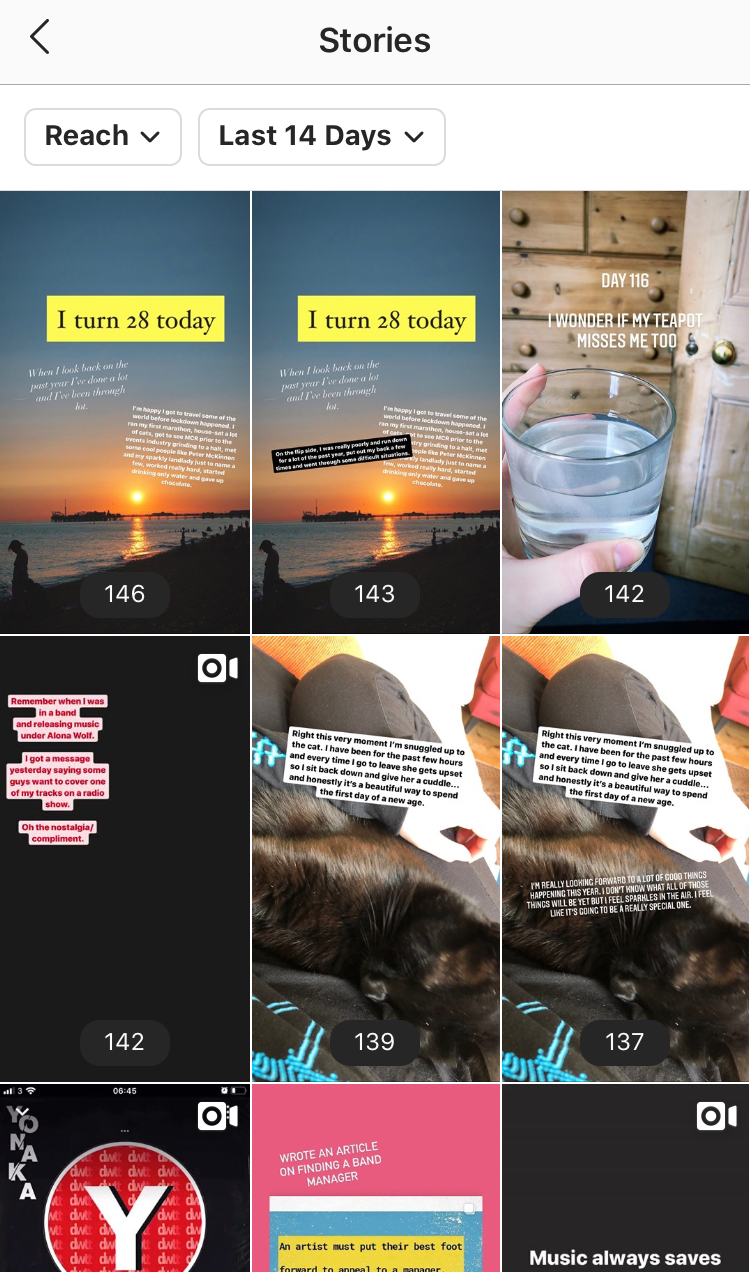
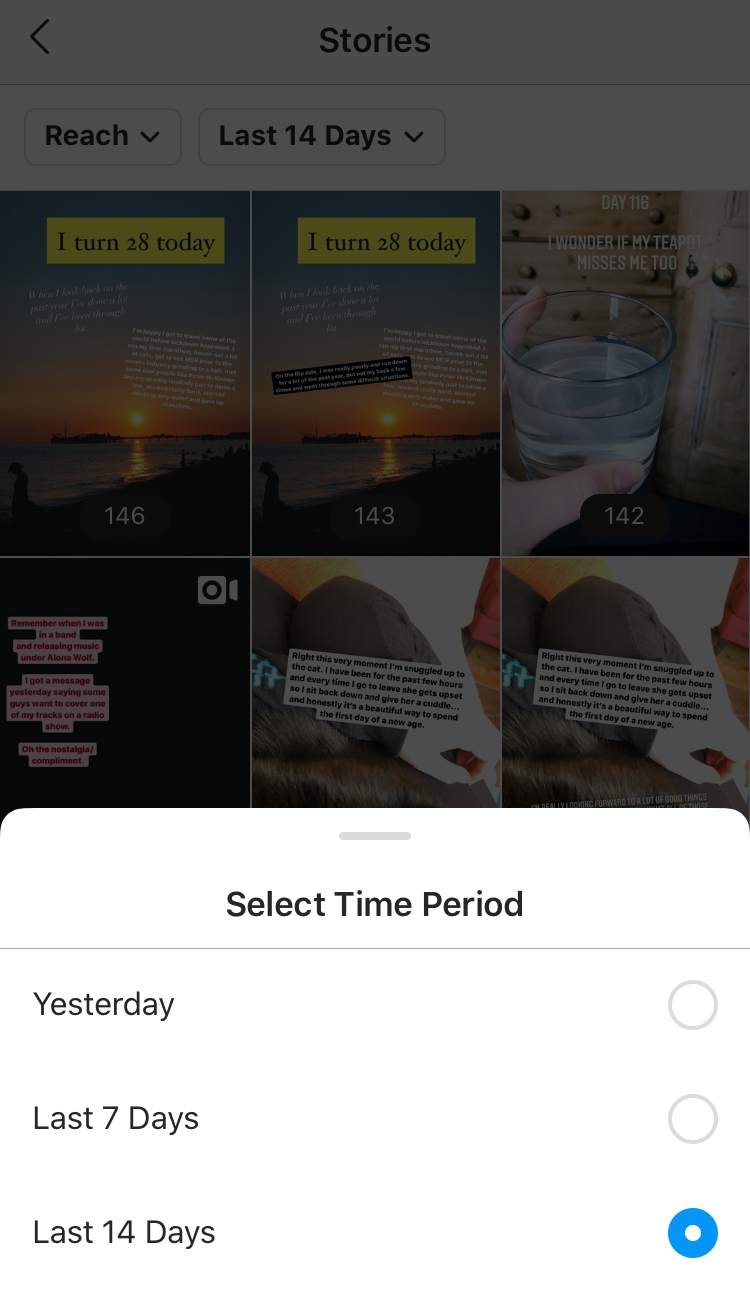
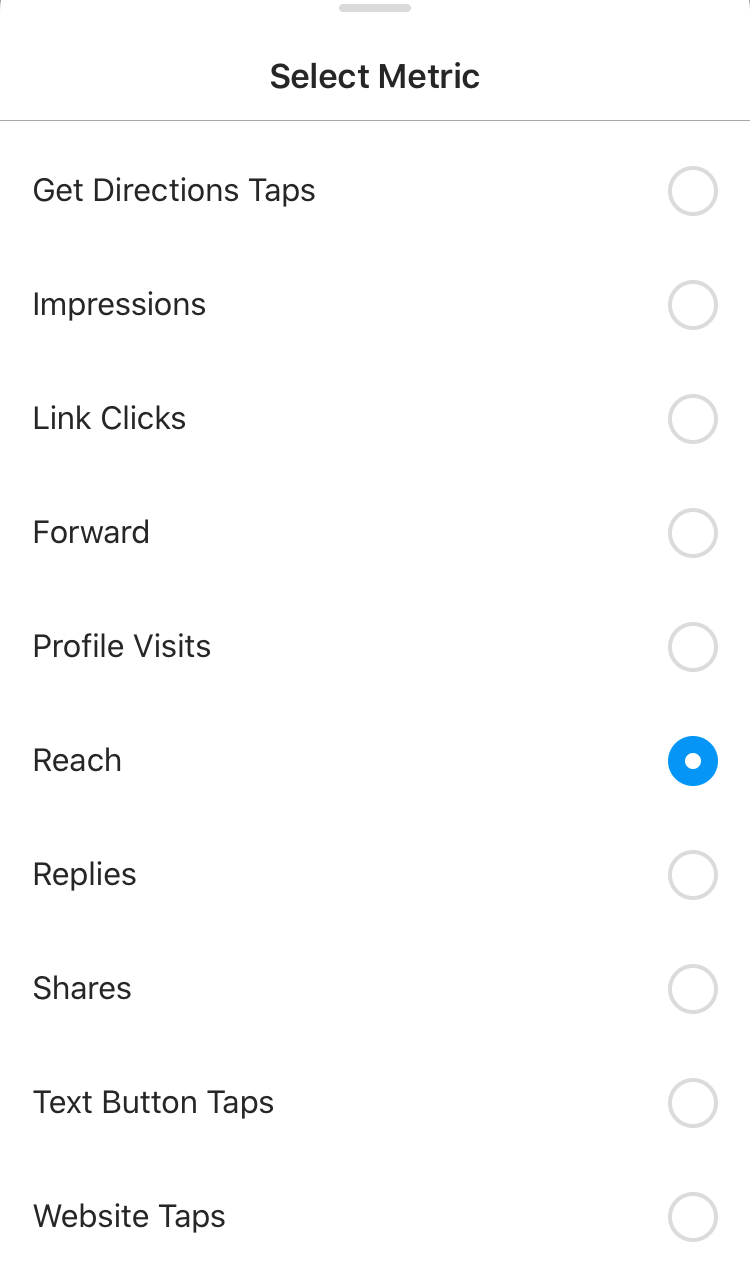
You can choose to view insights from yesterday, the last 7 days or the last 14 days, but any further historical data is discarded after this time period.
That’s where we come in.
Get Your Historical Stories Data With Minter.io
From the moment you connect your Instagram business account to Minter.io, we keep hold of the analytical data for your stories, allowing you to see the performance of your stories posts over long stretches of time, so that you can accurately determine which stories posts are working for your brand.
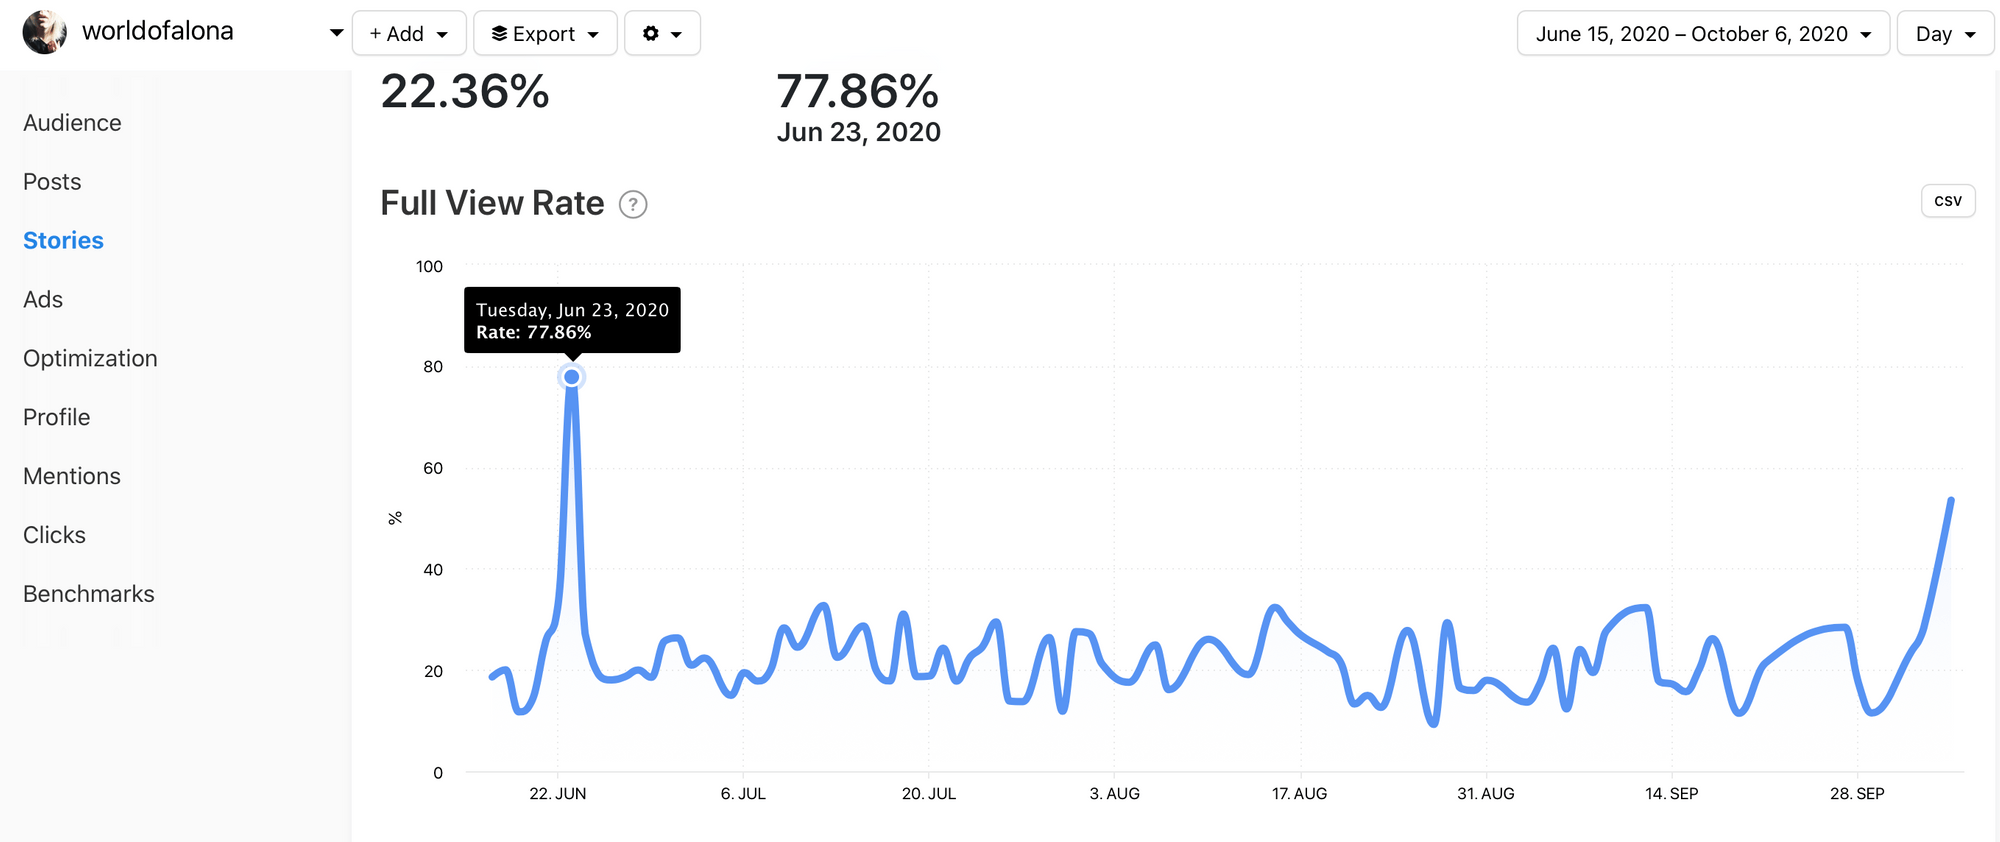
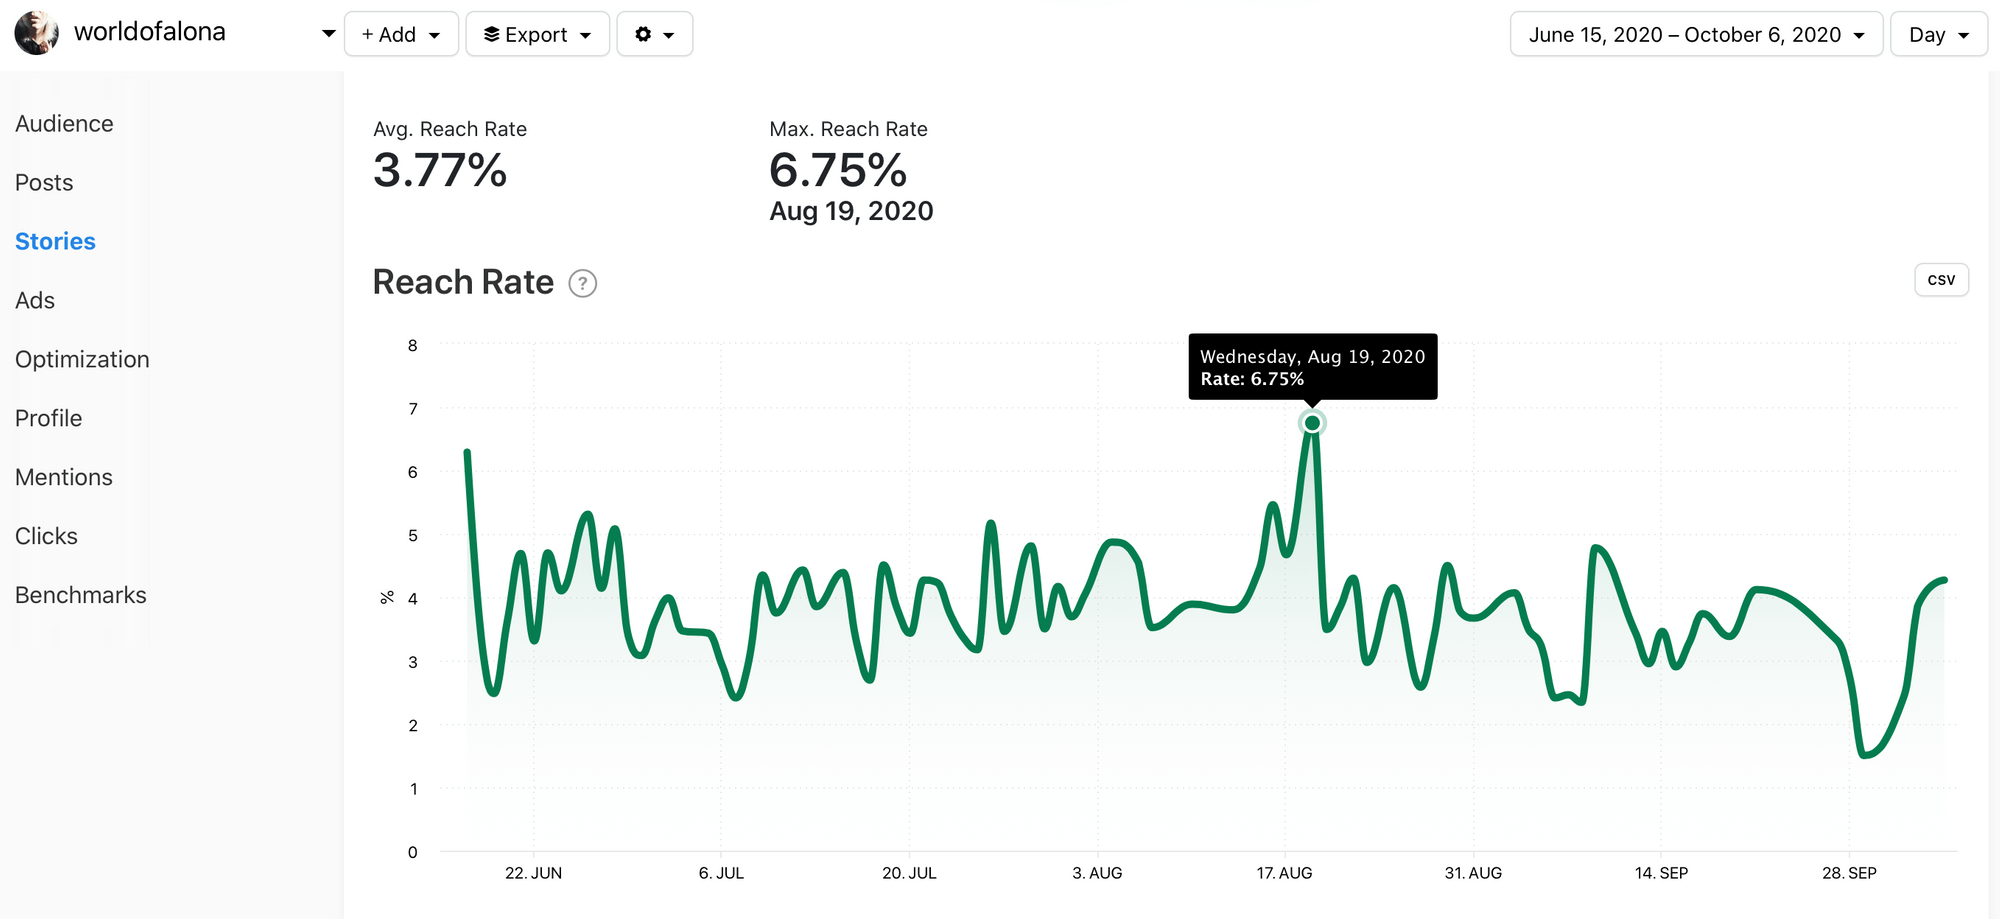
Here are some examples where you can see the general trend over time and some spikes in the full view rate and the reach rate. When you see positive spikes, you can use this data to encourage more positive spikes through repeating similar stories posts or using the same techniques that worked for these dates.
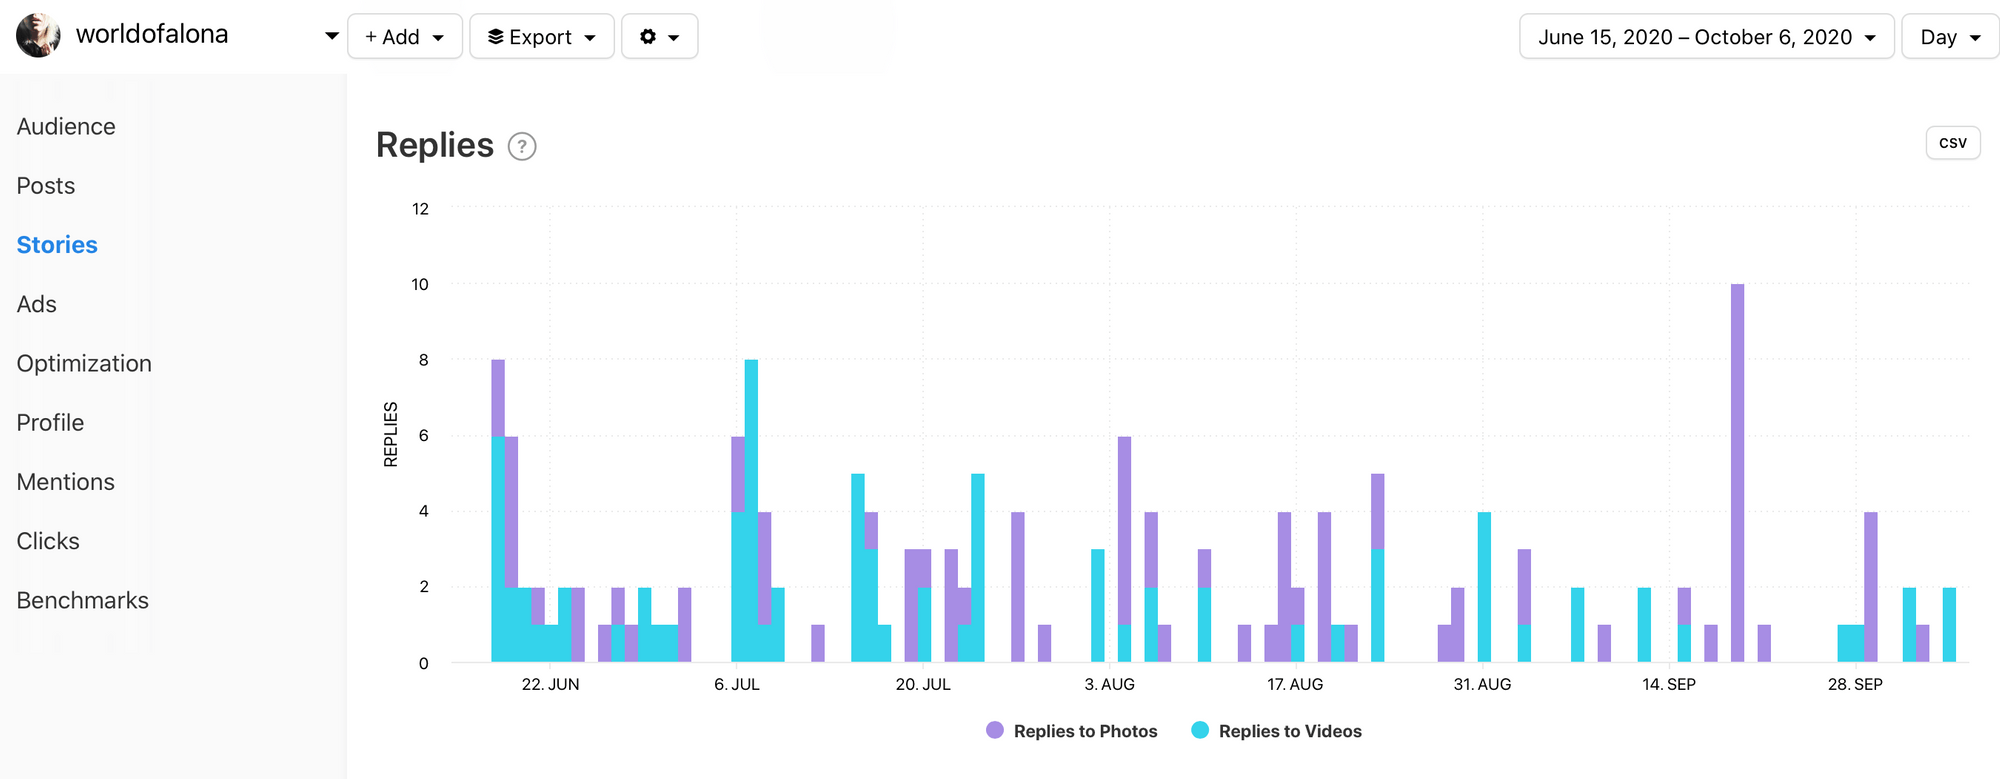
Here is another example of a spike in data. In this example we can see that on the 19th of September there were a significant amount of replies. This data can be used to replicate similar stories posts when we want to encourage replies from viewers. Note how the date shown is for a specific date range, selected in the top right-hand corner. You can select the date range suitable for your needs.
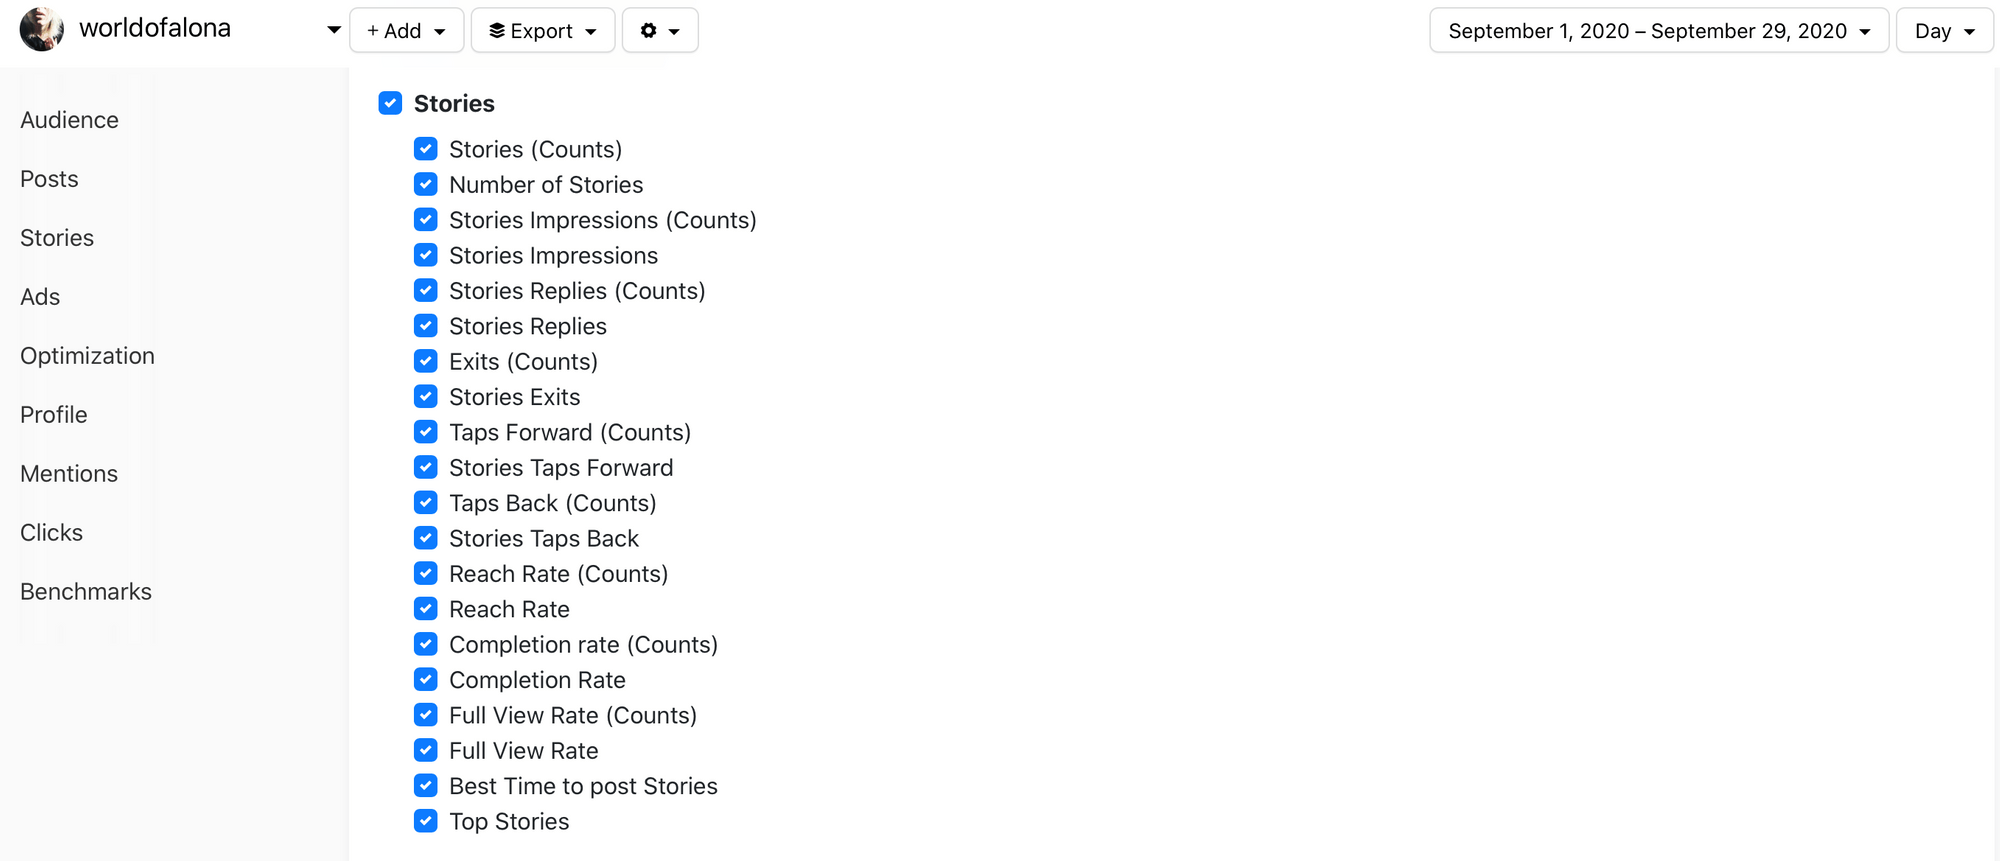
Choose between viewing data by the day, week or month, and over a specific time period of your choice. You can export the information to PDF, XLS and PPTX and even customise and schedule your report, so that you have the data that matters to you on a schedule that works for you.
Sculpt recommends Minter.io as the best Instagram Analytics reporting tool, labelling us as their weapon of choice. Find out what all the fuss is about by claiming your free 14 day trial.