


Minter.io lets you view your analytics for any period you need, from the last 7 days to a custom range with your own start and end dates.
Set a preset or custom date range
Open the report you want to view.
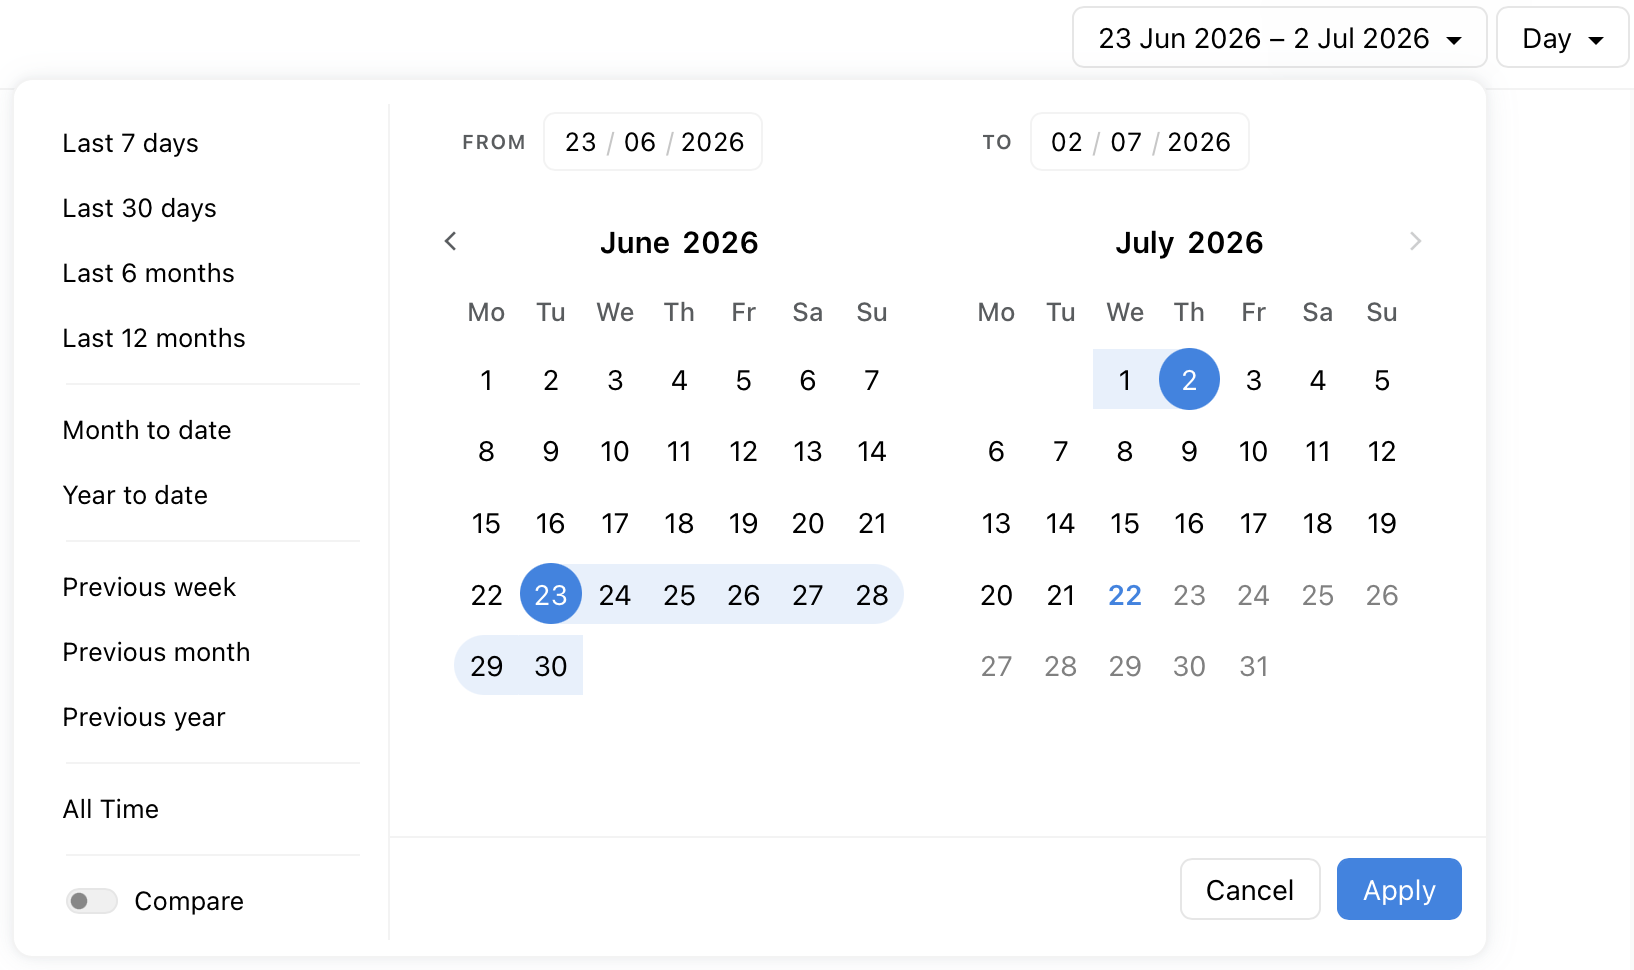
Click the date range picker at the top of the page.
Choose a preset period from the panel on the left, for example Last 7 days or Last 30 days, or select your own start and end dates in the calendar for a custom range.
Click Apply.
Compare two date ranges
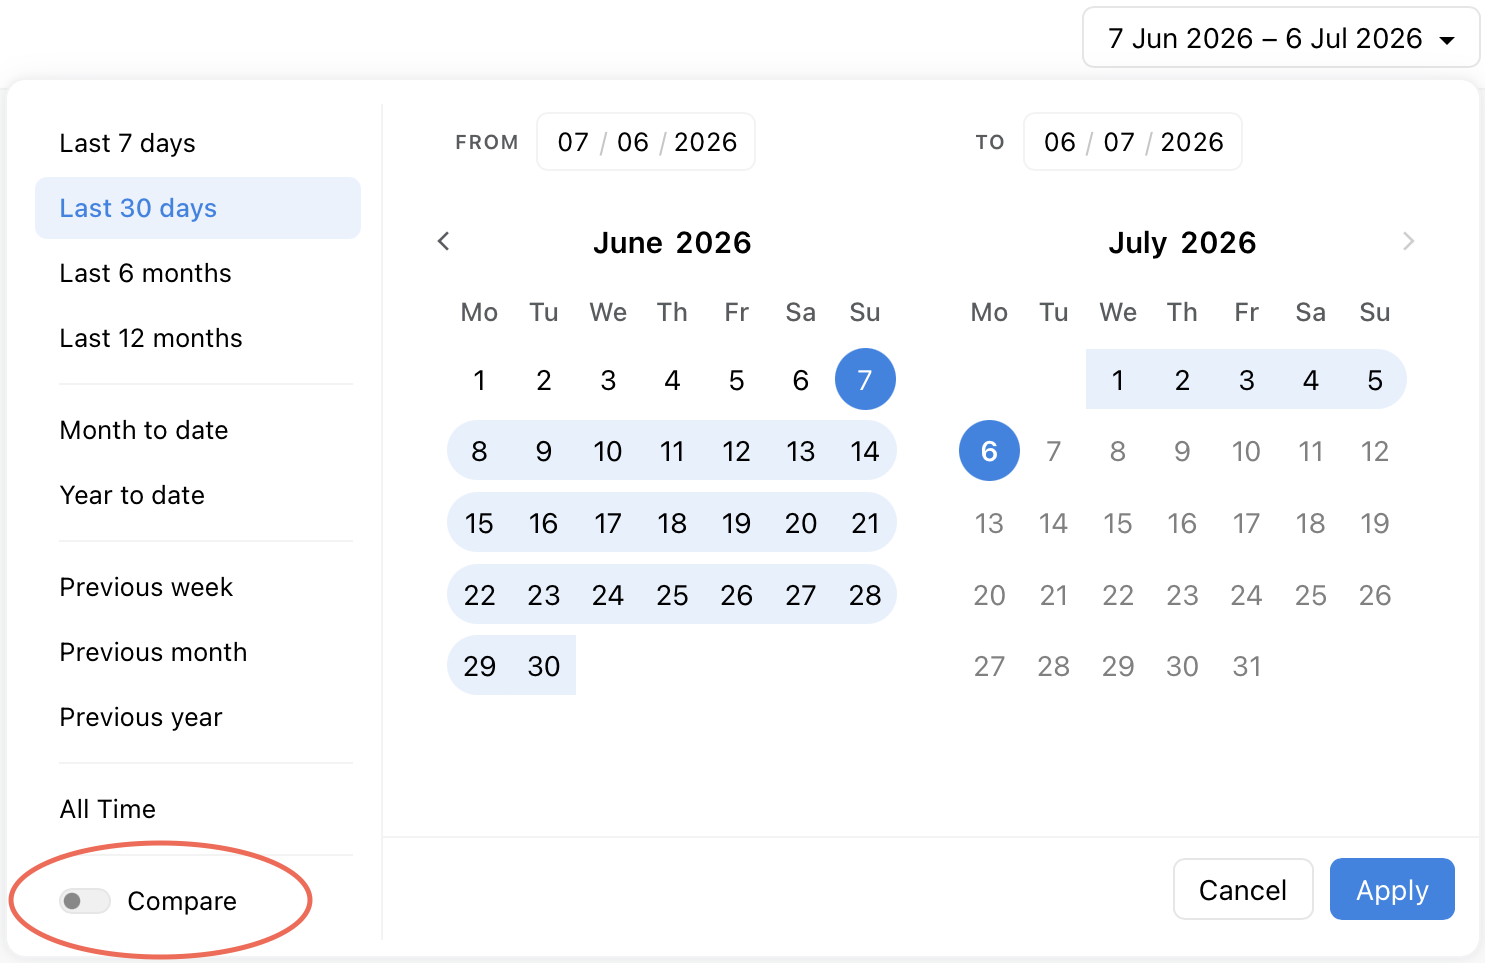
Turn on Compare in the date picker and choose a second period. Your graphs will show both ranges at once, so you can see how your performance has changed month over month, year over year, or before and after a campaign.
All time
Select All time in the date picker to view every piece of data Minter.io holds for your account. All time is also the only range that shows demographics for all of your current followers. Other date ranges show demographics only for the followers you gained during the period selected.
Group your data by day, week or month
Alongside the date range, you can also choose how your data is grouped and broken down in graphs.
Day shows every day in your selected range.
Week includes only weeks that start on a Monday within your range. Any part-week at the beginning is left out.
Month includes only months that start on the 1st. Any part-month at the beginning is left out.
If your totals look lower than expected, check whether you are grouping by Week or Month, and switch to Day to see the complete range.