Grow on Instagram with this simple benchmark comparison tool
Comparison is said to be the thief of joy, but here at Minter.io we think it’s more like the catalyst of excellence. By comparing your performance with similar accounts, you can improve your shortfalls and give yourself a good pat on the back (or a glass of something bubbly) for the metrics in which you excel.
The best part of using a comparison tool is that you don’t have to sneak up on your neighbours, hide in the bushes or twitch any curtains to get the latest scoop on how you’re stacking up. You don’t even have to keep up with the Joneses, heaping an endless amount of decorations on your ever-groaning proverbial house. You just get to pick the good parts, so you can stay classy, baby.
So, without further ado, I’d like to introduce you to Benchmarks - the dynamic feature by Minter.io that shows you how well your Instagram is performing in comparison with other accounts of a similar size. It covers multiple metrics and you can even check out graphs from your competitors.
Comparing data against accounts of similar sizes
If you were to compare your profile against every single other account on Instagram, unless you’re Beyonce (hey, Queen Bey), you might wind up feeling pretty rubbish. I mean, is it really fair to compare Aunt Susie’s local bakery with Instagram’s own account @instagram with 658 million followers, or football star Cristiano Ronaldo’s account @cristiano with the massive goal of 606 million followers? I think not.
Comparing accounts should be helpful and balanced. It should leave you with clear goals and actionable takeaways. That’s why benchmark graphs show how your account compares with accounts of a similar follower size. Data is grouped into cohorts, so no matter what size following you have, or how much you grow in the future, you’ll always be comparing your profile with relevant data.
Available data with Benchmarks
You can get access to your own benchmark graphs and/or benchmark graphs for competitor accounts. With your own benchmark data, you can easily see the areas where you’re succeeding and the areas you can improve upon. With competitor data, you can find areas to learn from and replicate in order to accelerate your growth.
Benchmark metrics are based on the last 30 days of performance so you get data that’s always up to date.
Instagram benchmark data includes:
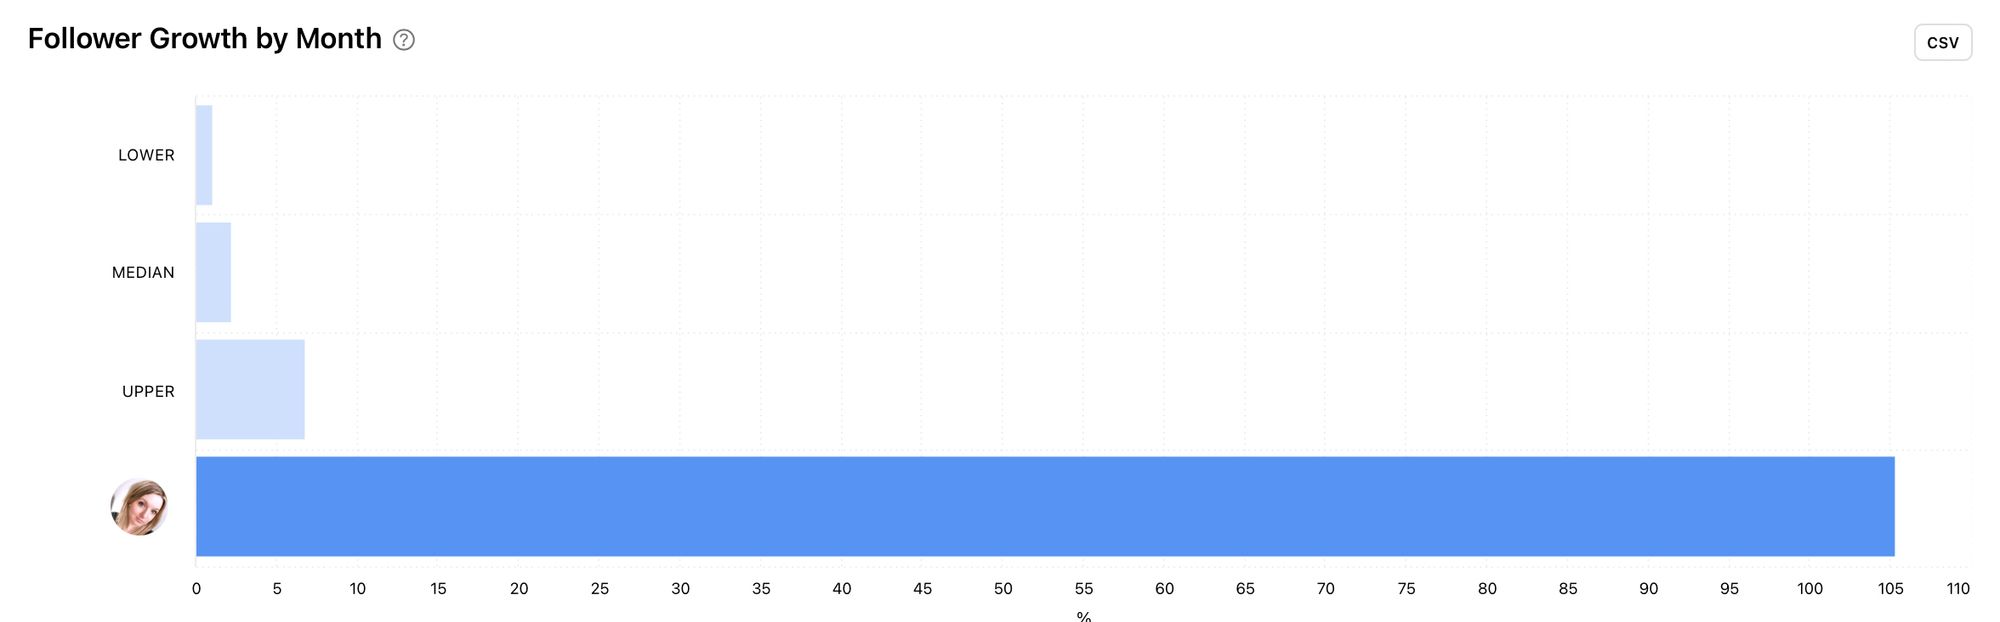
- Follower Growth per Month
- Posts per Month
- Engagement Rate per Post
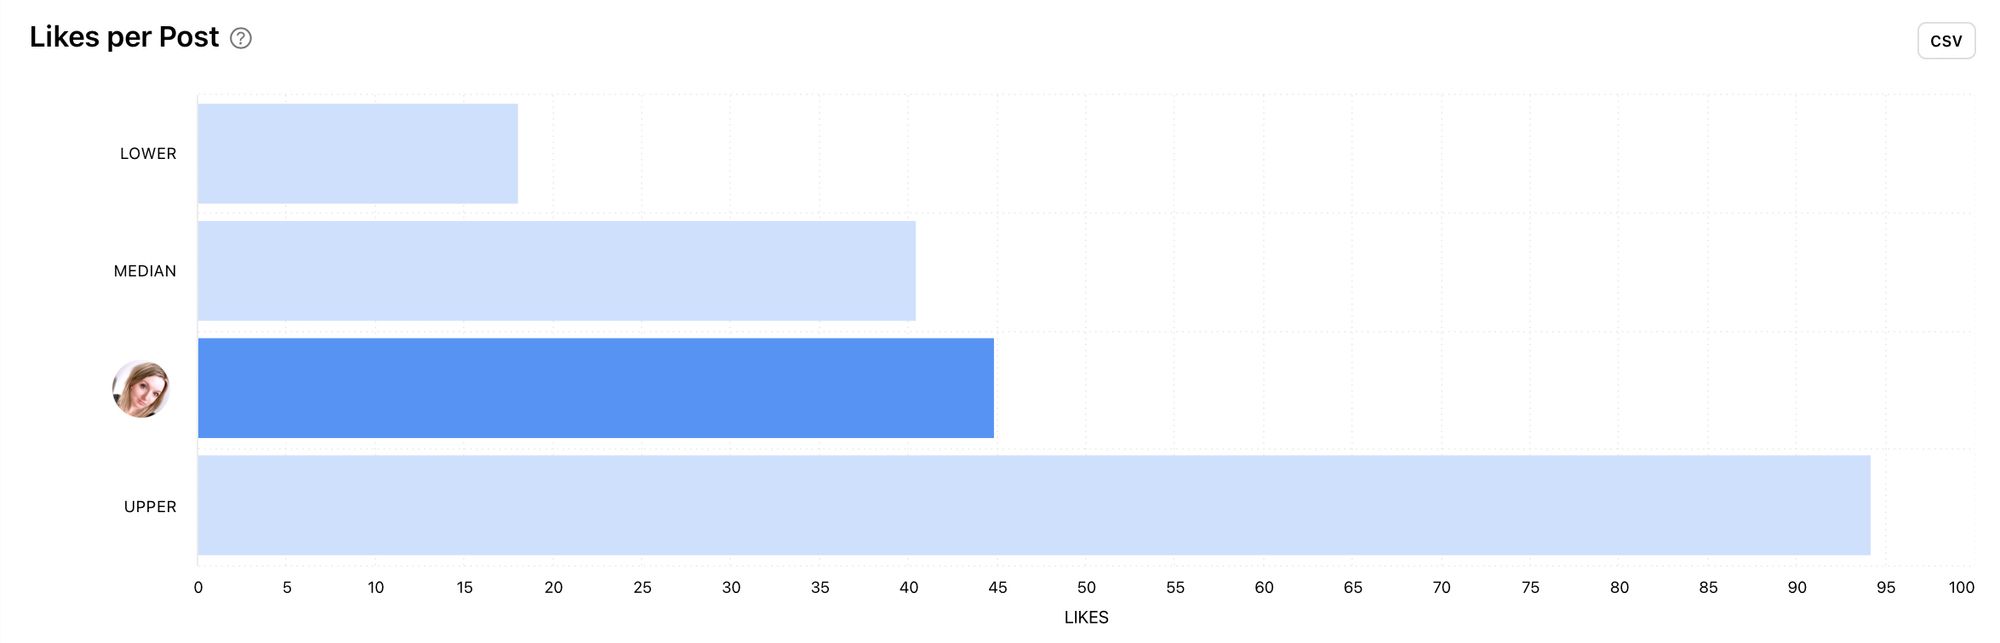
- Likes per Post
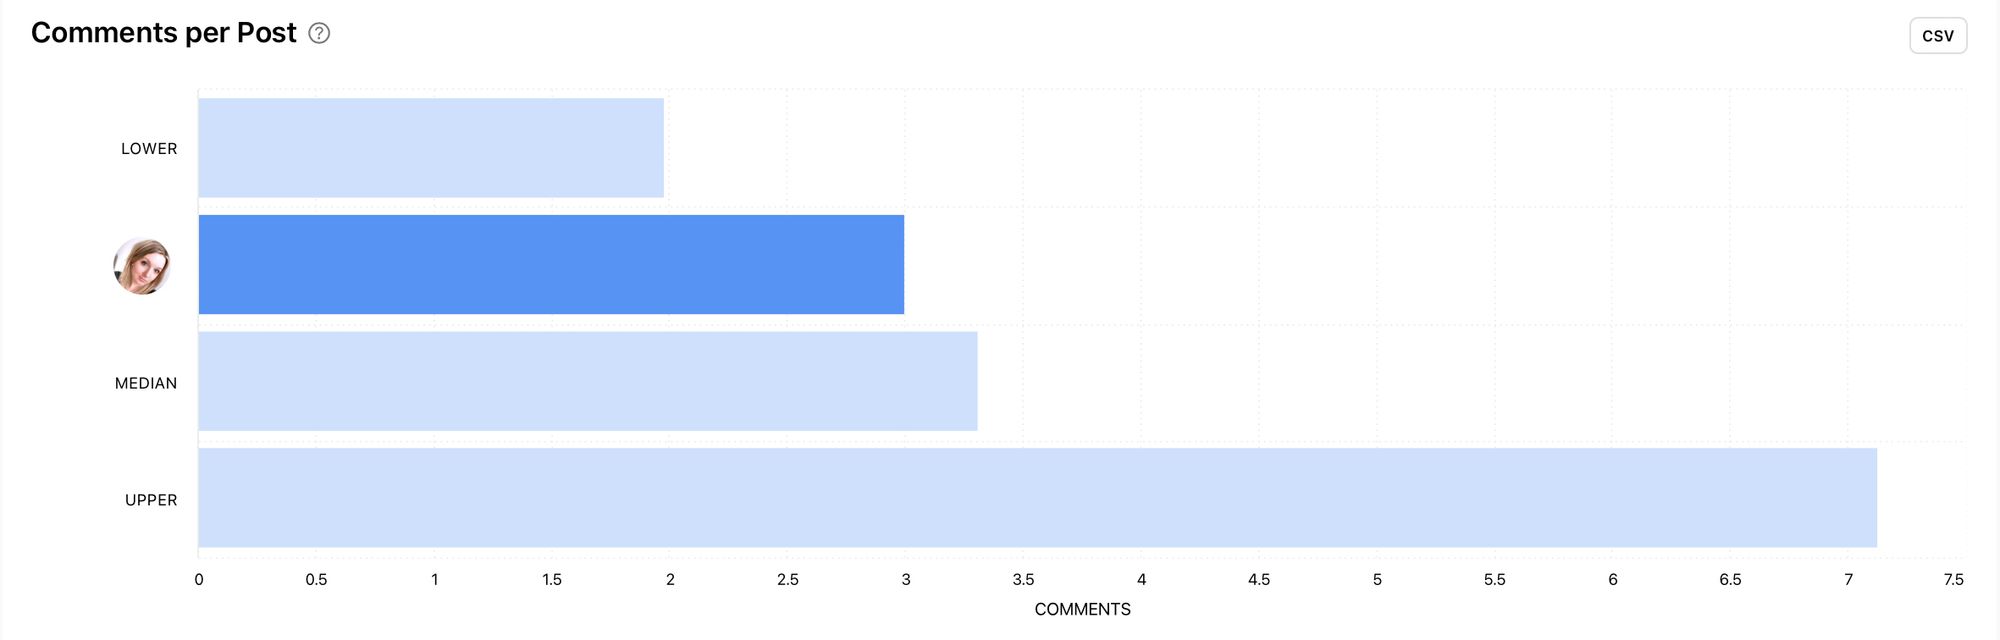
- Comments per Post
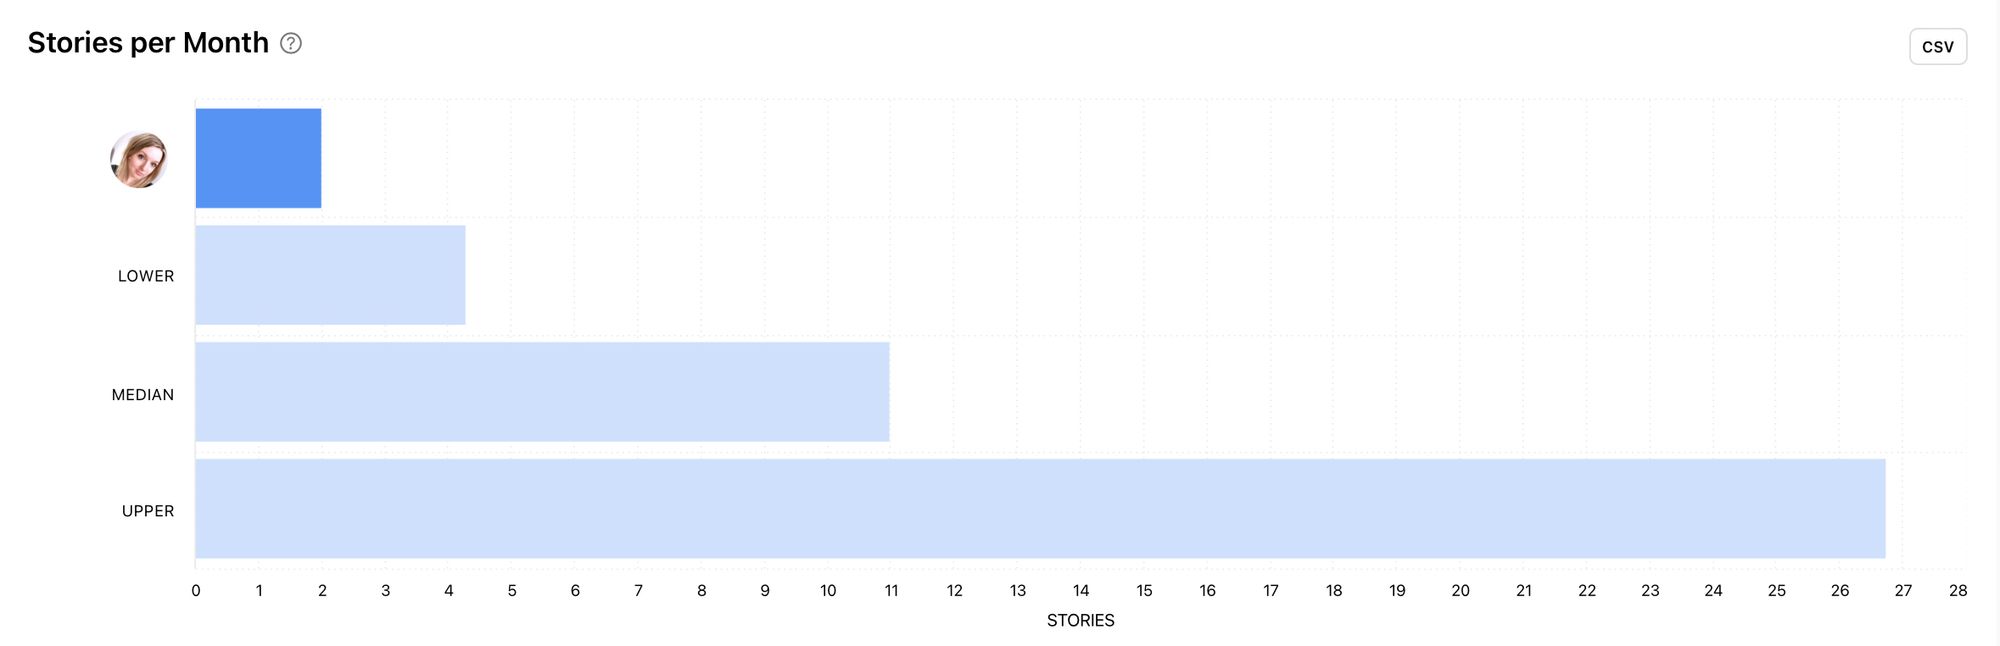
- Stories per Month
- Reach Rate per Story
Competitor benchmark data includes:
- Follower Growth per Month
- Posts per Month
- Engagement Rate per Post
- Likes per Post
- Comments per Post
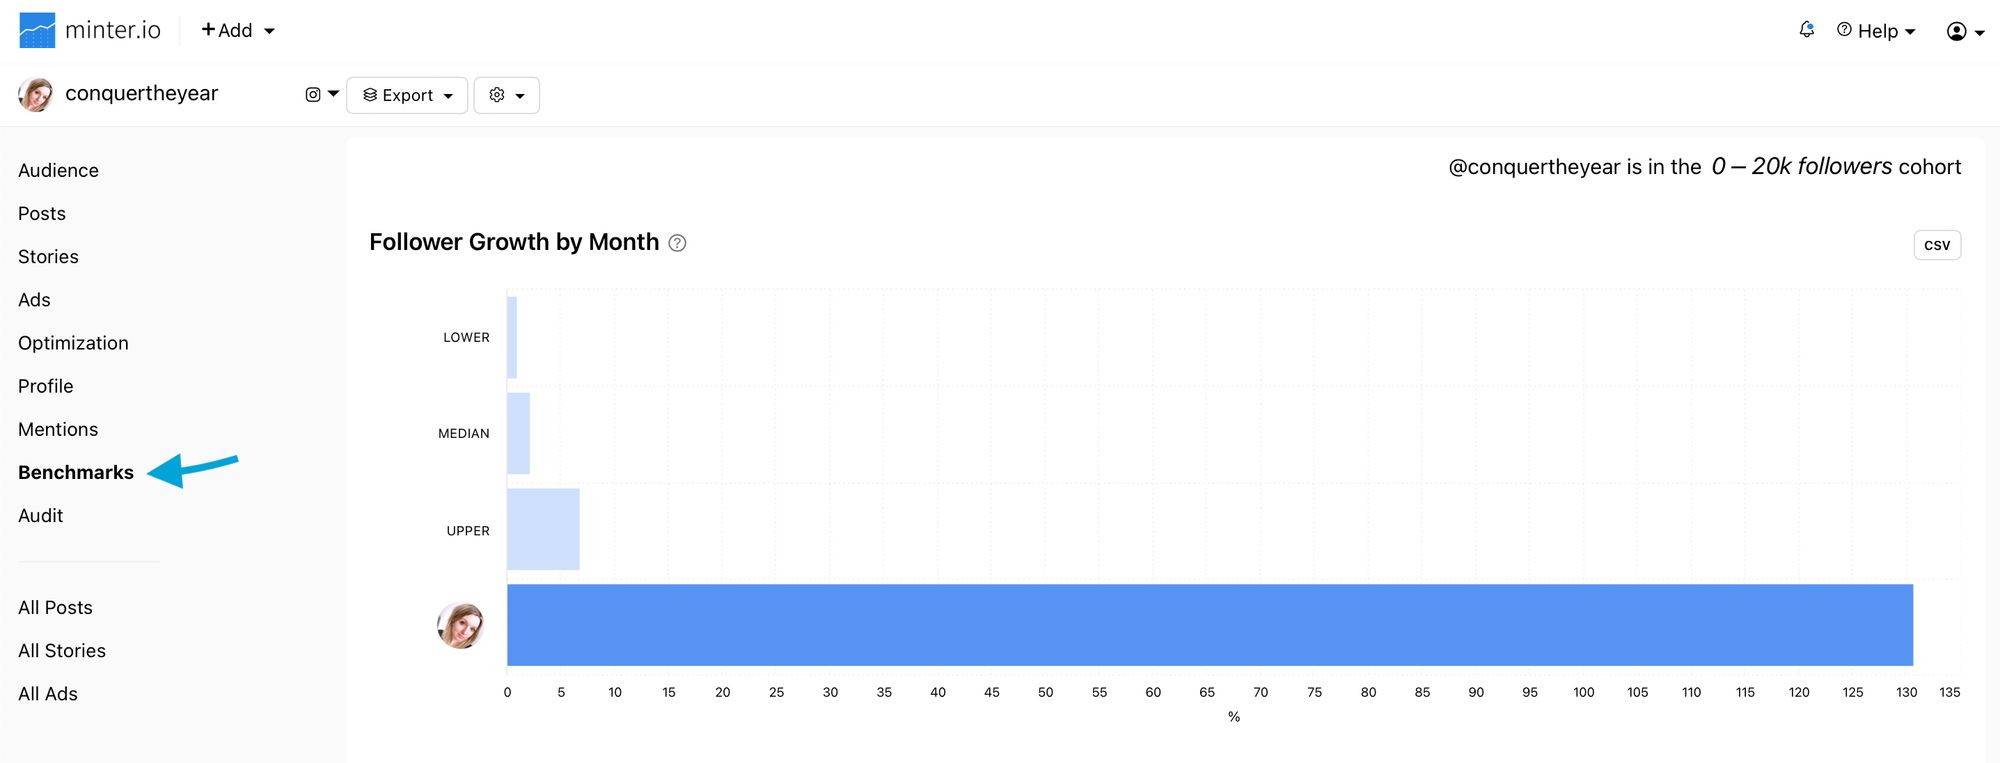
How to interpret data
Your Instagram profile’s benchmark ranking is placed within a graph of lower, median and upper performance bars. Generally speaking, if your data is performing well you’d expect it to be around the median to upper bars, whereas if your data is around the lower bar, this may be an area to improve.
When looking at competitor data, remember that your competitor may be in a different follower size cohort to your own. This may mean that there isn’t a direct comparison between your profile and a competitor, however there’s still so much you can gain and learn here.
Lower
If a metric is coming in around or under the lower bar in the graph, this is an area to improve. Depending on the graph, an improvement could be as simple as posting more regularly or working on a specific metric to boost with your content. Think about what’s missing. Make sure you’re implementing best practices and looking into techniques other accounts are utilising for boosted performance.
If competitor data is coming in at the lower end, maybe miss out on replicating content that results in the low ranking. Instead, look at your competitor’s Instagram content and ask yourself what they could do to improve this metric, then apply those pointers to your own account.
Median
Around the median is a solid place to start. You’re clearly doing something right but what could you do to nudge this metric towards the upper area? In the example below, trying out a few content tweaks (such as adding a call-to-action or asking a question) could be all it takes to start heading towards the upper bar.
Competitor data landing around the median spot could be an indicator of a solid strategy. Particularly in areas where you’re struggling to get off the ground, look to median competitor data to try to spot common Instagram tactics, consistencies and positive outliers to implement into your own strategy.
Upper
The upper range and beyond is the bullseye of benchmark data. If you’re floating around the upper bar or going beyond it, lean into what you’re currently doing and keep going for gold.
If your competitors are reaching or overtaking the upper bar in a graph, this is your opportunity to look at what they’re doing and transform their techniques into tips for your own strategy.
Export benchmark data
You can export data for a specific benchmark as a CSV file in a single click using the button next to the graph.
How to unlock benchmark data with Minter.io
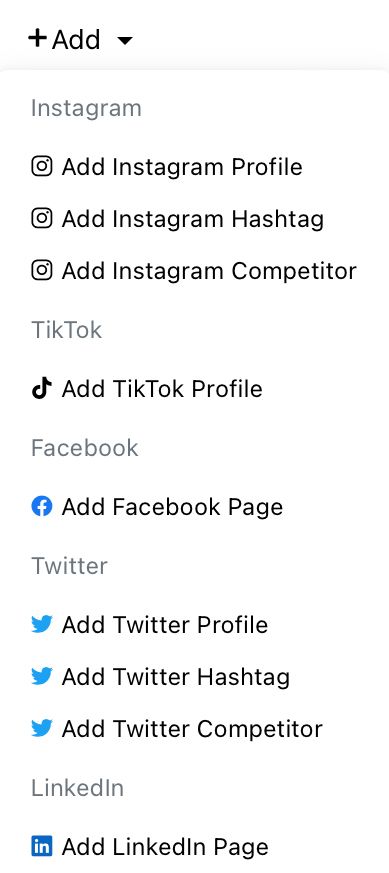
Let’s get you started with your own Instagram benchmark data. If you haven't already, sign up to Minter.io here. Once you’re signed up, you can add your own social media accounts and competitor accounts from the dashboard using the ‘+Add’ button.
To access benchmark data:
- Log onto your Minter.io account.
- From the dashboard, choose an Instagram profile to view data for.
- Select ‘Benchmarks’ from the panel on the left-hand side of the screen.
Sign up to Minter.io today to get access to Benchmarks for your Instagram account. In the process, you’ll unlock analytical data for several social media accounts, hashtags and competitors. Check it out now.
Try it today! →