How to use competitor data to grow on Instagram
Ever wanted to take a nosey into other brands’ social media analytics? Well, it might be easier than you think. With competitor analytics you can peak behind the curtain and see how well other accounts are really doing. We’re spilling the tea on how to unlock insights for your rivals, so whether you use this info for inspiration or to give yourself a competitive edge, you’ll truly understand why knowledge is power by the end of this article…
Use competitor analytics to your advantage
You can learn a lot from your competitors. After all, it’s likely they’ll have a similar target audience, products, services and business goals. However, there’s only so much you can learn by staring at someone’s social media accounts. With Minter.io you can access insights for business Instagram accounts to learn more about what’s working for a brand.
With a plethora of data to peruse, you can use competitor information to better craft your own social media content. With competitor analytics, you could achieve more than you ever thought, because the more information you have to hand, the better equipped you are to thrive online.
Let’s check out the competitor data available to you with Minter.io…
Audience
Audience insights are great for viewing how a competitor’s brand is growing online. With Instagram competitor insights, Minter.io grants access to data on followers, follower change and follows.
Followers
View a competitor’s follower count over time. This is the total amount of followers the account has. Is it steadily increasing or decreasing? Are there points in which the number of followers spikes or dips? Are there sections of rapid growth or decline?
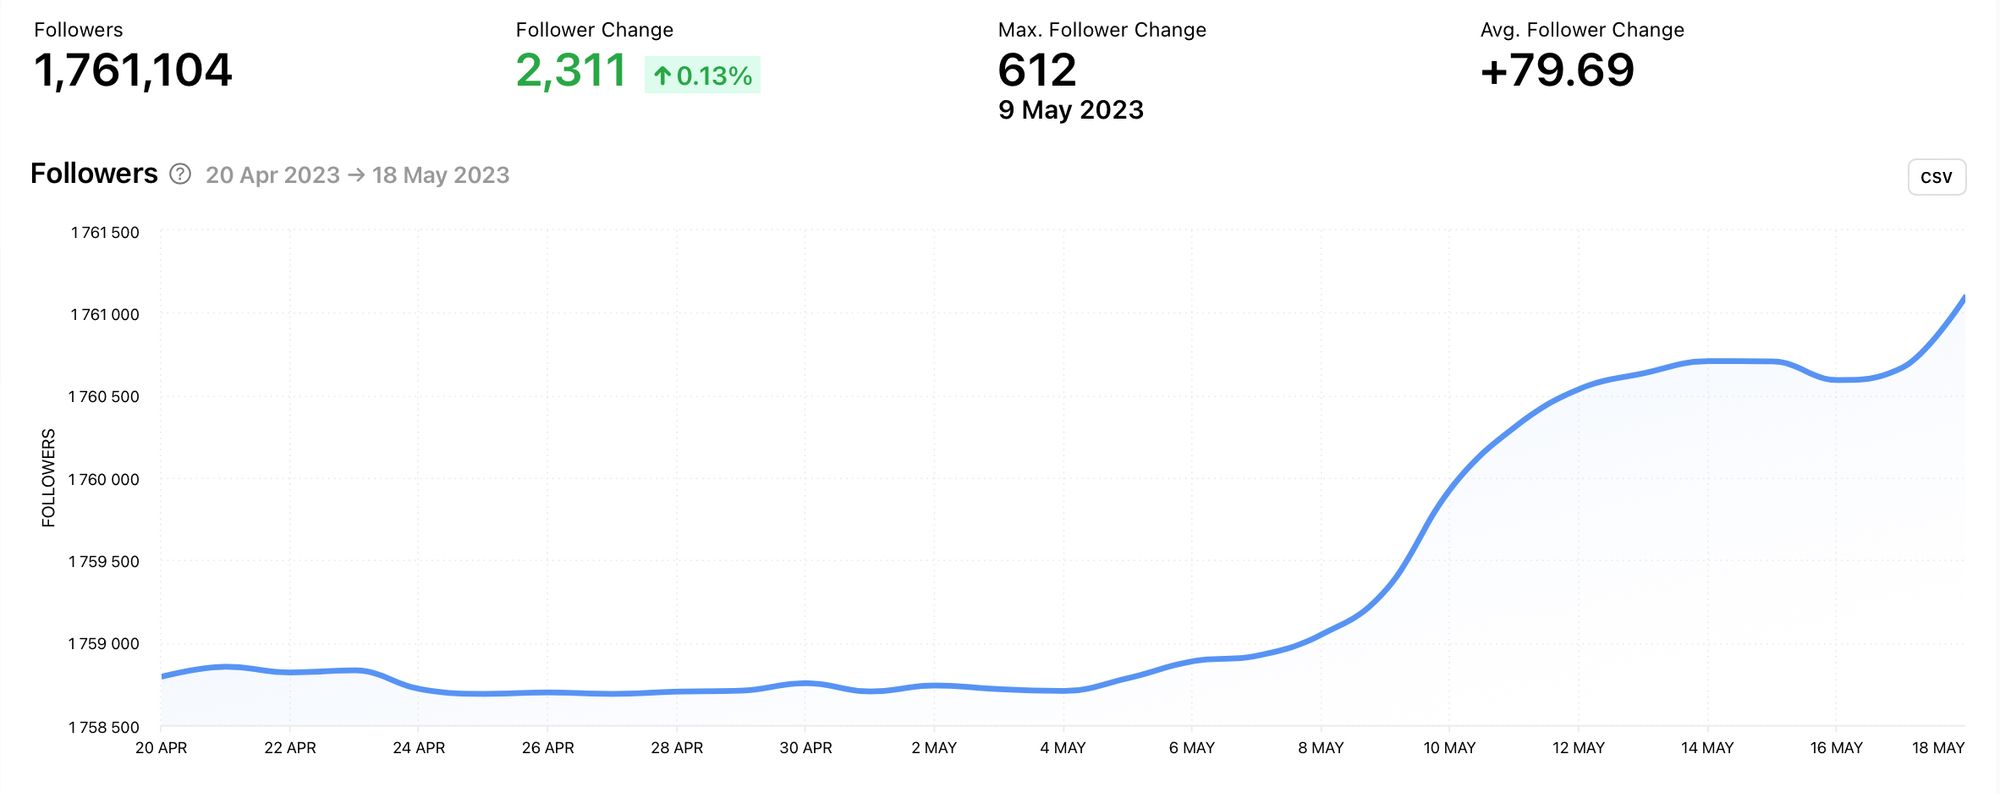
Notice that in this example there is a period of rapid growth, followed by a slight dip before the follower count continues to rise again. Using this graph, you can pinpoint the dates where follower growth increased significantly. You can then find the content that was posted around these dates and determine what triggered the rapid growth. This is a great way to draw inspiration from content that drives growth and replicate effective techniques to produce growth of your own.
Follower Change
Check out the follower change graph to see exactly how many followers an account has gained or lost. Use it to pinpoint precisely what is happening day by day.
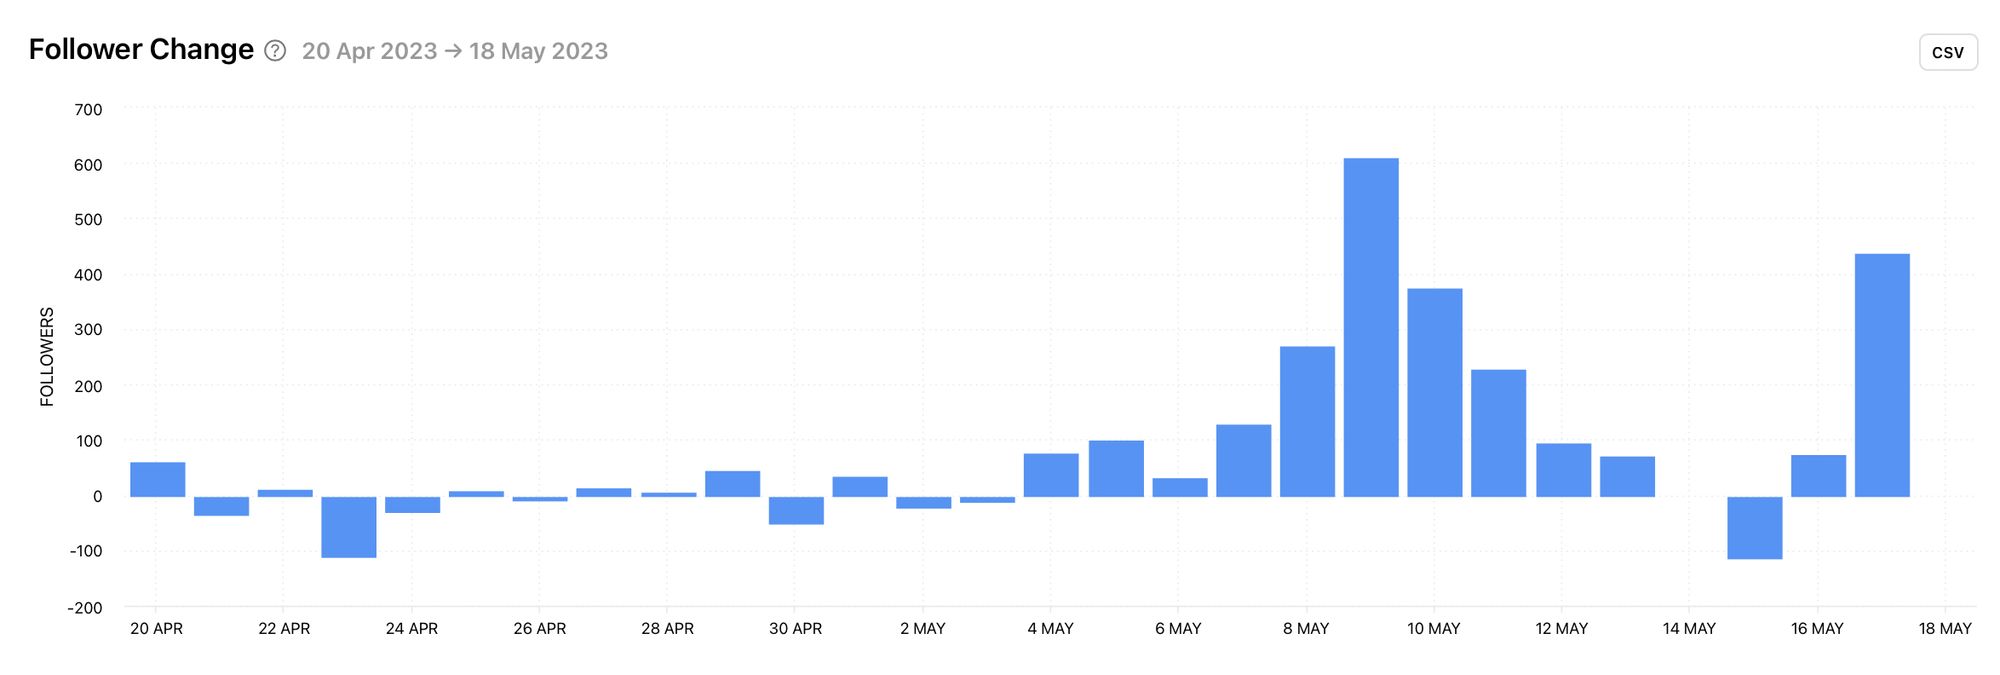
It’s easy to pick out a time frame of follower growth as well as days where the follower change was negative. Using these dates, you can find content that led to positive and negative follower change. With this knowledge you can craft a content plan that avoids pitfalls while embracing content types, tones and trends that sparked growth for your competitors.
Follows
The follows graph shows the amount of accounts the competitor account is following.
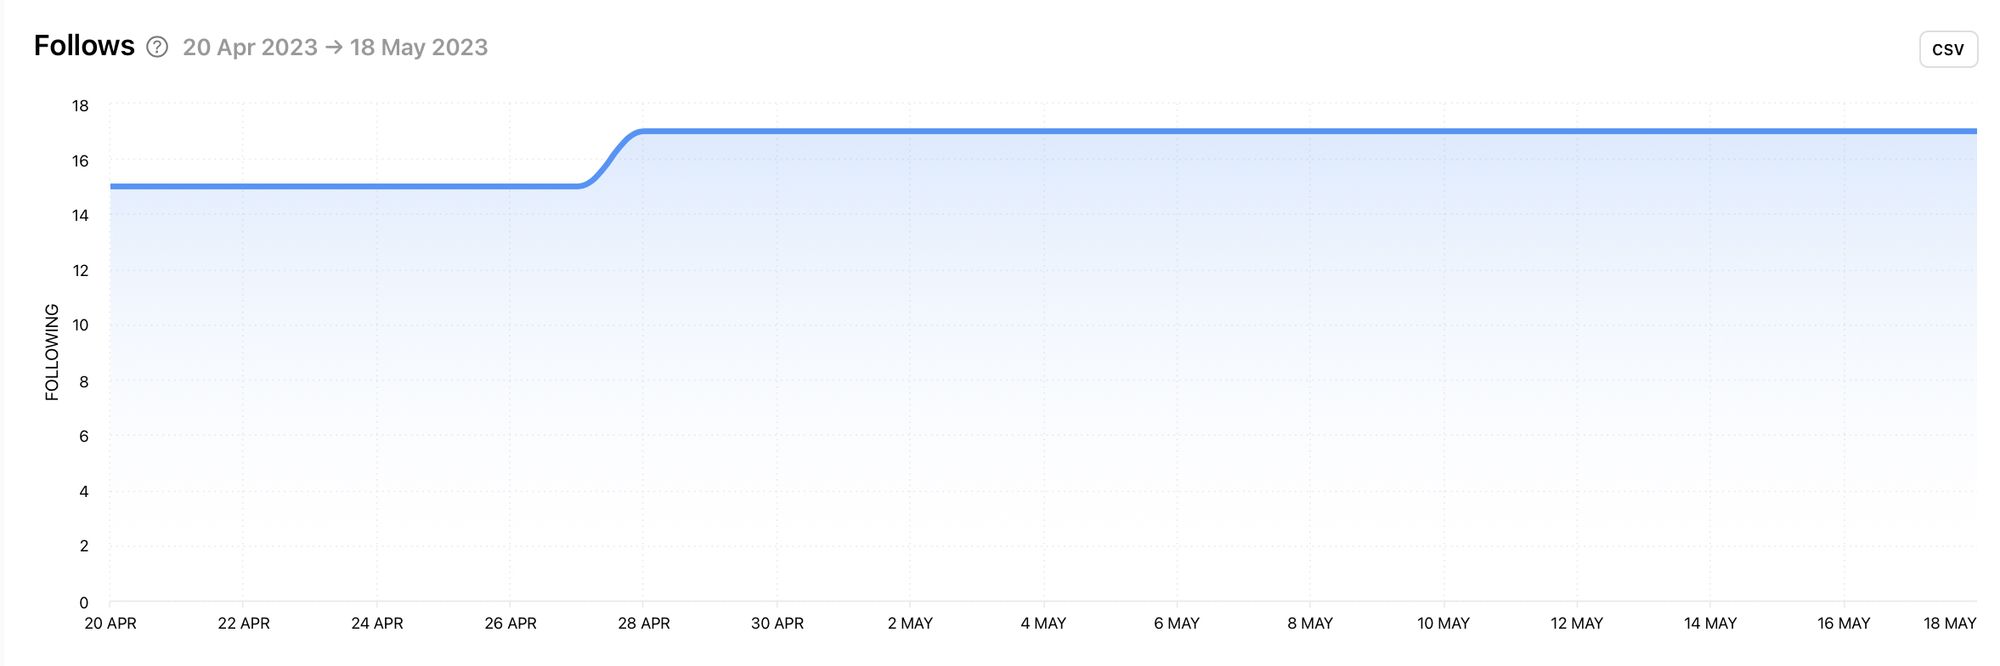
The follows graph can give an indication of several things…
It could be an indicator of the success of an Instagram account. Generally speaking, successful brands tend to follow a smaller amount of accounts in relation to the amount of accounts that are following them. (The exception to this is paid-for followers. A dead giveaway of this poor practice is a high follower count with a very low engagement rate.)
If the follows amount is similar to the followers graph, this correlation could be an indication of a follow-for-follow strategy. This typically suggests that the follower number is gained merely by following accounts with the hope that those accounts will follow back. This is a pretty bad strategy that generally leads to vanity metrics over engaged fans and genuine customers.
If an account has a small amount of follows and an additional follow coincides with a rise in follower growth and/or engagement, this could be a sign of a collaboration worth taking note of. This kind of collaboration could inspire you to seek out similar brands to collaborate with to spark a similar reaction.
Posts
Insights on posts grant a view into the content strategy of a competitor and how effective that strategy is. With data on individual posts in addition to metrics over a selected time frame, Minter.io gives you the power to adopt what works while avoiding what doesn’t.
Number of Posts
See how often a competitor is posting and the types of media used. Are they publishing consistently? What types of content are they posting e.g. photos, videos, carousels or reels? Is one type of media favoured over the others?
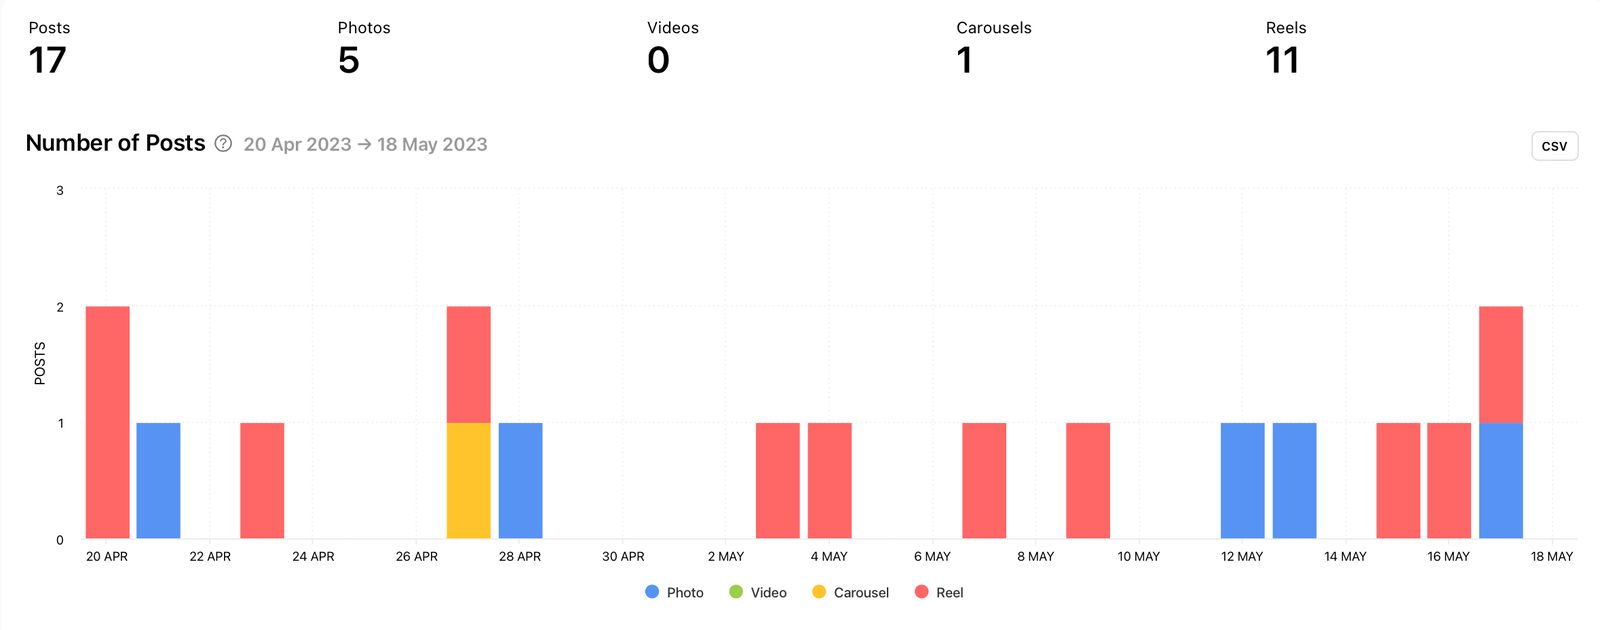
Notice how in this example, reels are the most common form of content published. You can use this graph to consider the content types that might be a good fit for your brand too. You can also consider the frequency of posting. Are you posting more or less frequently than your competitor? Is posting more or less having a significant impact on the growth of the profile and the engagement on posts?
Likes
The amount of likes is an engagement metric that shows positive interaction from content viewers. Just like the previous graph, the likes graph is colour-coded by post type so you can easily see which kinds of posts are getting a good reaction.
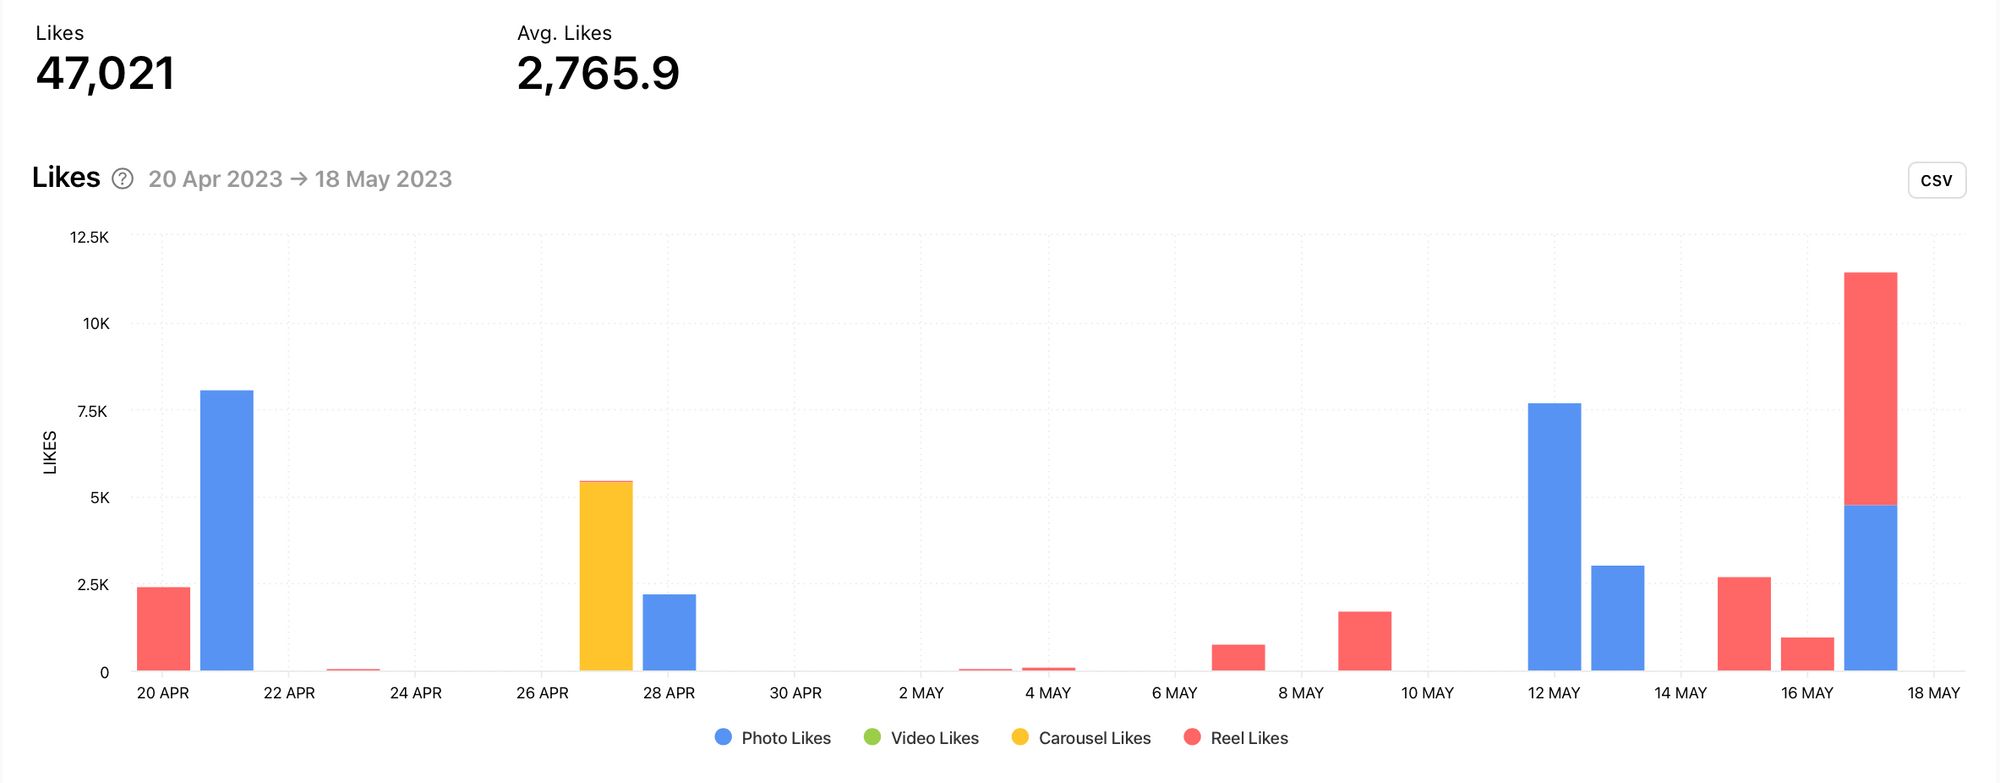
Does the number of likes peak with specific types of content? What does the audience respond well to and how could you use this knowledge to craft content that your audience is more likely to respond positively to?
Comments
Another major engagement metric is comments, however comments aren’t guaranteed to be positive reactions so bear that in mind when interpreting this data. Comments require more effort than simply tapping a post to like it, so they’re worth cultivating in your community. Knowing the kinds of posts that are gaining comments for your competitors is a good way to start introducing more content that’s likely to boost your own engagement.
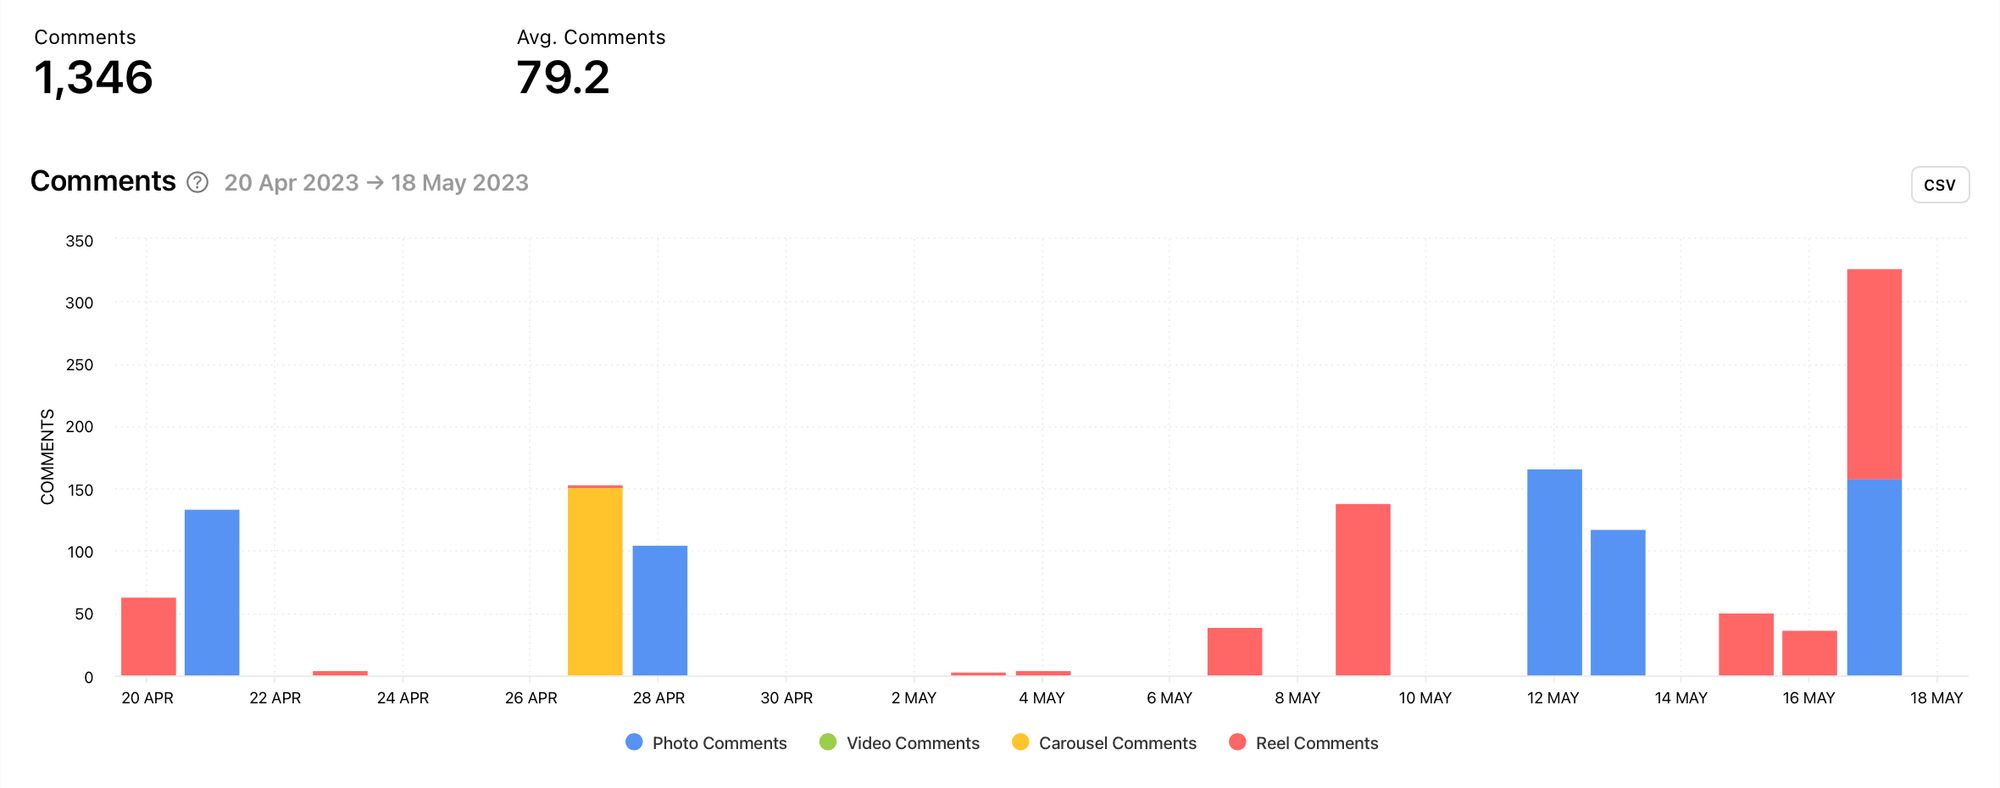
When using this graph in conjunction with the previous two graphs, you can see that engagement was particularly high on the 17th of May, even though there wasn’t a significant increase in posts that were published on that day. You can also see that likes were high as well as comments, making it reasonable to assume that the comments are likely to be for positive reasons. This information can be used to discover which posts were published on that day, which can then be assessed to figure out what made those posts pop which enables you to incorporate similar ideas into your content strategy.
Post Engagement Rate
The post engagement rate graph takes into consideration likes and comments. This is then divided by the number of posts and the number of followers. Use this to assess how your competitor’s audience is interacting with posts across multiple days. The peaks and dips are really clear when laid out in this way.
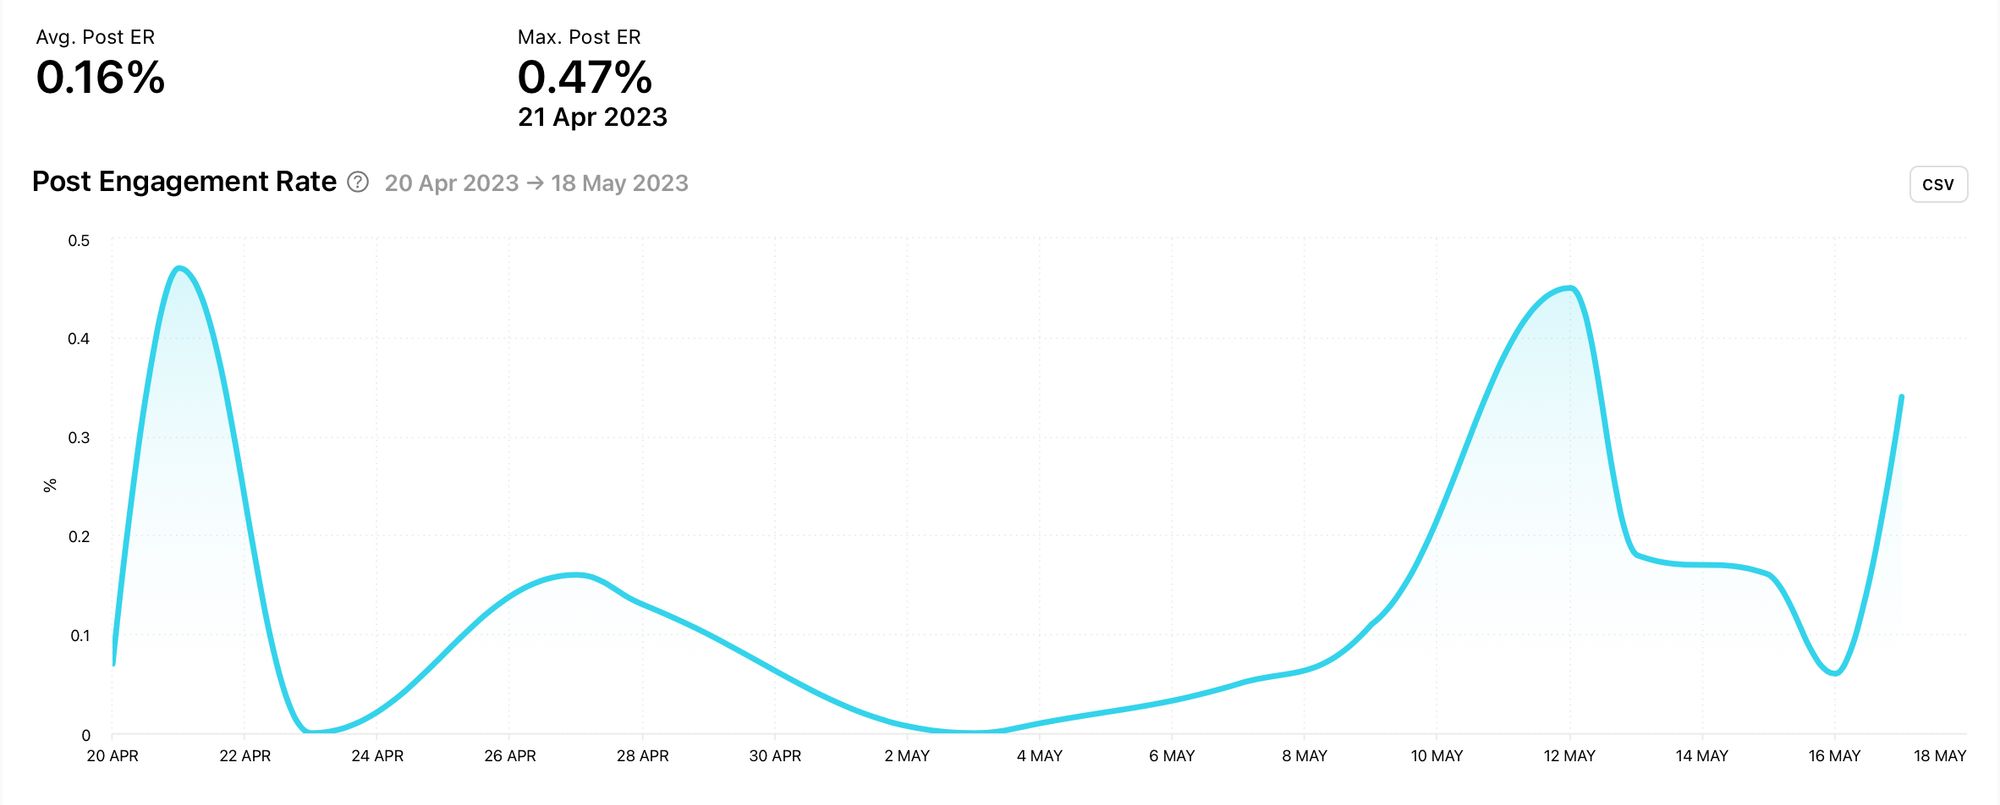
In this example, there are a number of clear engagement peaks. Take note of these so you can detect which days generated high levels of engagement and what was happening to spark these peaks. Perhaps it was a specific content type, the number of posts published or an outside source such as a shoutout or a collaboration.
Profile Engagement Rate
The profile engagement rate graph takes into consideration likes and comments. This is then divided by the number of followers. Again, the clear visuals make the peaks and dips really obvious.
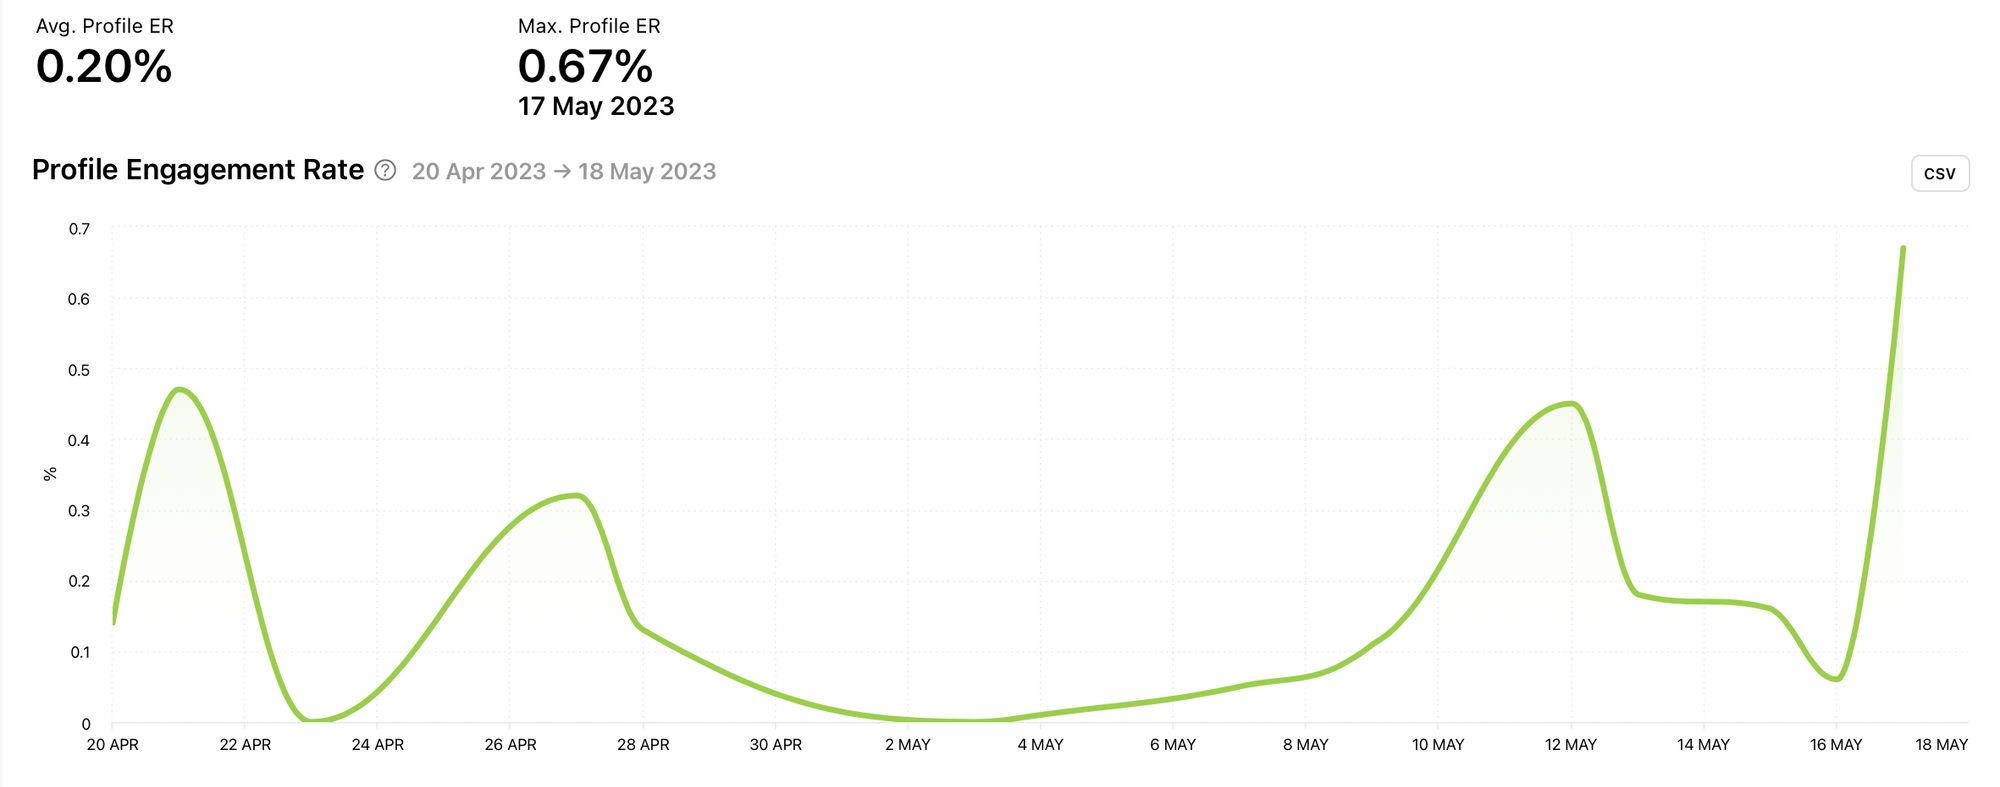
The higher the peak, the better the engagement rate, so take note and use the other graphs to determine what was happening during those peaks which helped your competitor reach those heights.
Posts by Metric
Check out posts created by your competitor and view them by engagement rate, interactions, likes, comments, follower change or date. You can also choose to view all posts or opt to view only image, video, carousel or reel content. Here you can get inspiration based on the best performing content for your competitor, sorted by the metric and media type of your choice.
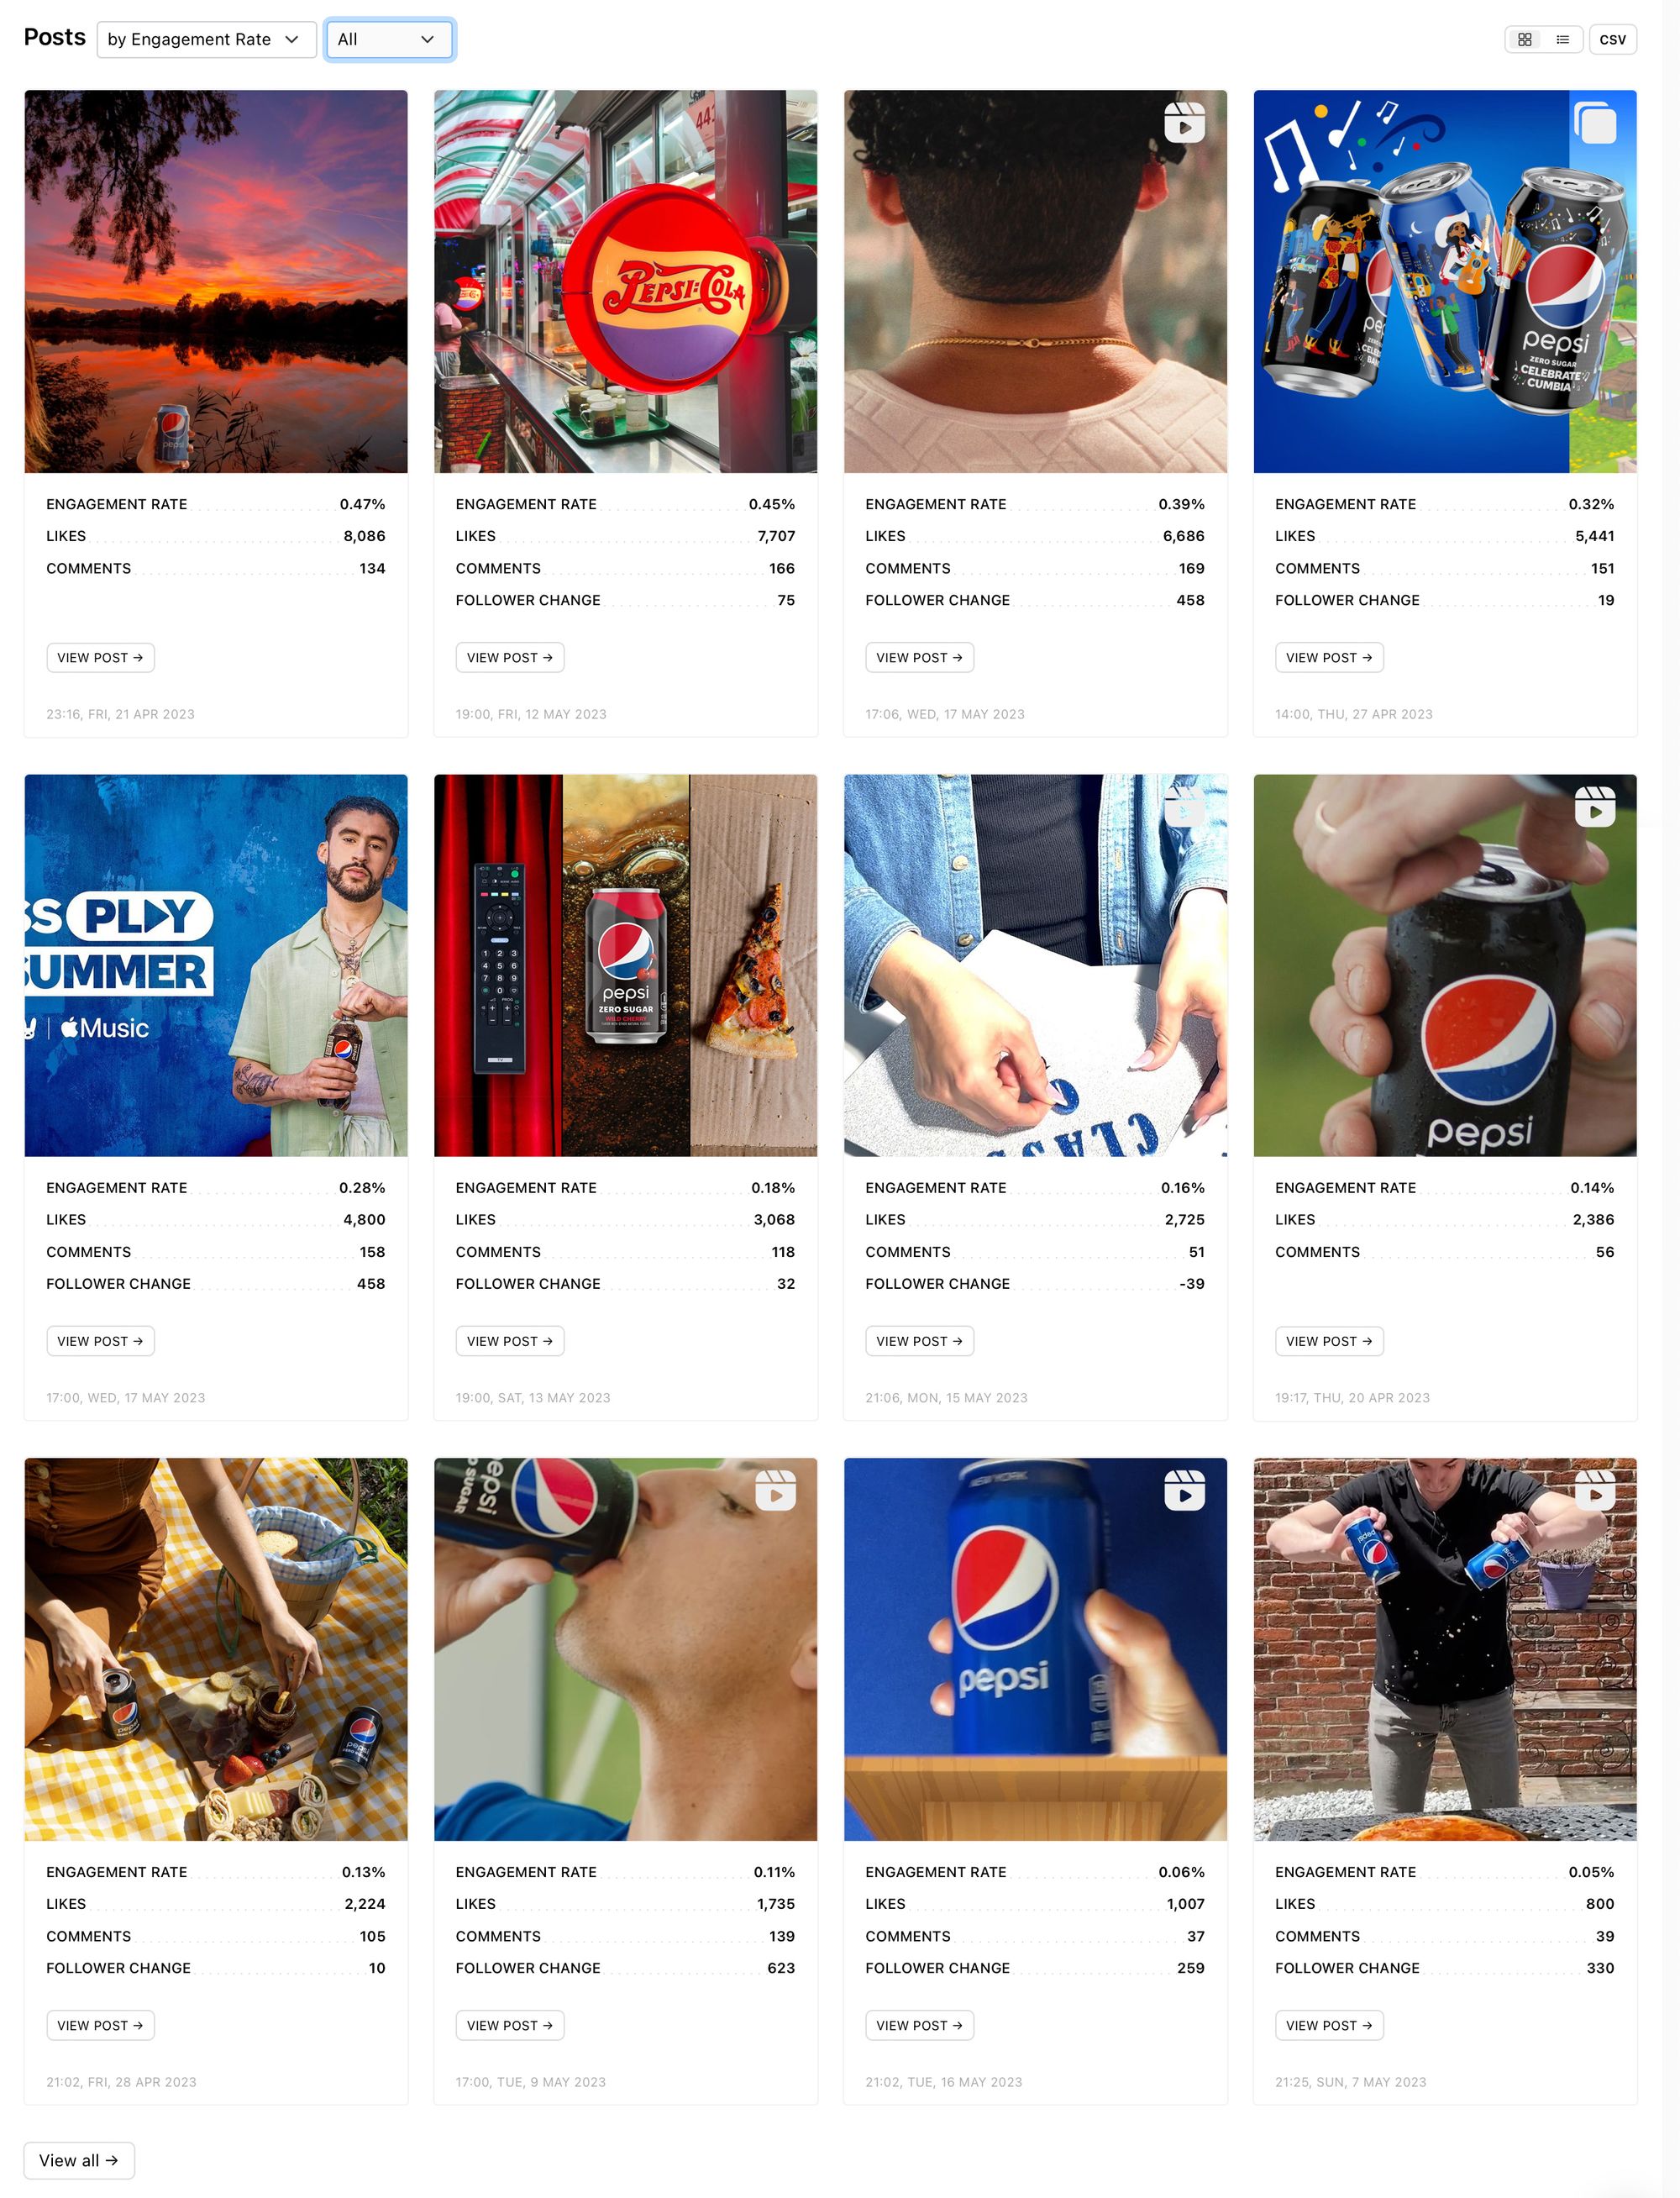
See the engagement rate, likes, comments and follower change of posts while viewing the imagery associated with those metrics. Which posts catch your eye? What colours, objects and graphics are you drawn to? Why do you think these posts have performed well for your competitor?
Select ‘View all’ at the bottom of the screen to view more posts from this competitor or jump to the ‘All Posts’ section using the panel on the left-hand side of the screen.
Individual Posts
Click on a piece of content or select the ‘View Post’ button to view a piece of content in more detail. View the imagery, description and hashtags on a post alongside the post metrics including: engagement rate, likes, comments, shares and follower change.
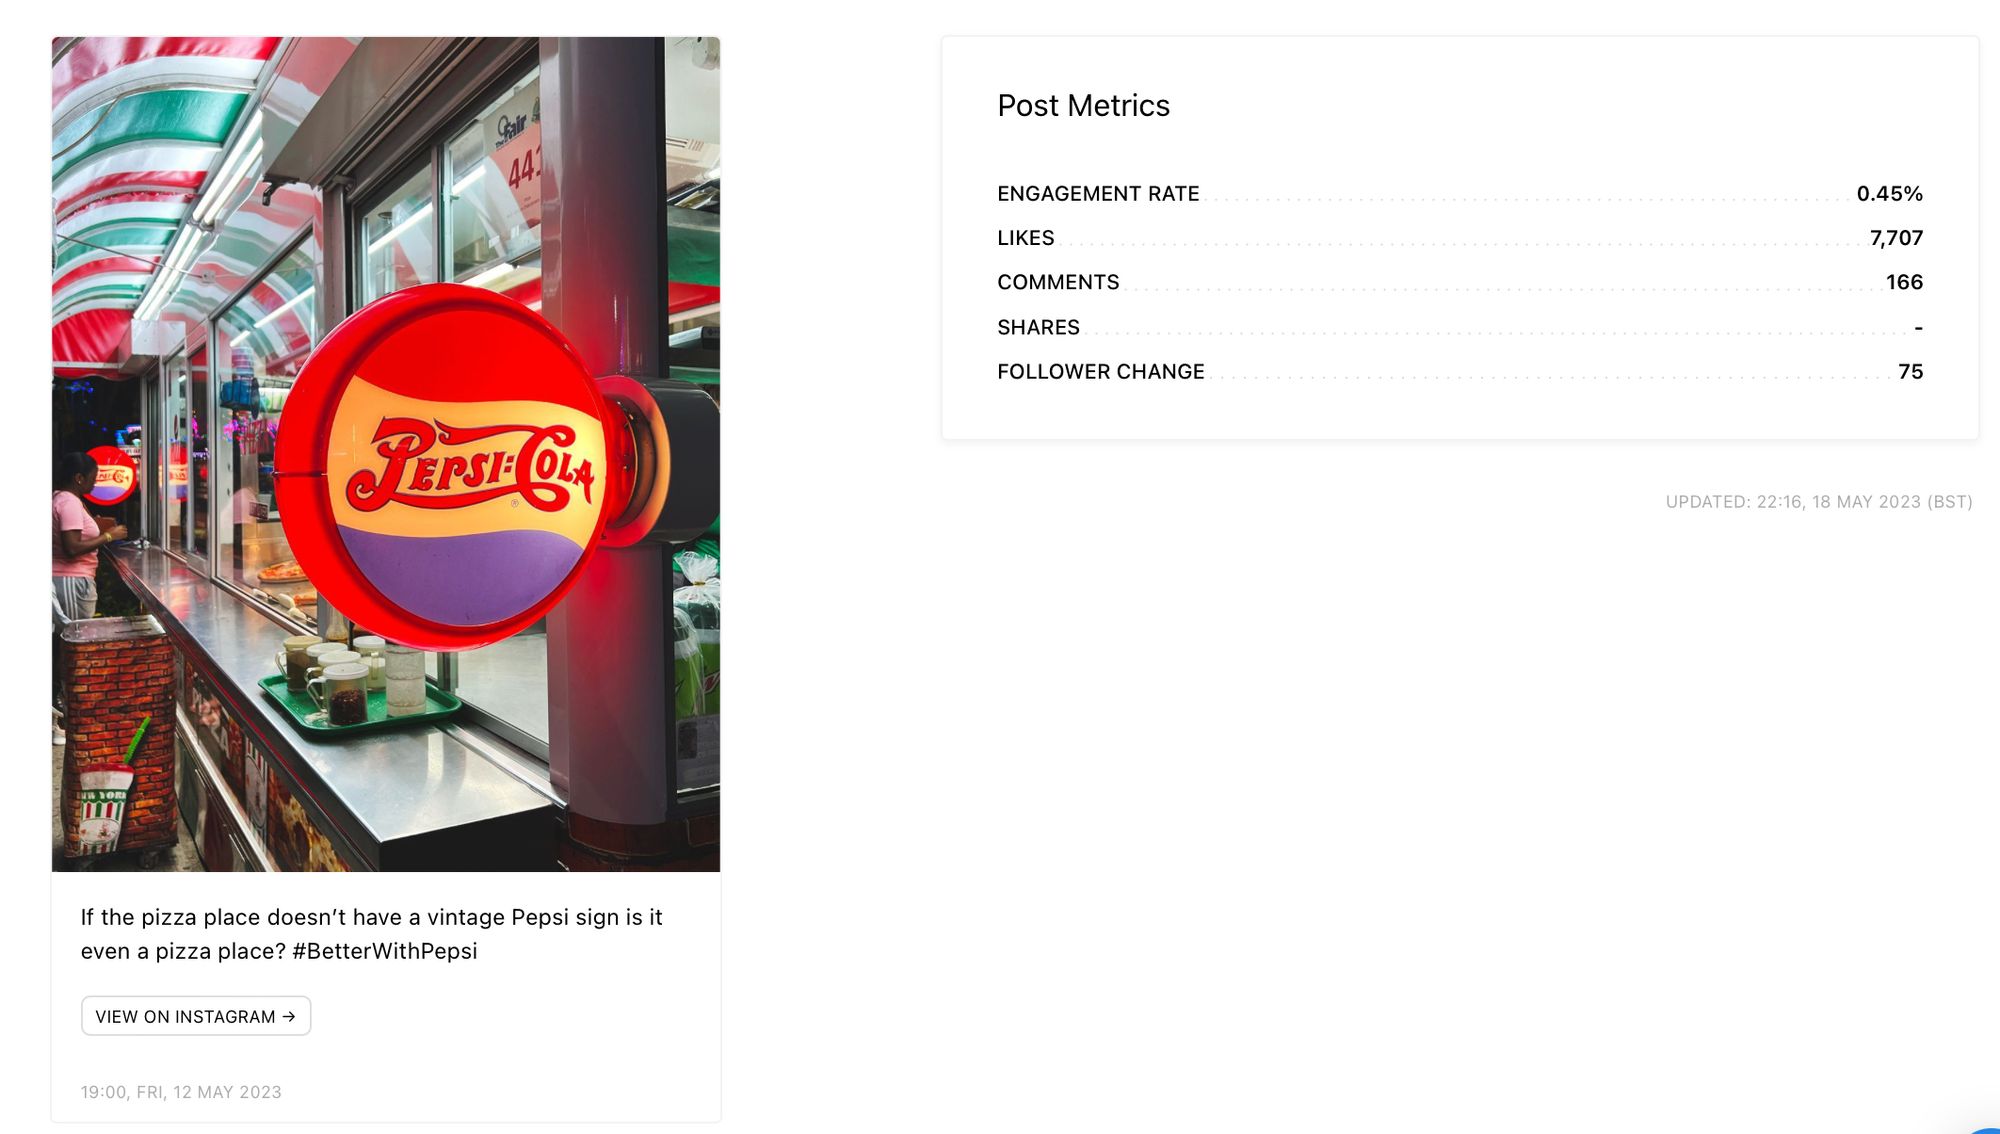
From here you can also choose to view the post on Instagram with the click of a button.
Scroll down to see data from the first 24 hours of the post’s publication. This includes likes, comments and follower change. Recently published content on Instagram is favoured by the algorithm, meaning your content is most likely to be pushed to your audience (as well as new viewers) within the first 24 hours of publication. Therefore, data gathered within this time frame is particularly important to take into consideration.
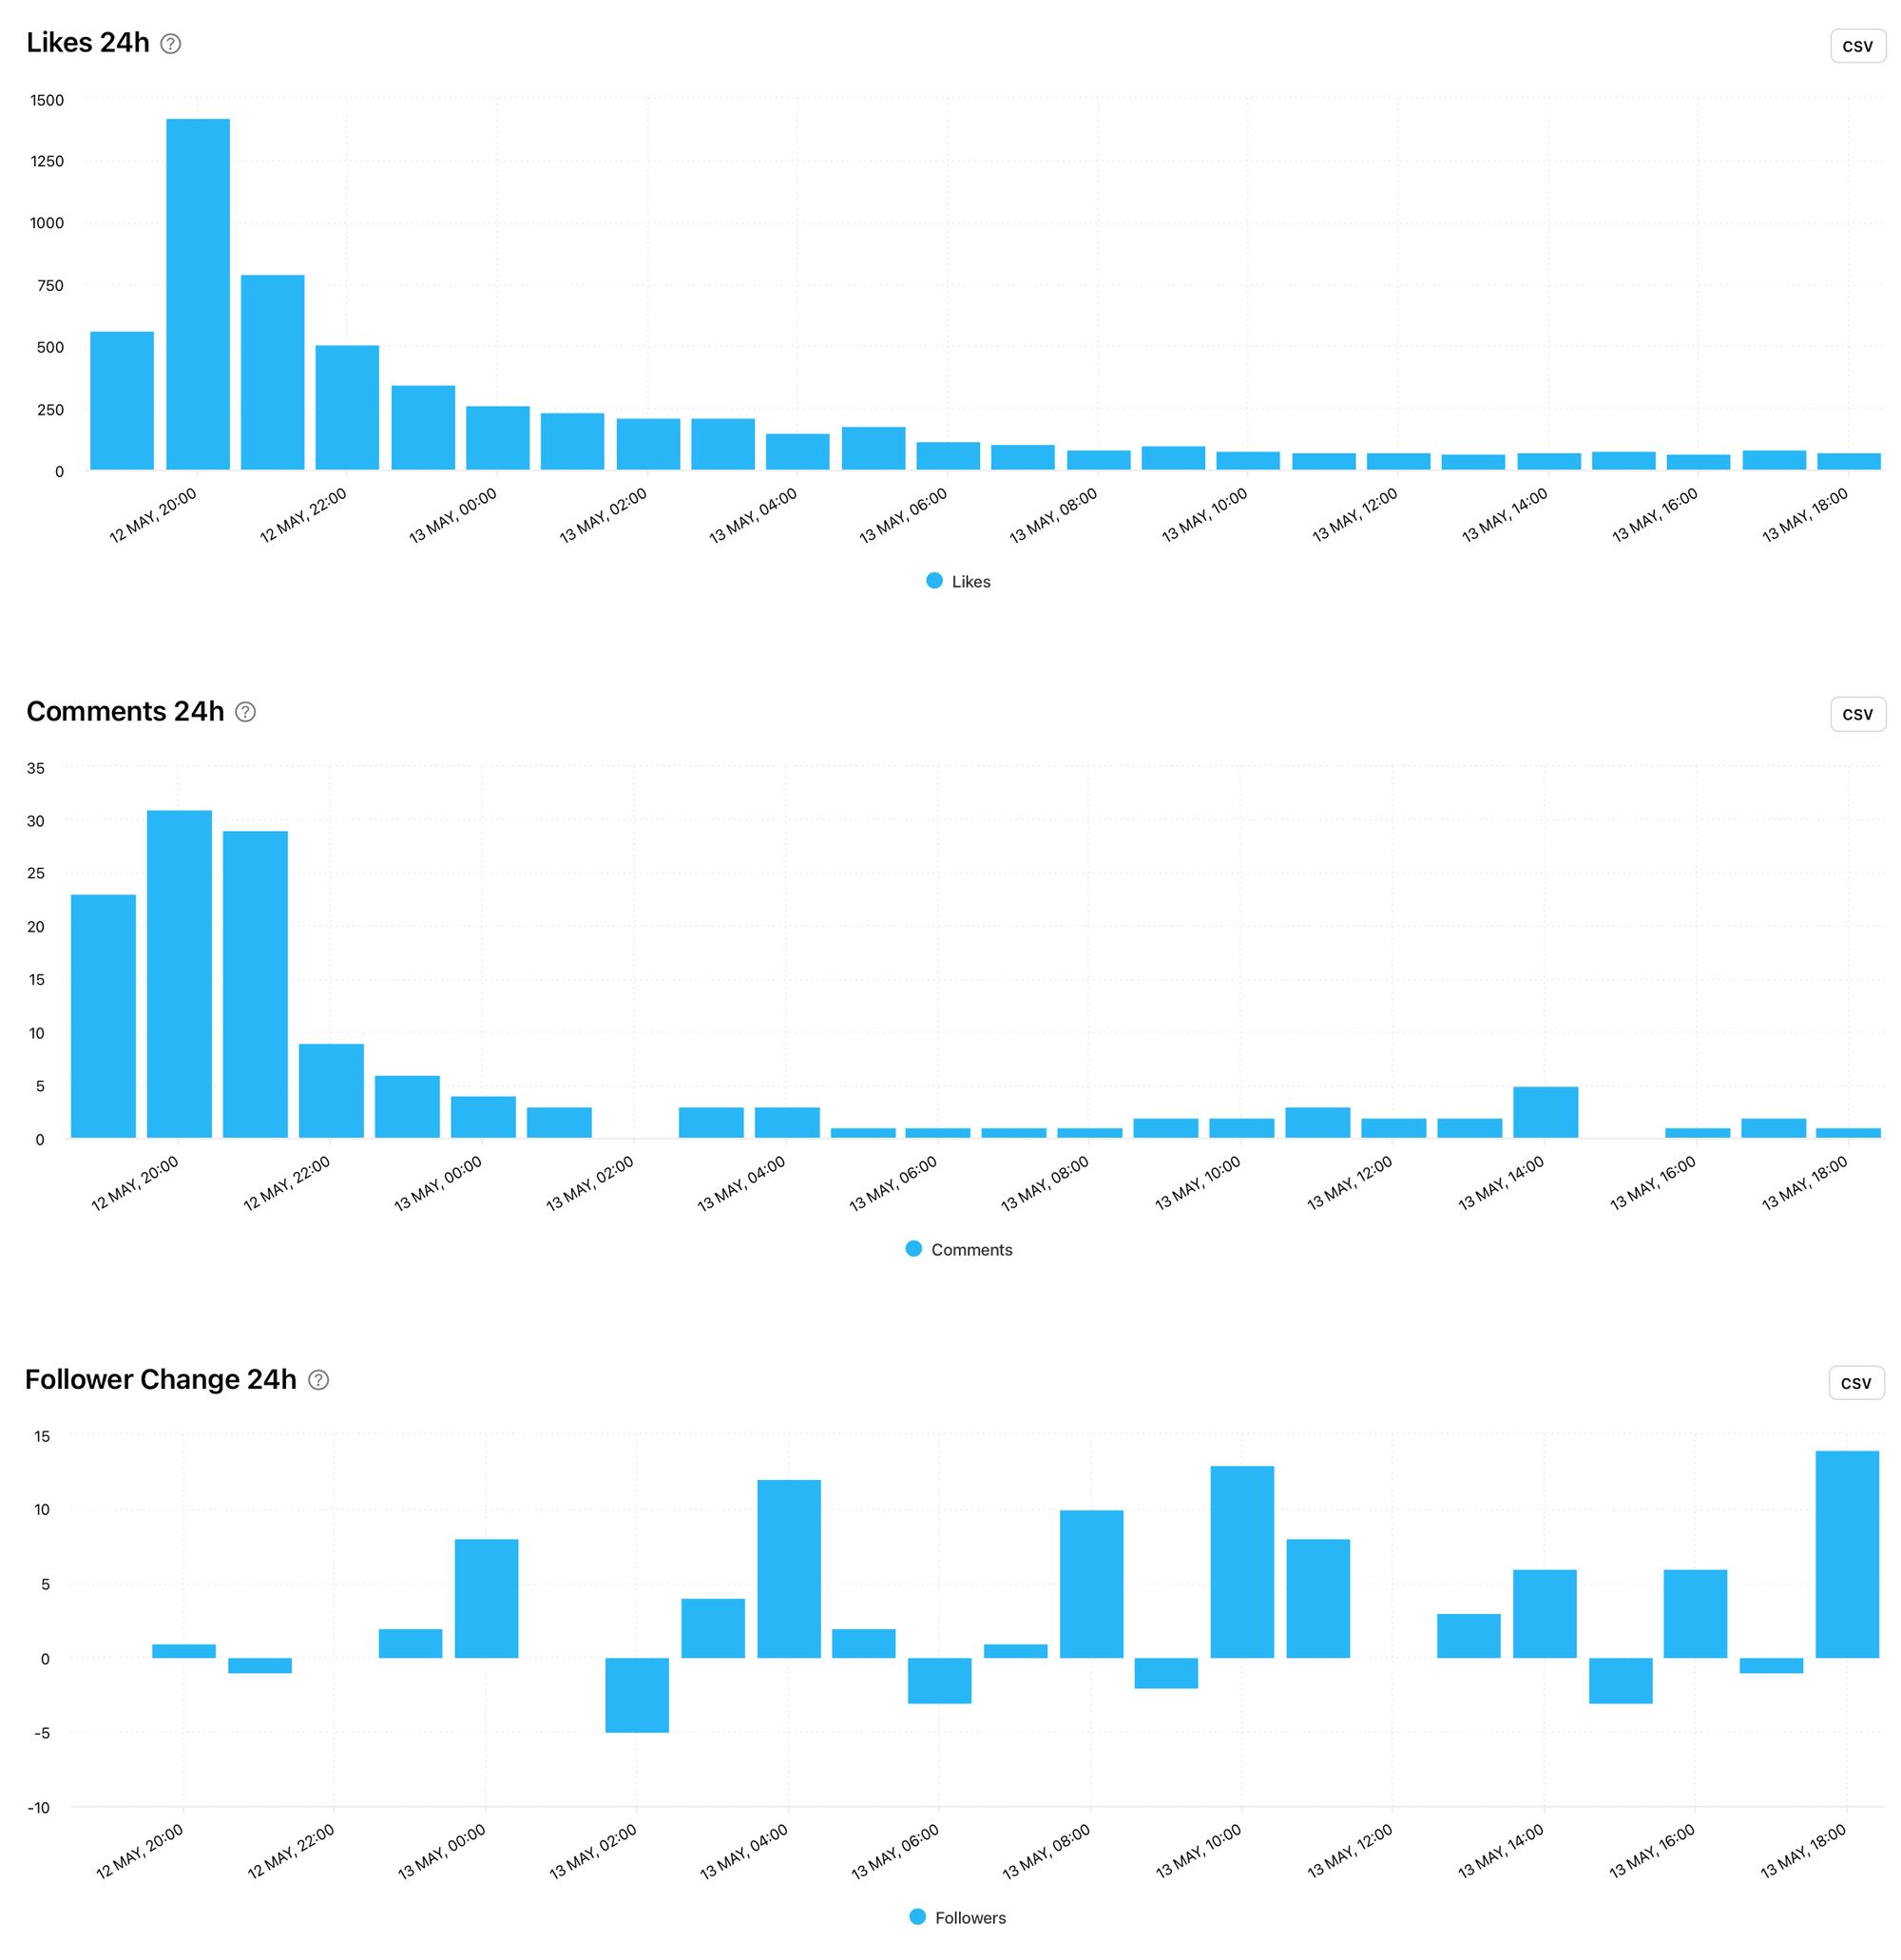
Noticing how steadily or dramatically the likes and comments decline is a good indicator of how this piece of content is being pushed to viewers. By having this data to hand, you can see how fresh content performs early on, which can give you more insight into how viewers feel about a particular piece of content. Do your 24 hour graphs look similar to your competitor’s or is there something you can learn and apply to your content to give it more life in the early stages after publication?
Optimization
Learning how your competitors could optimise their Instagram posts for greater success can give you some very helpful pointers for optimising your own posts. After all, if you’re targeting the same type of audience with the same types of products and services, it’s worth taking note of what is working well for others. This is also really helpful information if you’re currently trying to grow your audience, just starting a brand on Instagram or looking to gain more traction with future posts.
Best Time to post
The best time to post graph tracks the number of interactions on posts published at specific times of the day and on different days of the week. The darker the colour, the better the result. You could toy with timings that work for your competitors and see if they spark more interactions for your content.
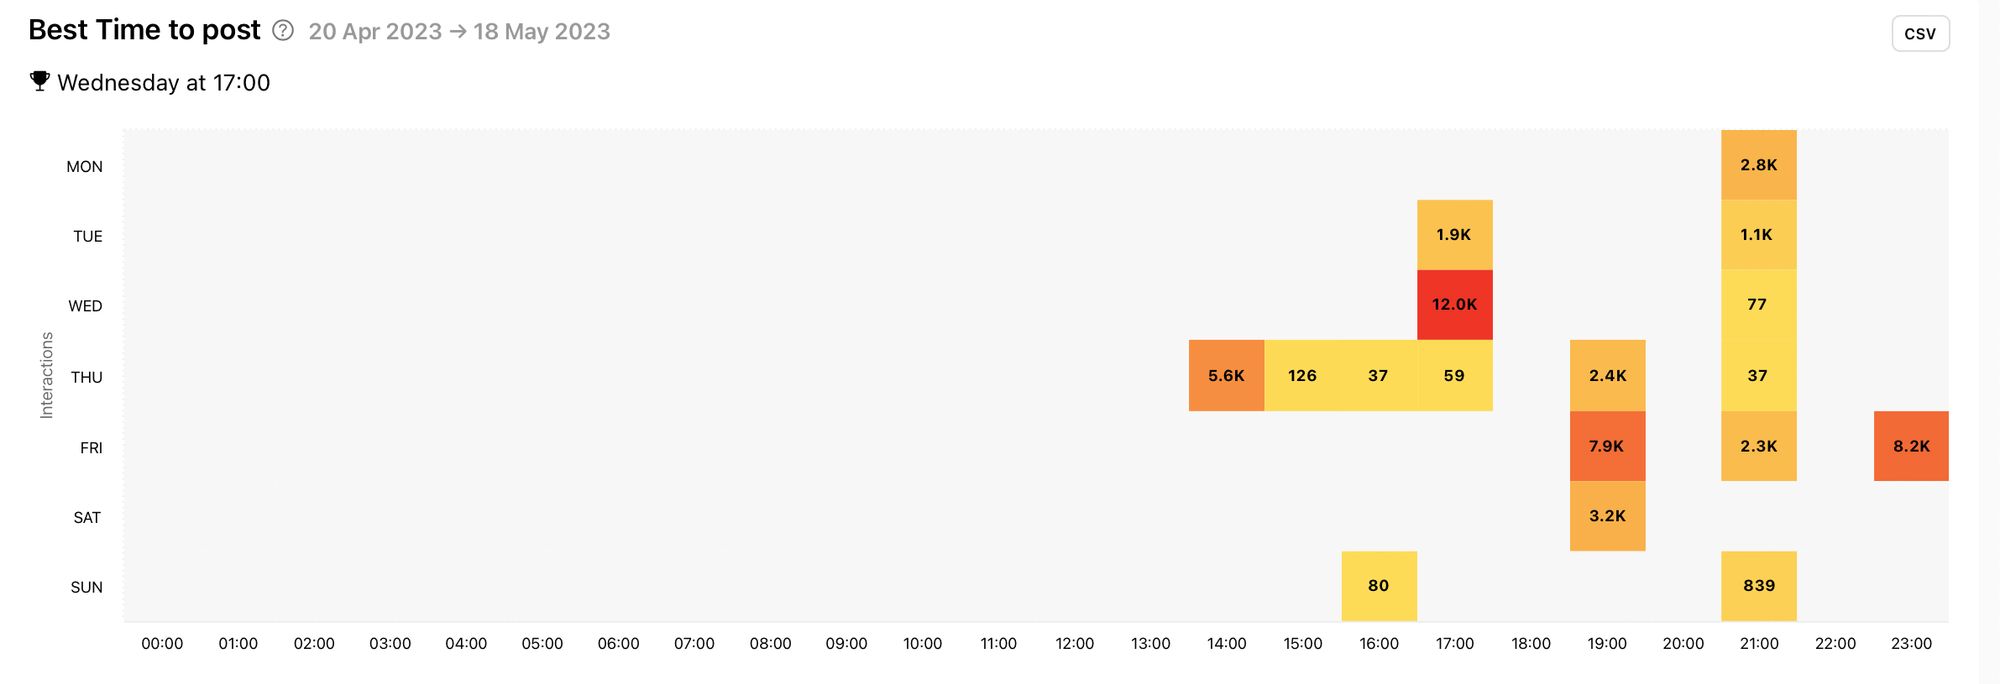
In this example, we can see that the best time to post for this competitor is Wednesday at 5pm. If this were your competitor, you might want to experiment with posting at this time and day to see if you get a higher amount of interactions on your posts.
Best Time to post, Engagement
The best time to post for engagement graph shows the engagement rate of posts published at specific times of the day and on different days of the week. In the same way as the previous graph, the darker the colour, the better the result.
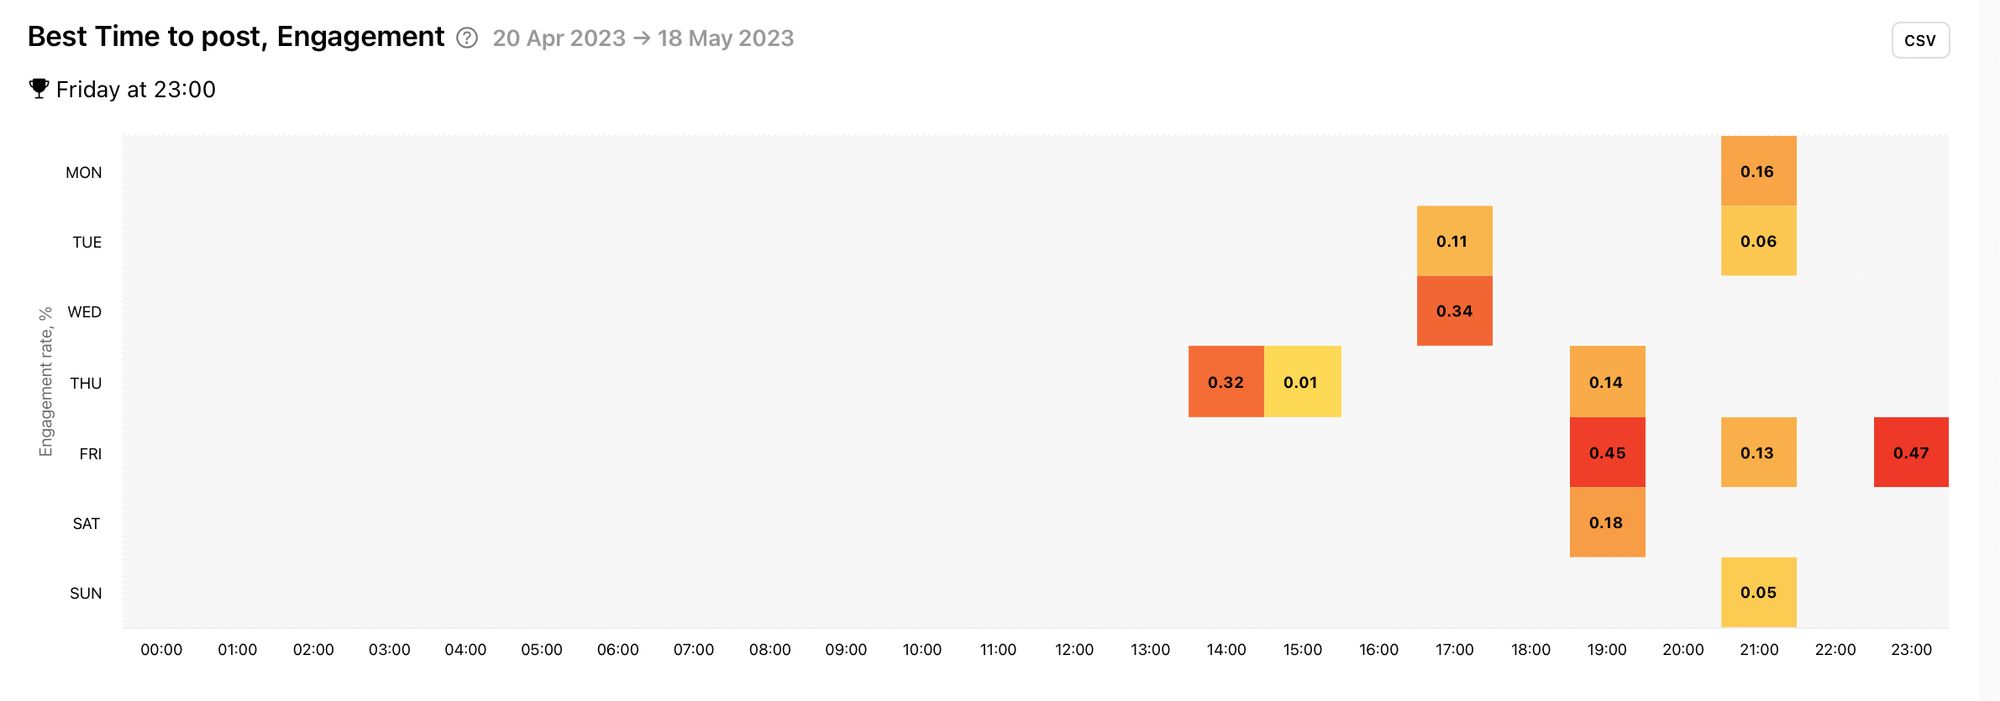
In this example, the best times to post for engagement appear to be on Friday at 7pm and 11pm. If you’re looking to boost your engagement rate, it might be a good idea to consider posting at times that gain a high engagement rate for your competitors.
Top Hashtags by Interactions
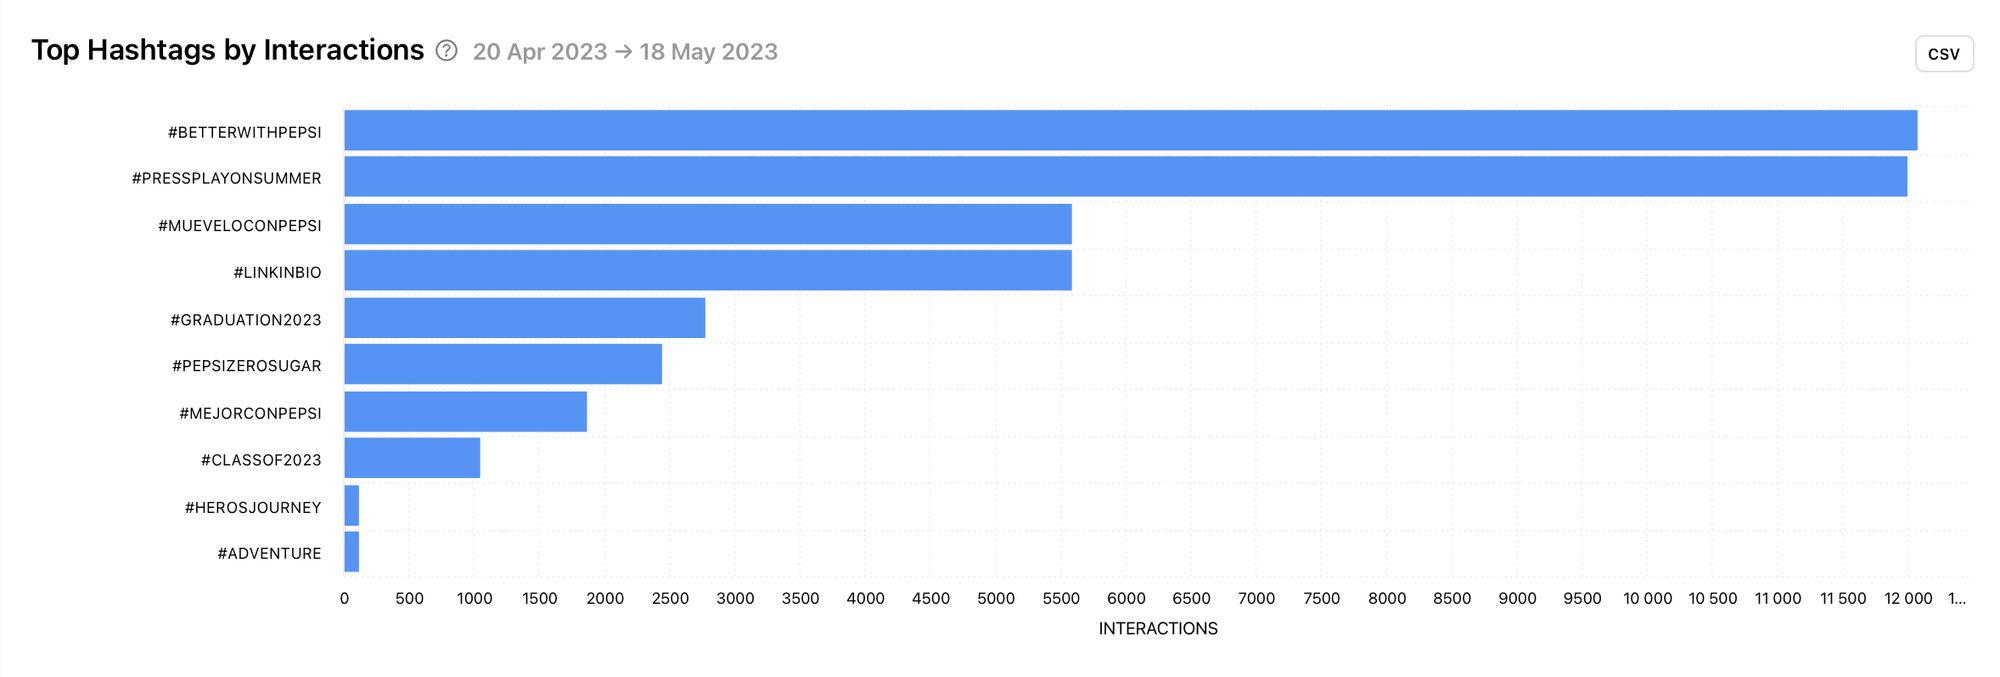
If you’re looking for better hashtags to reach more relevant people with your posts, competitor hashtag graphs will be your new favourite thing. Get inspiration based on what works for your competitors. The top hashtags by interactions graph shows the hashtags on posts that got the highest total amount of interaction on them.
Most Effective Hashtags
Finding effective hashtags just got easier with the most effective hashtags graph. This shows the top hashtags by the average amount of interaction.
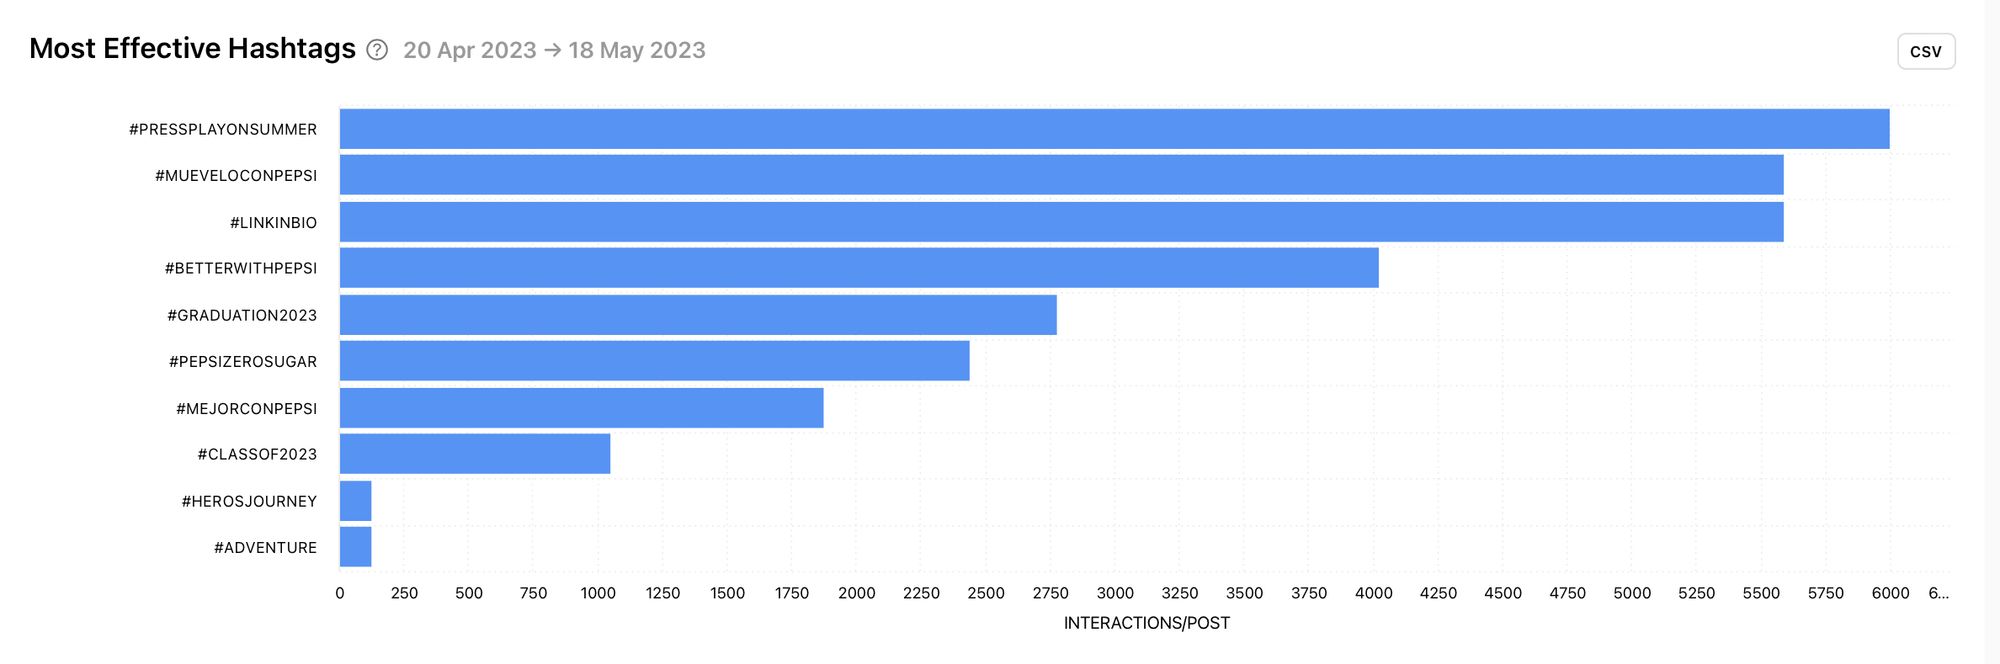
You might have to avoid brand-specific hashtags that are unique to your competitor, but notice how well these brand-specific hashtags are doing for this brand. Is this something you could add to your content strategy? Perhaps a hashtag campaign would go down a treat!
Benchmarks
See how your competitors measure up against other accounts of a similar size to them. If they benchmark in the median and upper portion of the graph, take note and use this info to try to gain similar traction in these areas.
When looking at benchmarks for competitors, you’re looking beyond a singular business and into where this competitor ranks among similar size brands. This can give you a better idea of how well your competitor is performing while you can consider where you are in relation to your competitor.
It’s worth checking out a competitor in a similar cohort to you if you want to compare where you are in relation to where your competitor is within a particular benchmark. You can see the cohort size in the top right-hand corner of the benchmarks page.
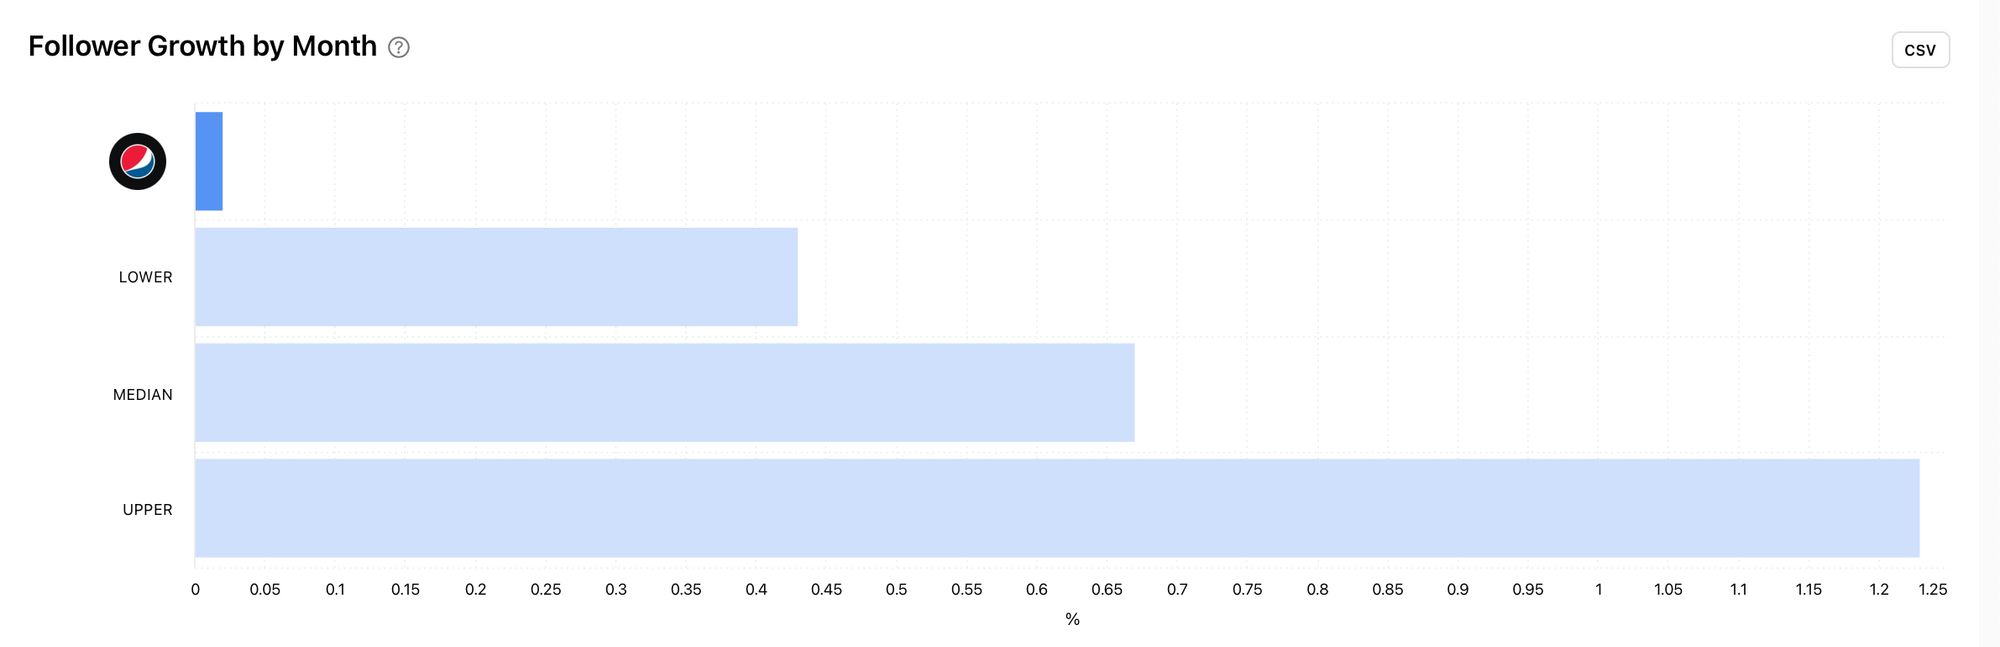
Follower Growth by Month
The follower growth by month graph shows the average follower growth compared with other brands of a similar size. Is the brand growing at a lower, similar or higher rate than others? If it’s rocketing then taking note of the content they’re publishing, alongside their general approach to their social media account, could help you figure out how to grow faster yourself.
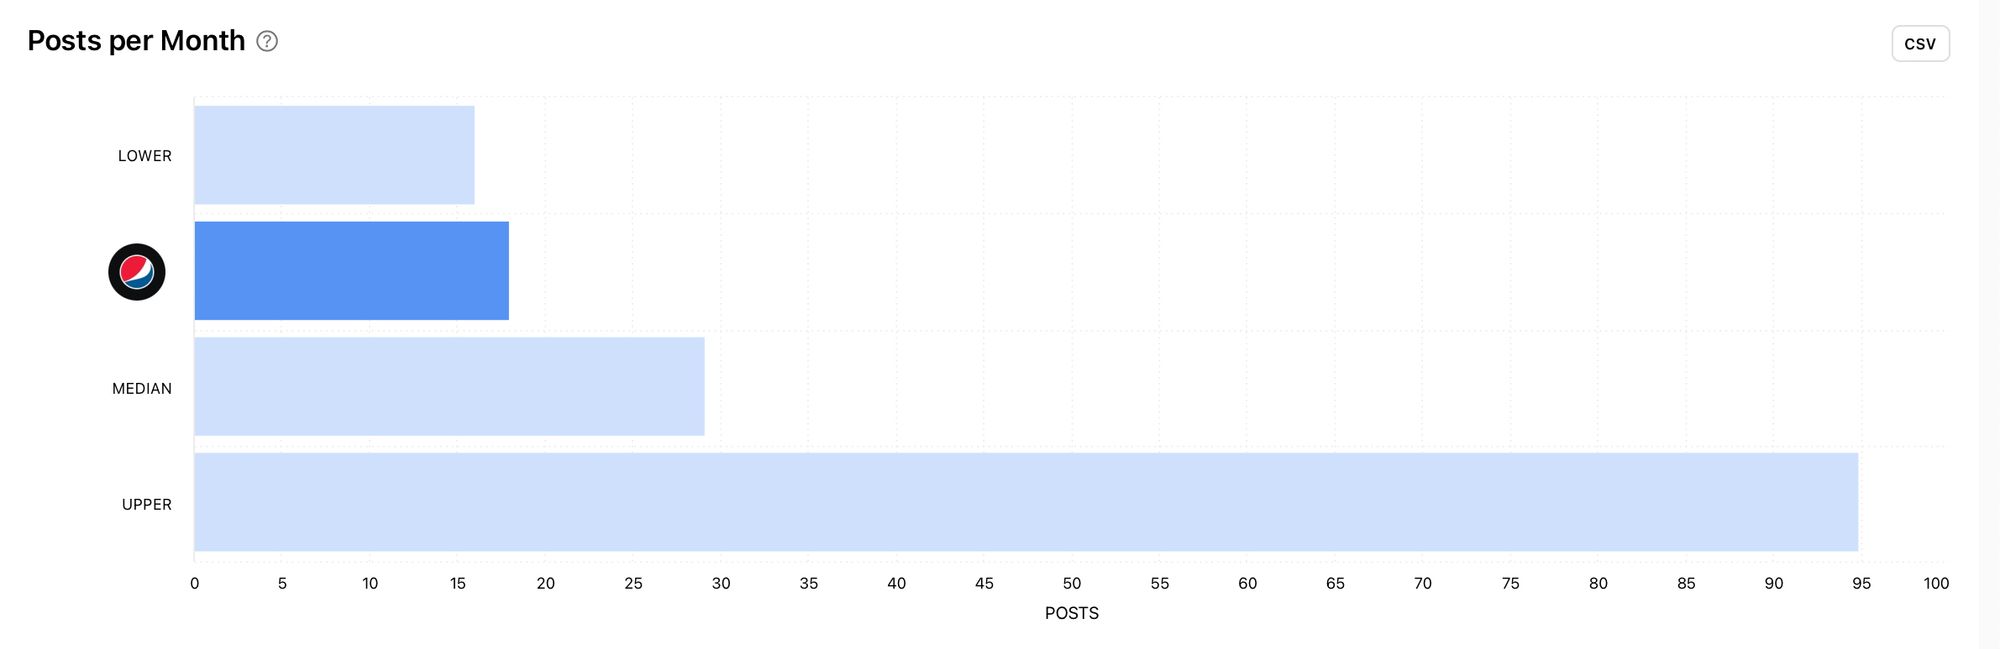
Posts per Month
Check out the average number of posts your competitor is publishing per month. Does your upload schedule look similar or are they posting significantly less or more? How is this reflected in their post engagement and profile growth?
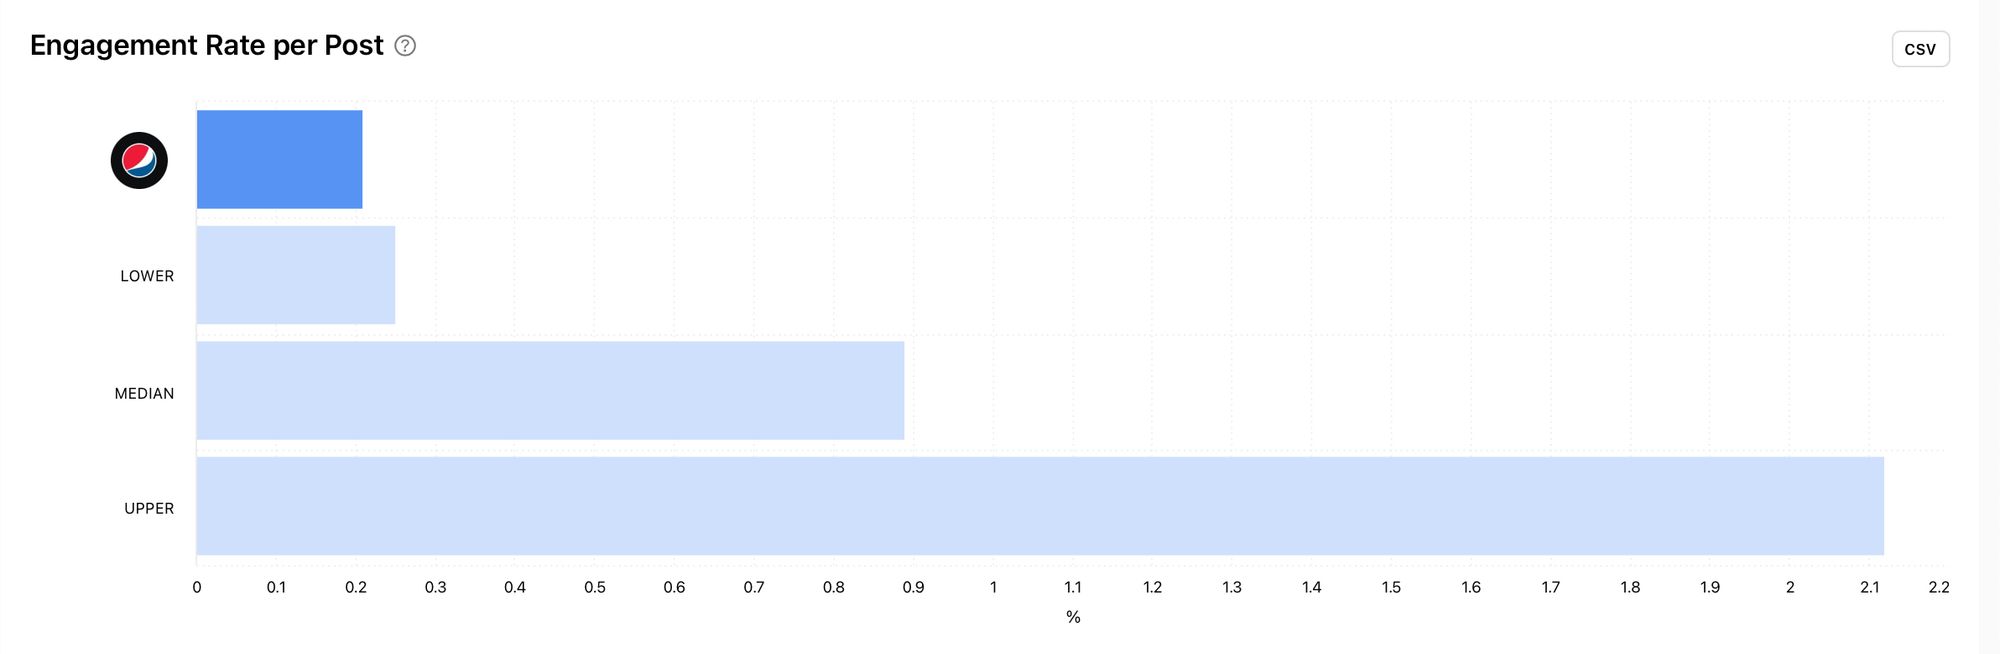
Engagement Rate per Post
Look at the average engagement rate per post for your competitor within a cohort. Is it higher, average or lower than brands of a similar size? Why do you think this is? If your competitor sits at the lower end of a benchmark, this is an area worth focusing on because it might suggest there's an opportunity for you to shine.
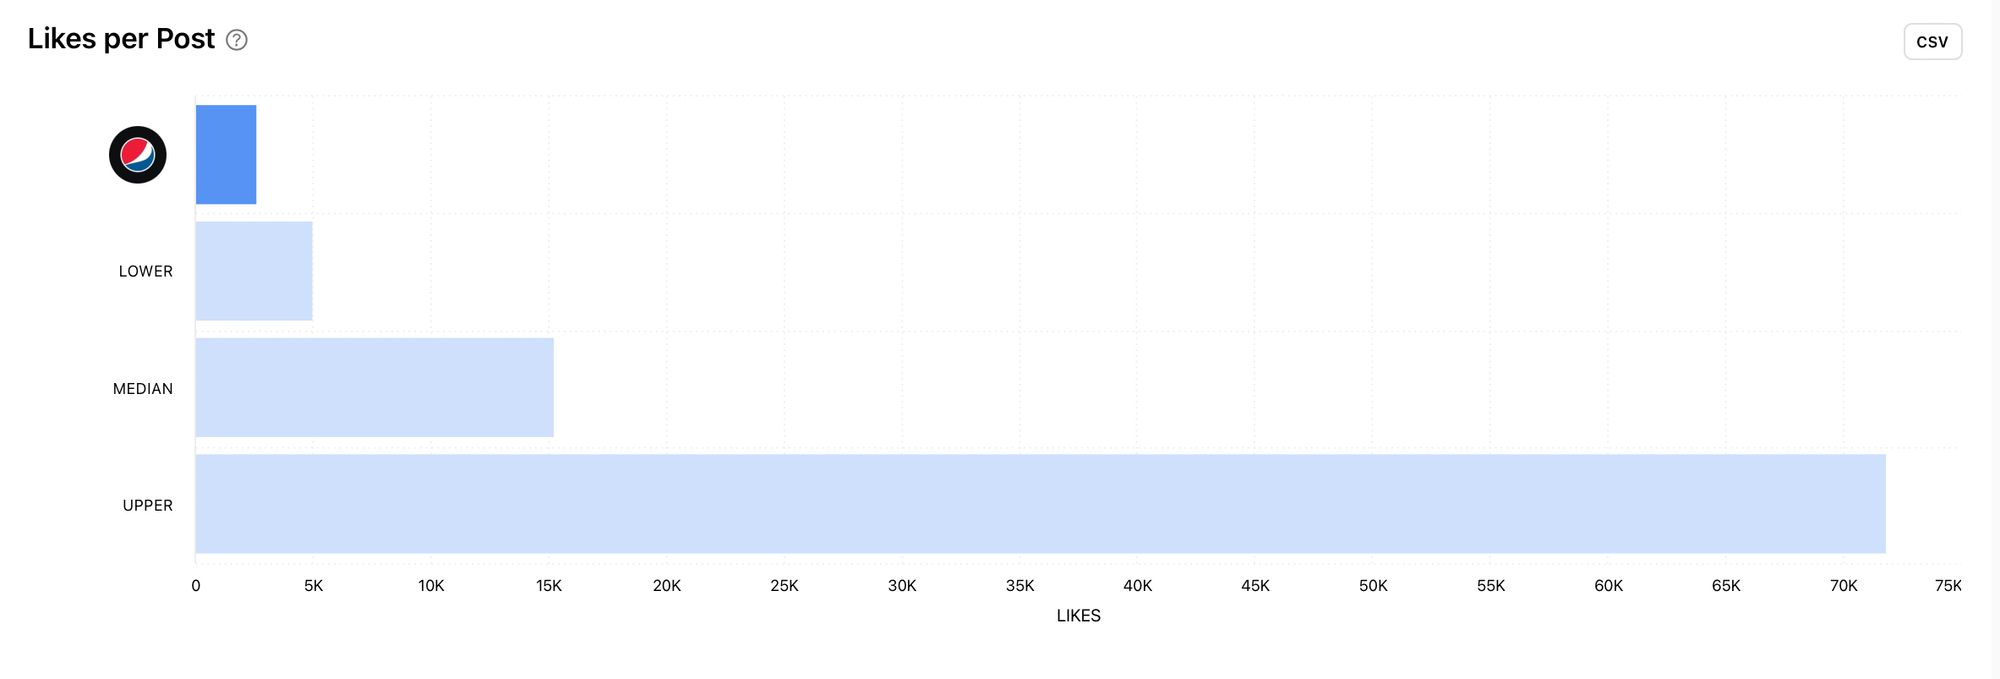
Likes per Post
The average amount of likes on a post gives you an indicator of how much positive interaction your competitor gets on their posts when compared with other brands. Whether it’s higher, median or lower, this can be an indication of the way the competitor’s audience views posts from this brand.
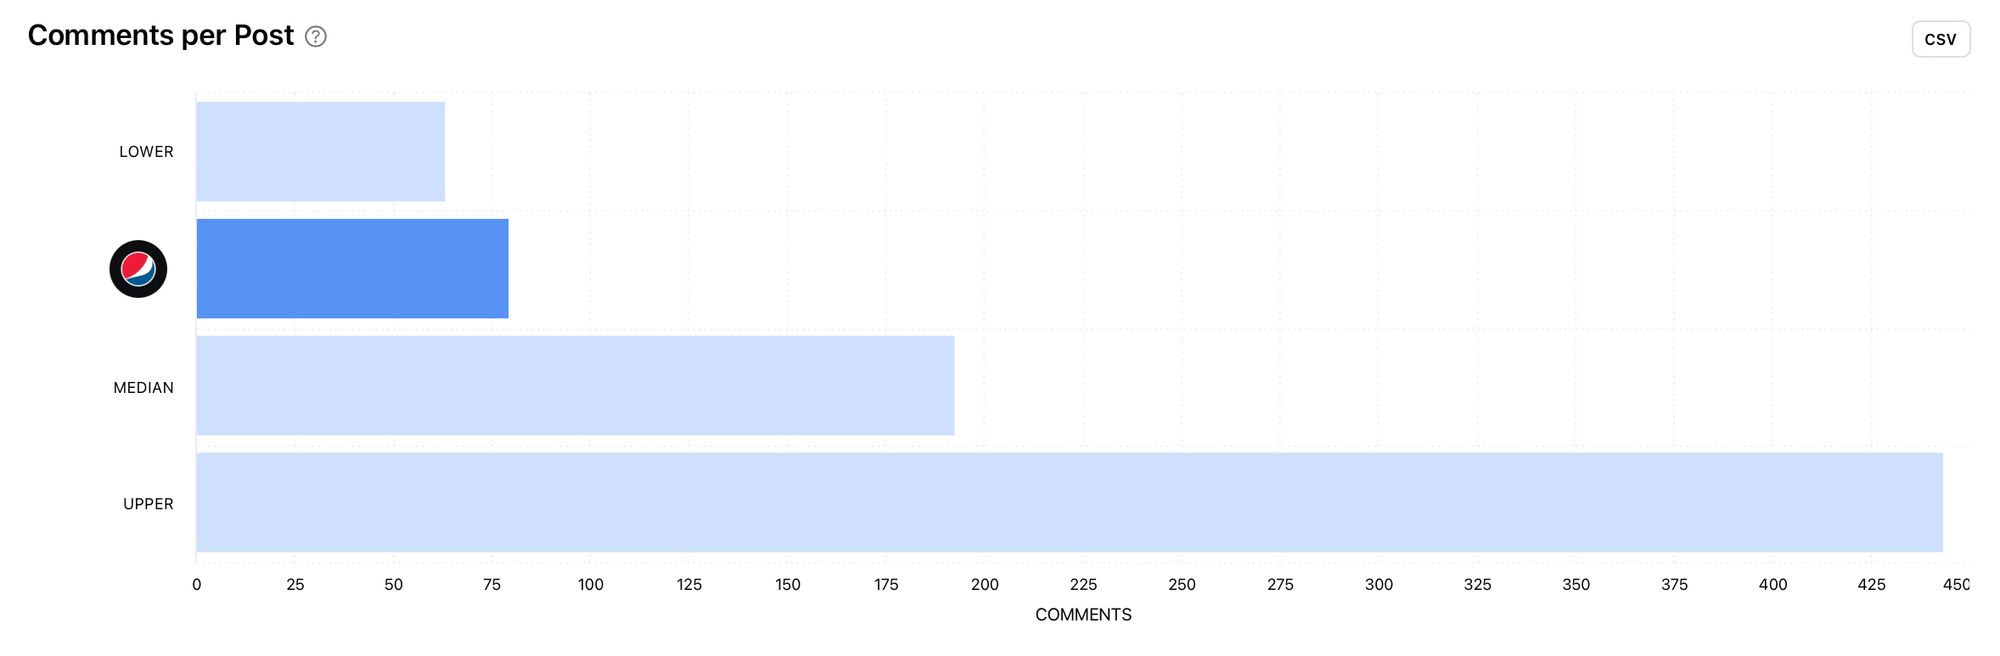
Comments per Post
The average number of comments on a post is a good indicator of how engaging your competitor’s posts are. Remember that comments aren’t always positive so take this into account if your competitor ranks lower for likes and higher for comments.
Unlock competitor insights for Instagram
Accessing competitor accounts with Minter.io is simple.
Here’s how:
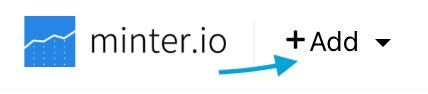
- Go to the top left-hand corner of your Minter.io account and select the ‘+Add’ button.
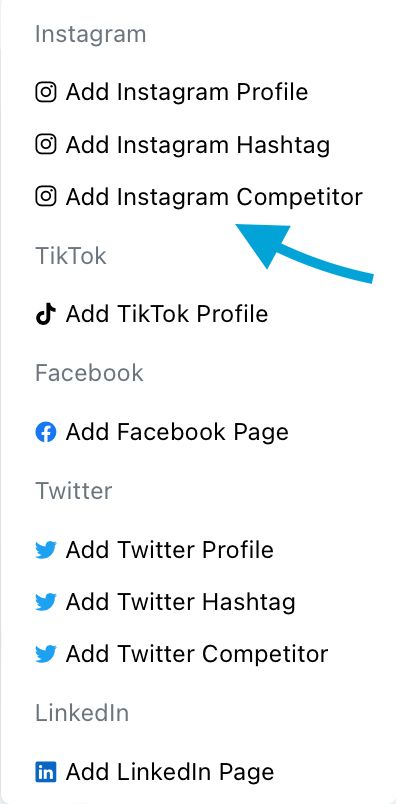
2. Click on ‘Add Instagram Competitor.
3. Insert the username of the Business or Creator Instagram account.
4. Click ‘Add’.
Competitor analytics are available on Platinum and Agency plans. Get access to full historical data for your competitor's posts from the day you sign up to Minter.io while follower growth data is only available from the day you start tracking the competitor account. Learn more here.
Try Minter.io now→