


Group reports combine several social profiles, so you can see followers, growth, posts, engagements and views across your social networks in one place. Track your brand’s overall performance, compare profiles and see how each social network and brand account contributes to your results.
In Minter.io, a group can include any mix of Instagram, TikTok, Facebook, X, LinkedIn and Threads profiles, including several profiles on the same network.
To organise your profiles into groups, see How to manage groups in Minter.io.
How to view a group report
Go to your Minter.io home page.
Find the group you want to report on. The group header shows its total followers and overall engagement rate.
Click View group report next to the group name.
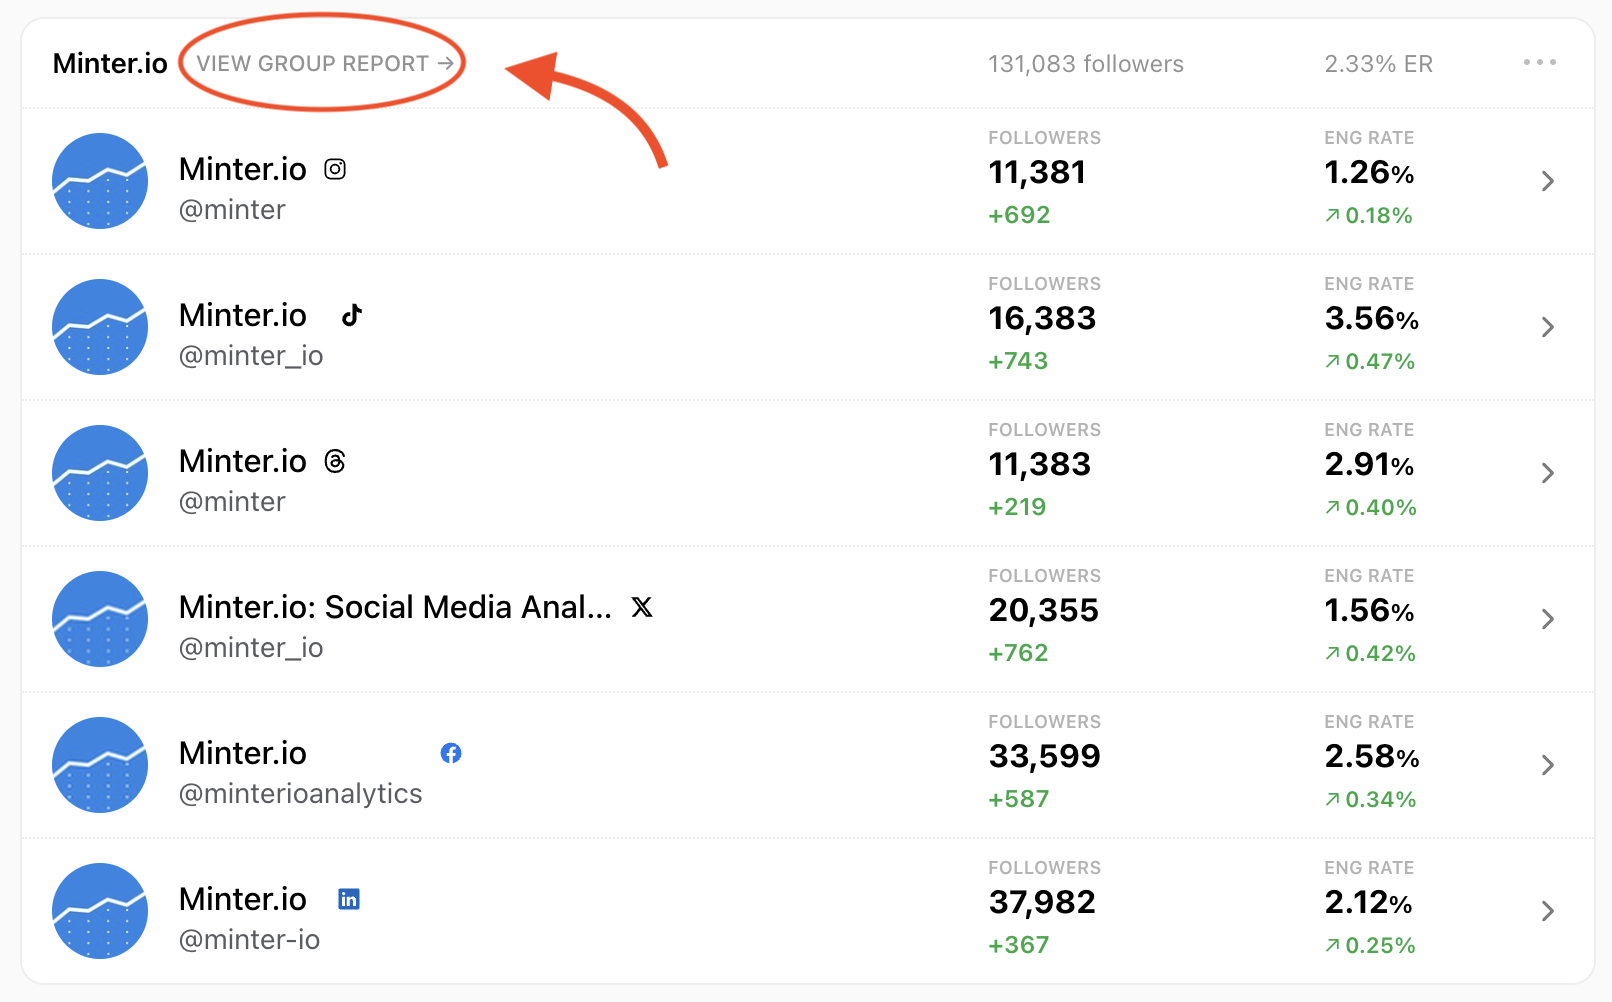
Each group report has three sections: Overview, Profiles and Posts.
Overview
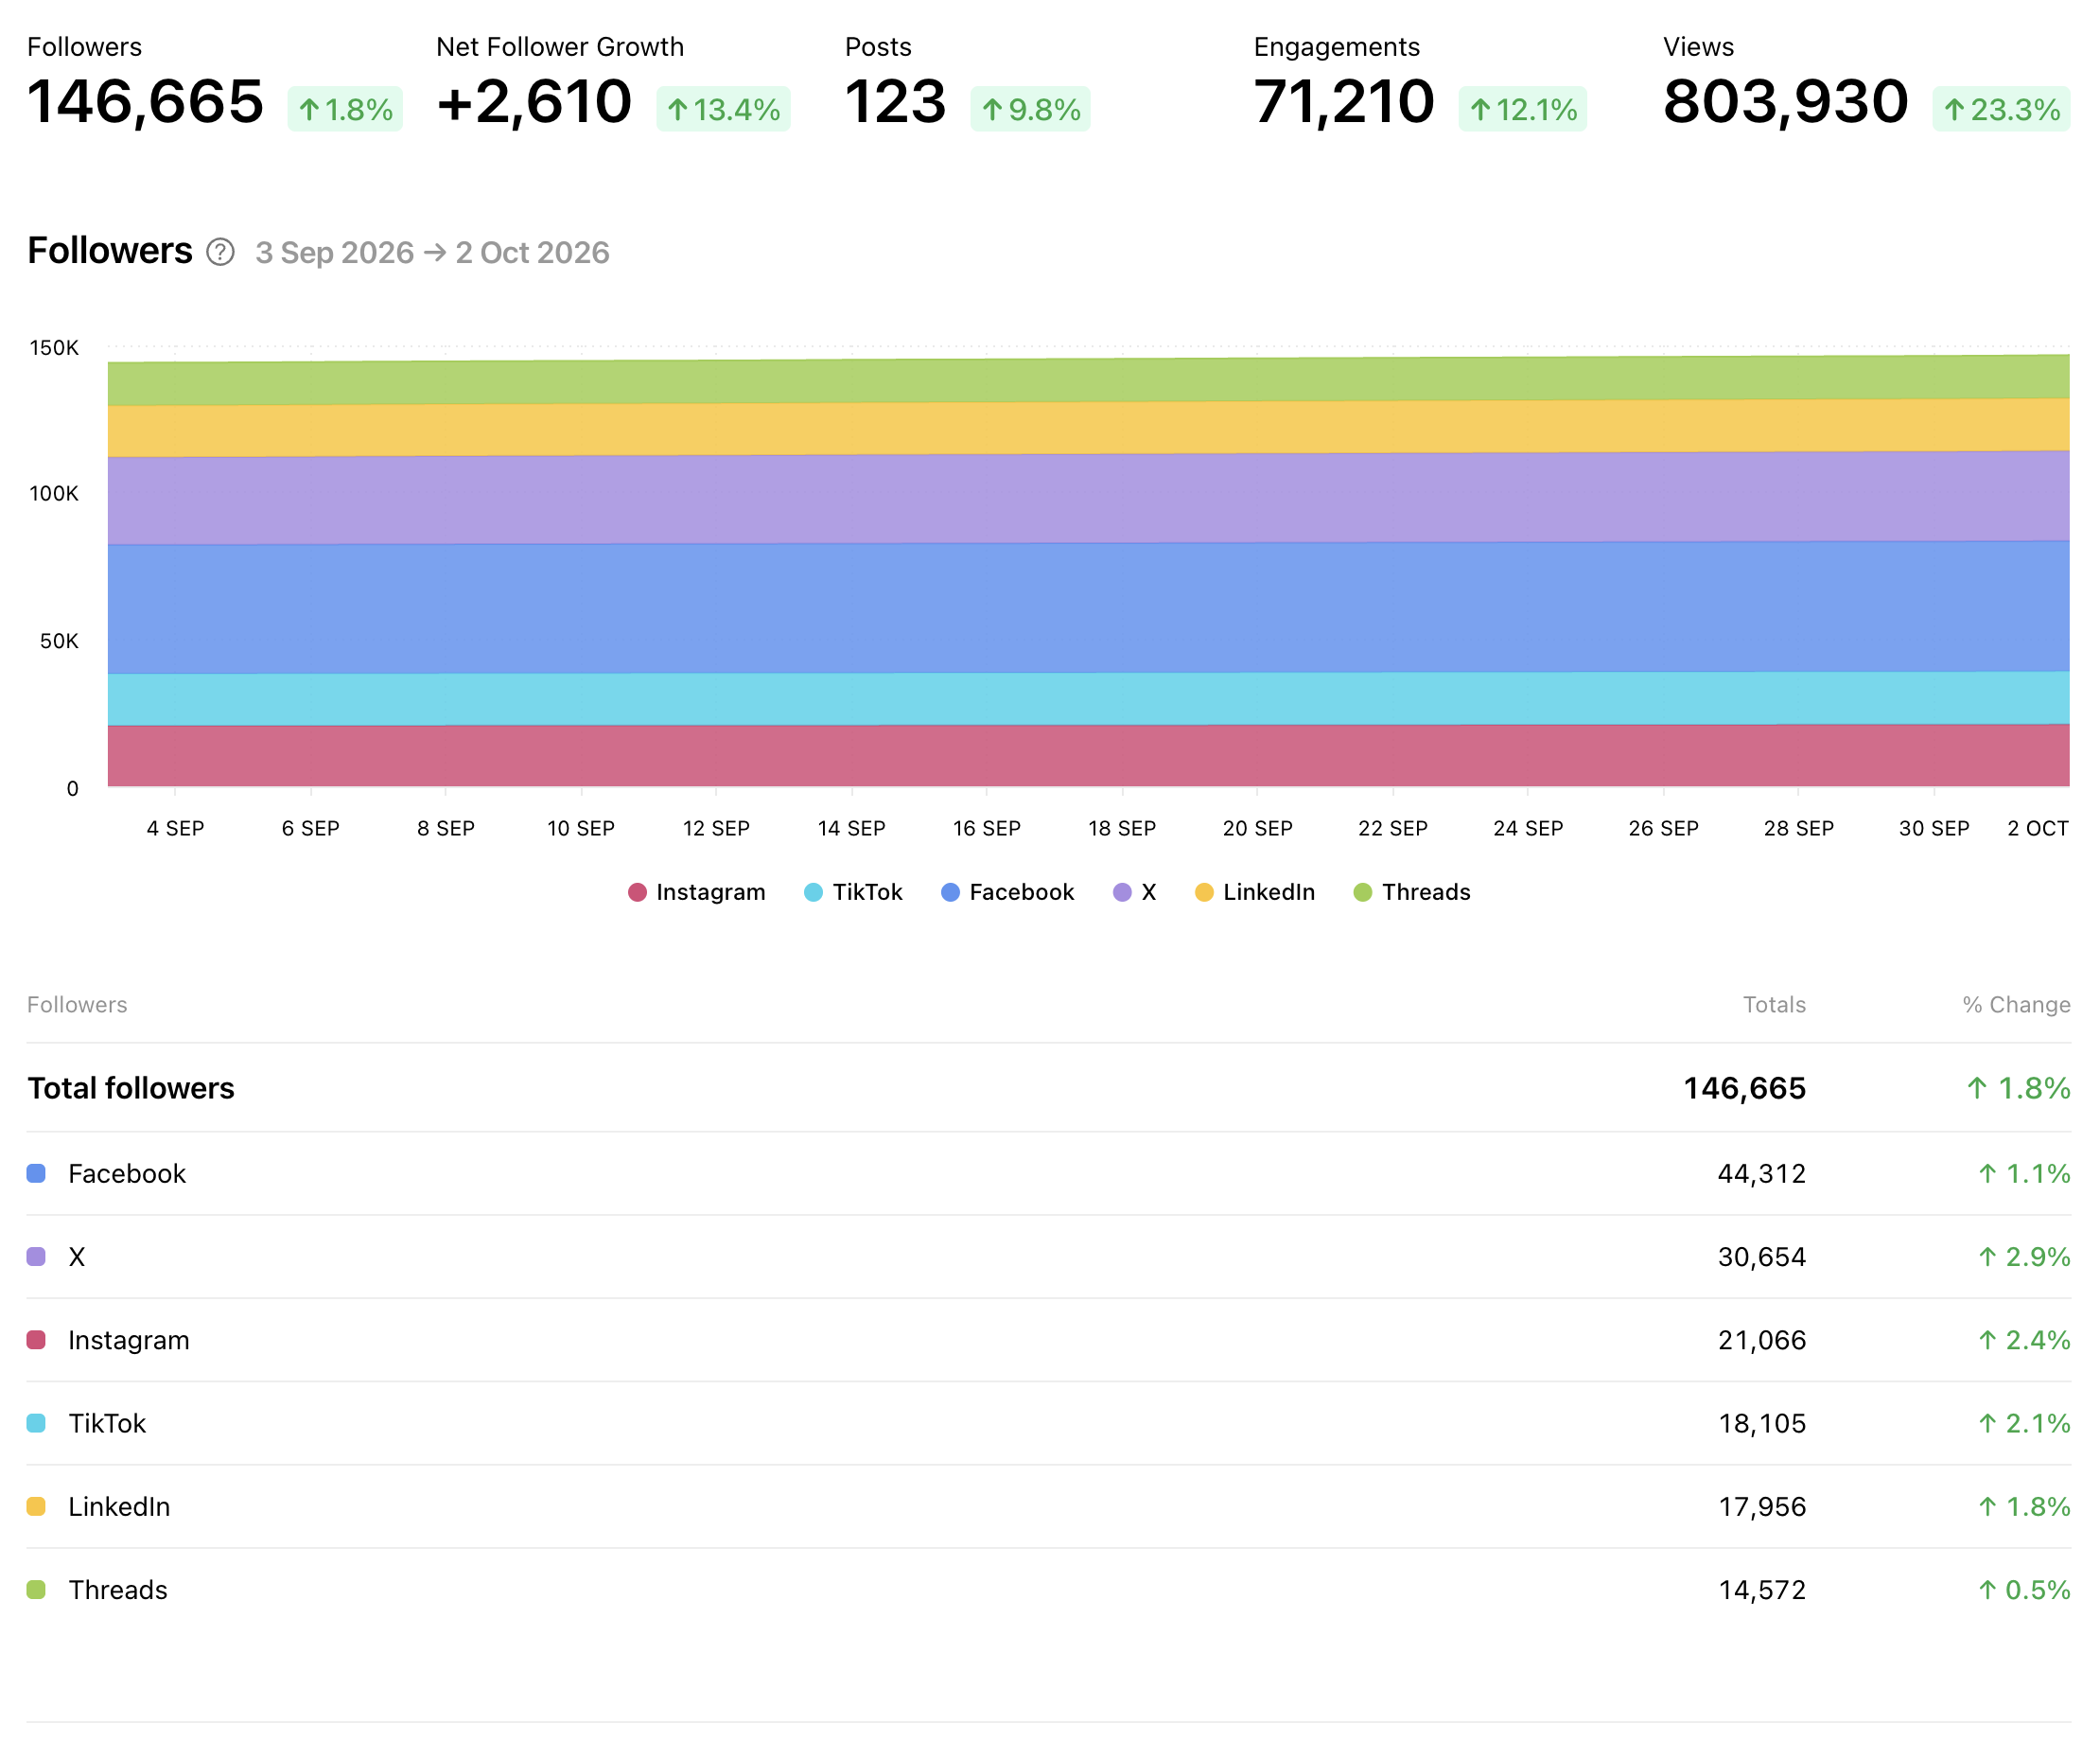
The Overview shows key metrics for the whole group, including followers, net follower growth, posts, engagements and views. The % change next to each figure compares the selected period with the previous period of the same length.
Switch between network and profile breakdowns
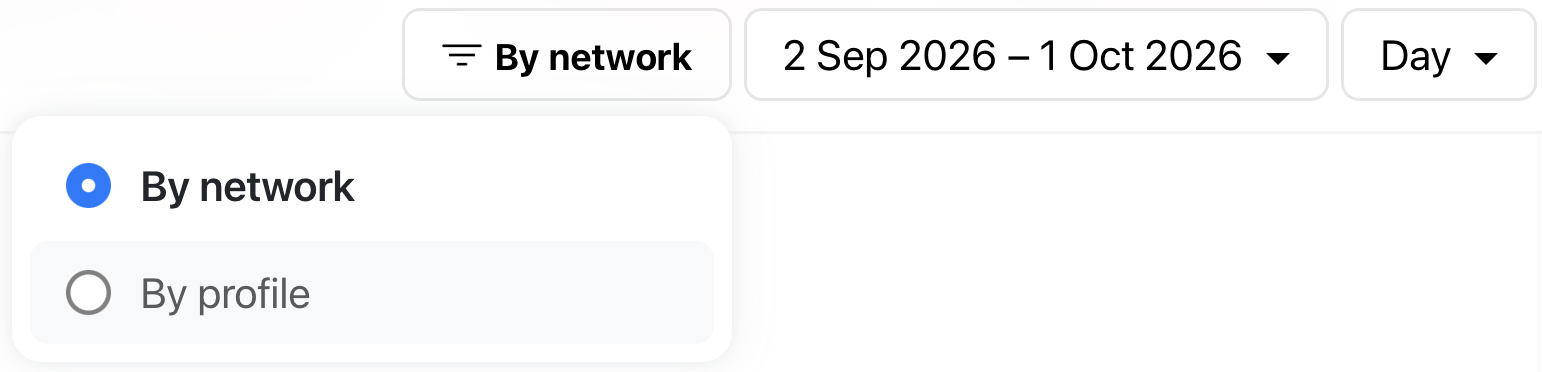
You can see results combined by network or broken down by profile. Use the dropdown at the top of the Overview report to choose how your results are grouped:
By network combines profiles from the same social network. Use this view to compare channels, such as Instagram and TikTok, and see their contribution to your overall results.
By profile shows each account separately. Use this view to compare individual profiles, including if a group has more than one profile on the same network.
Followers
Shows total audience across the group over the selected period. Each colour represents a network or profile, depending on your selected breakdown.
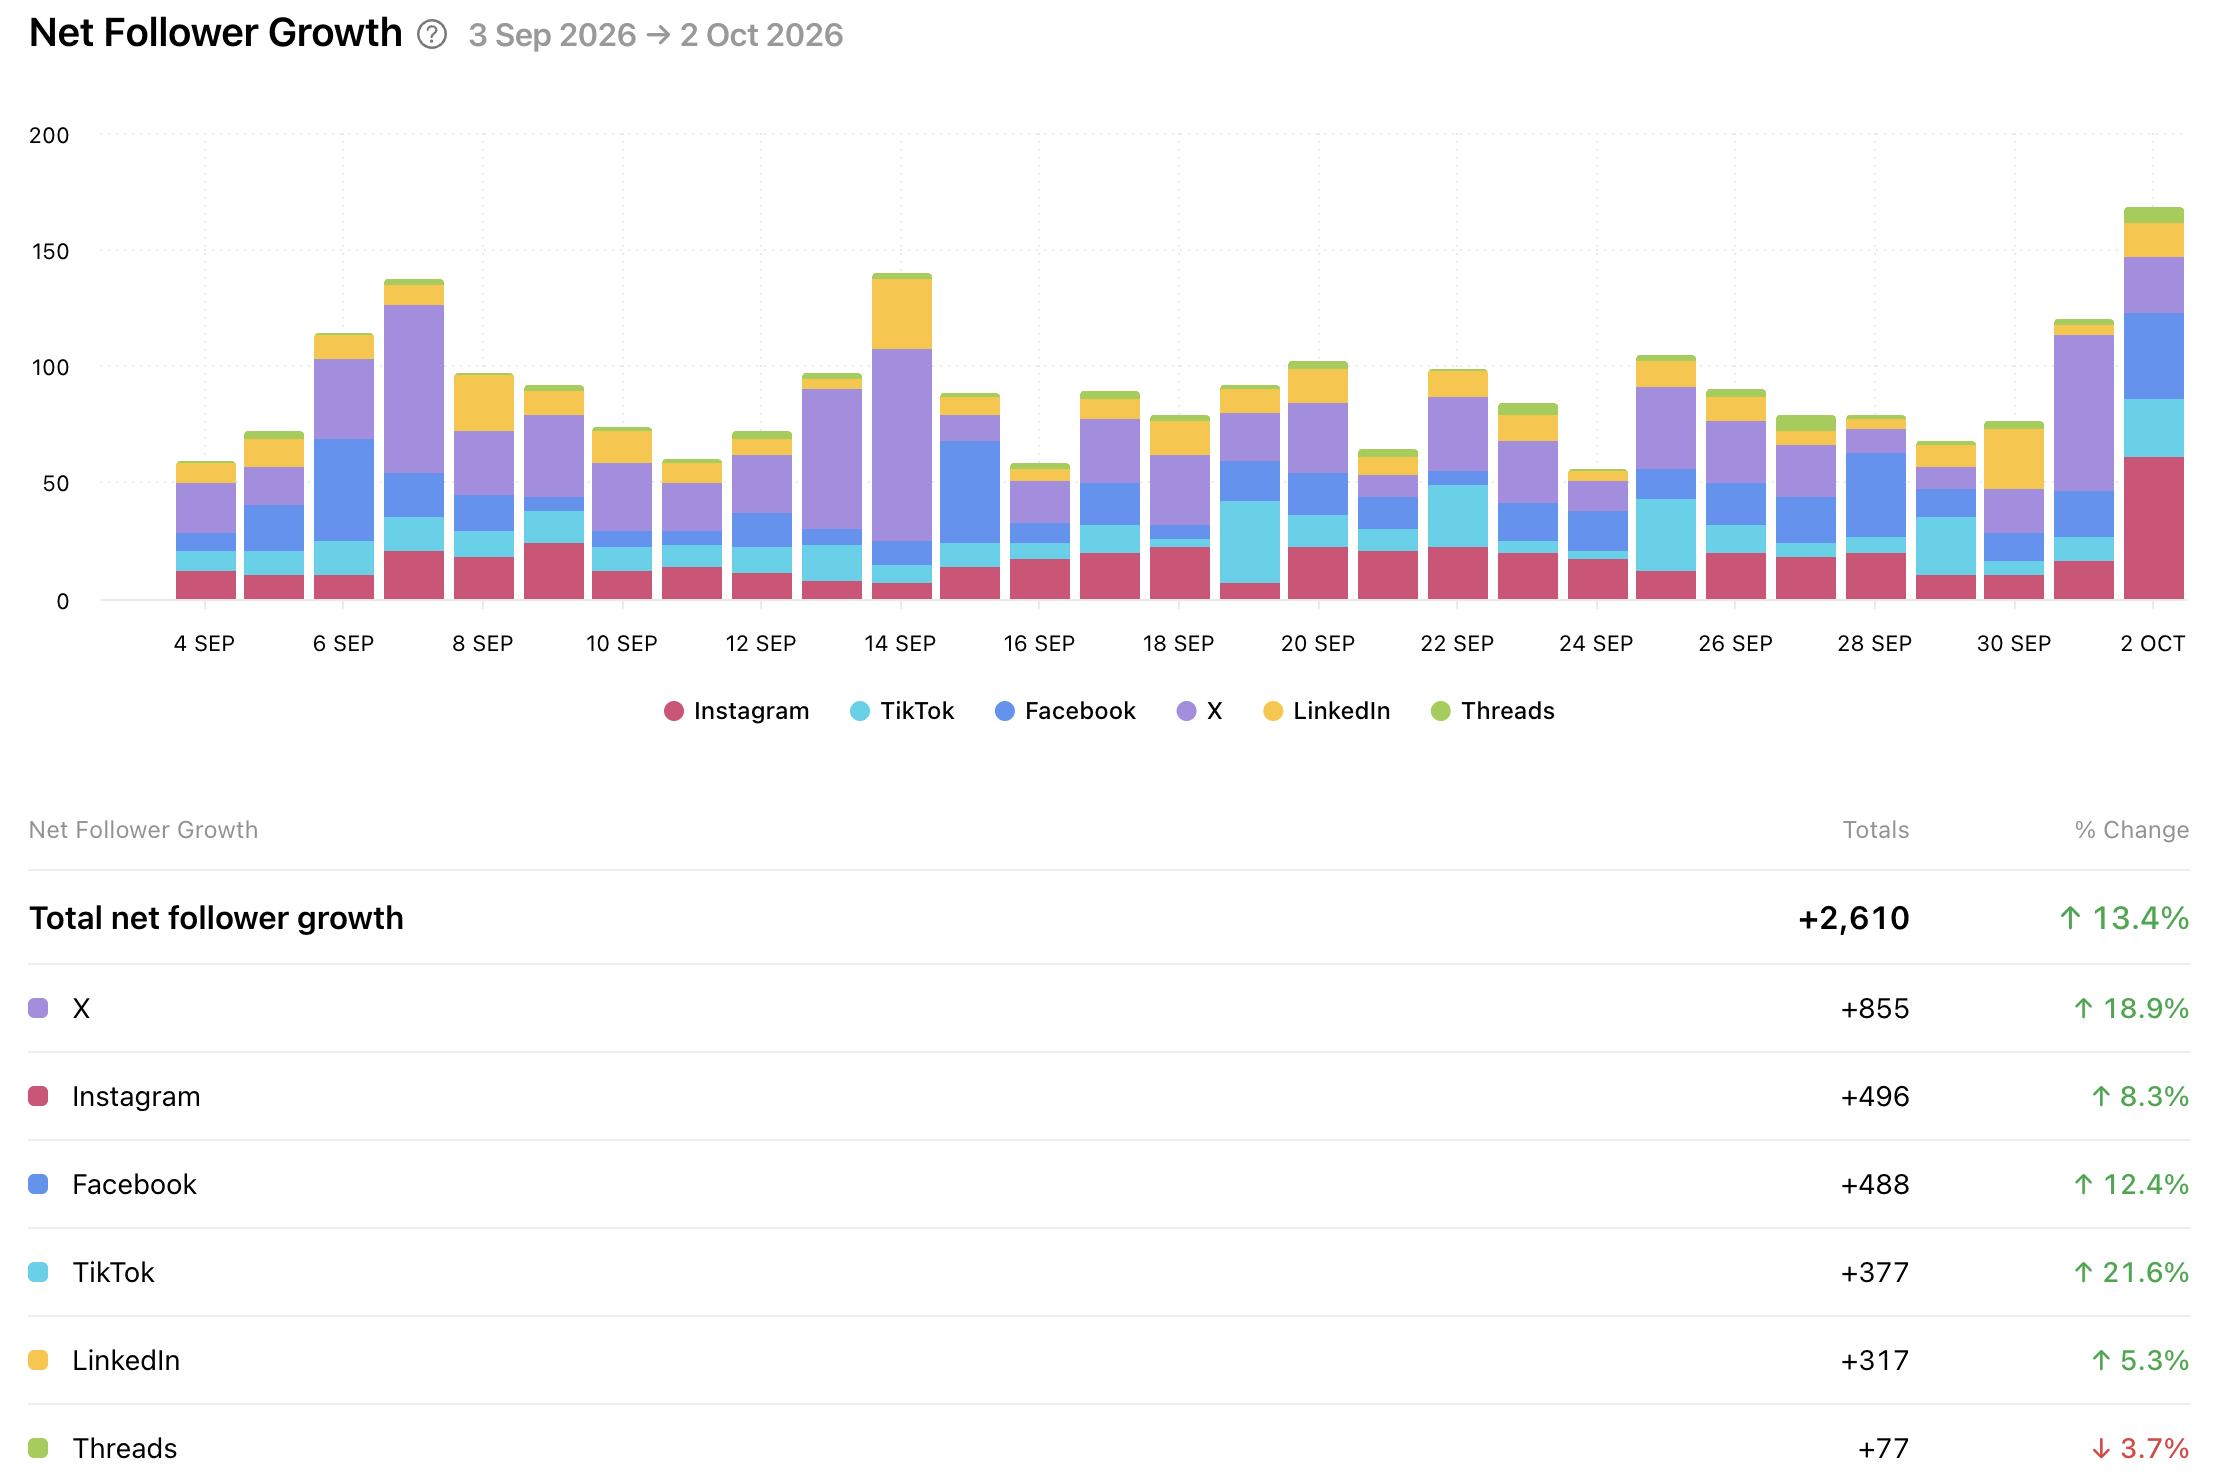
Net Follower Growth
Shows followers gained minus followers lost over the selected date range. Each bar shows the net change for the period, broken down by network or profile.
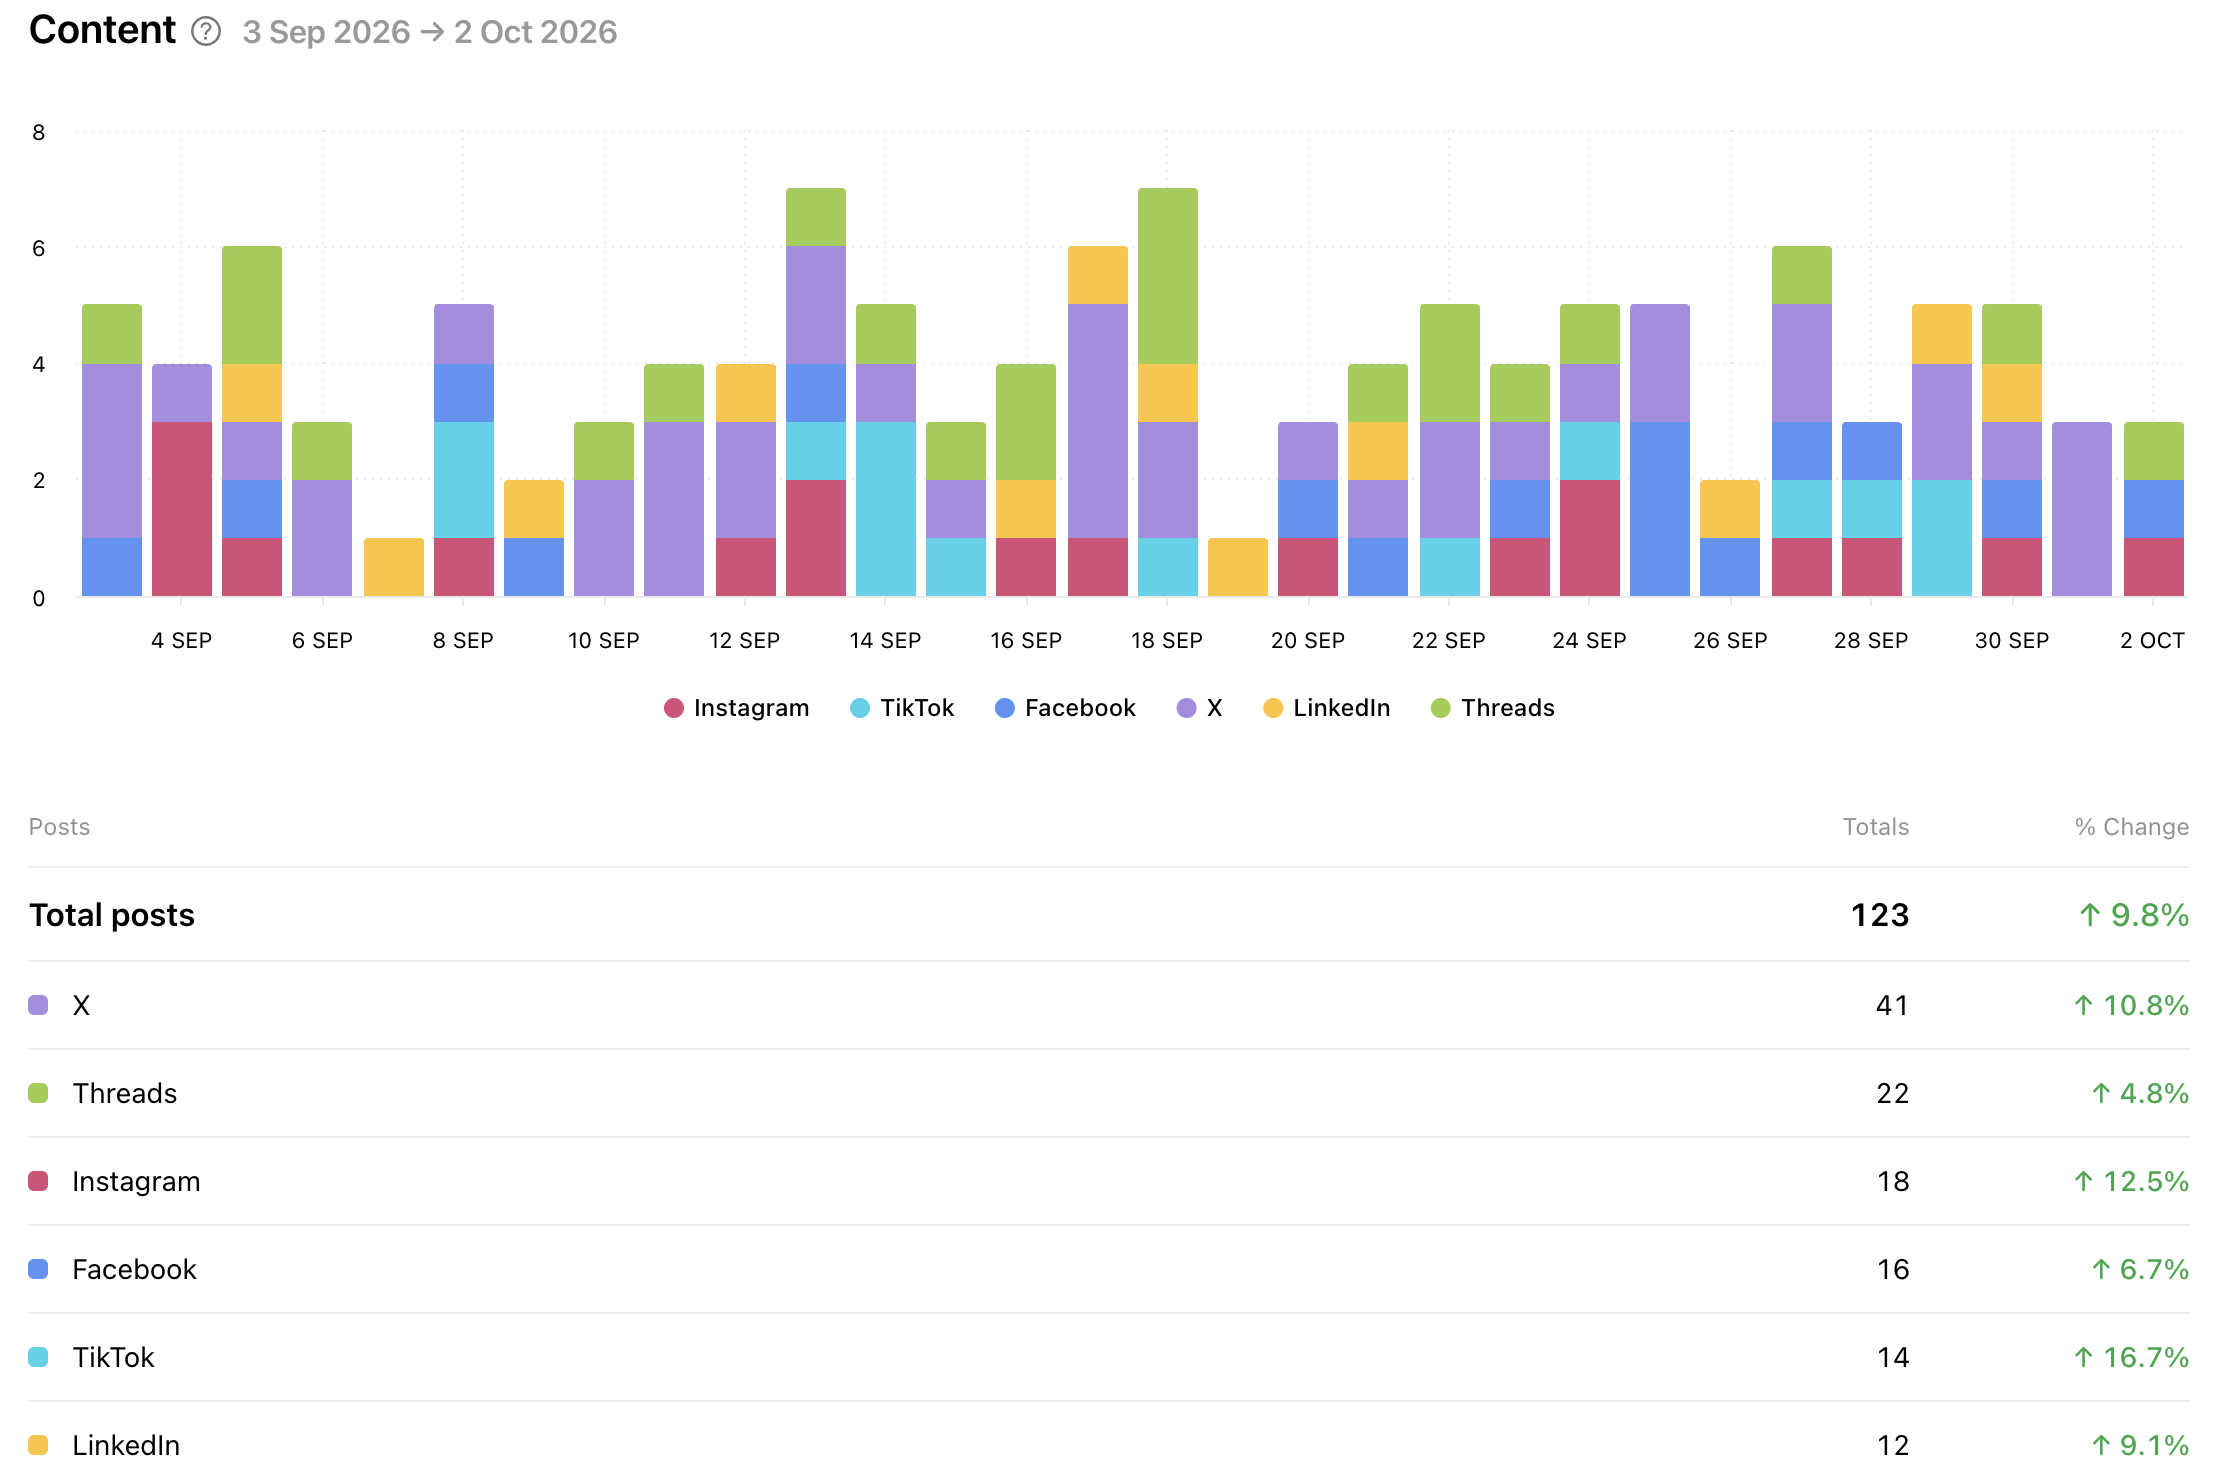
Content
Shows how many posts were published on each network or profile over time.
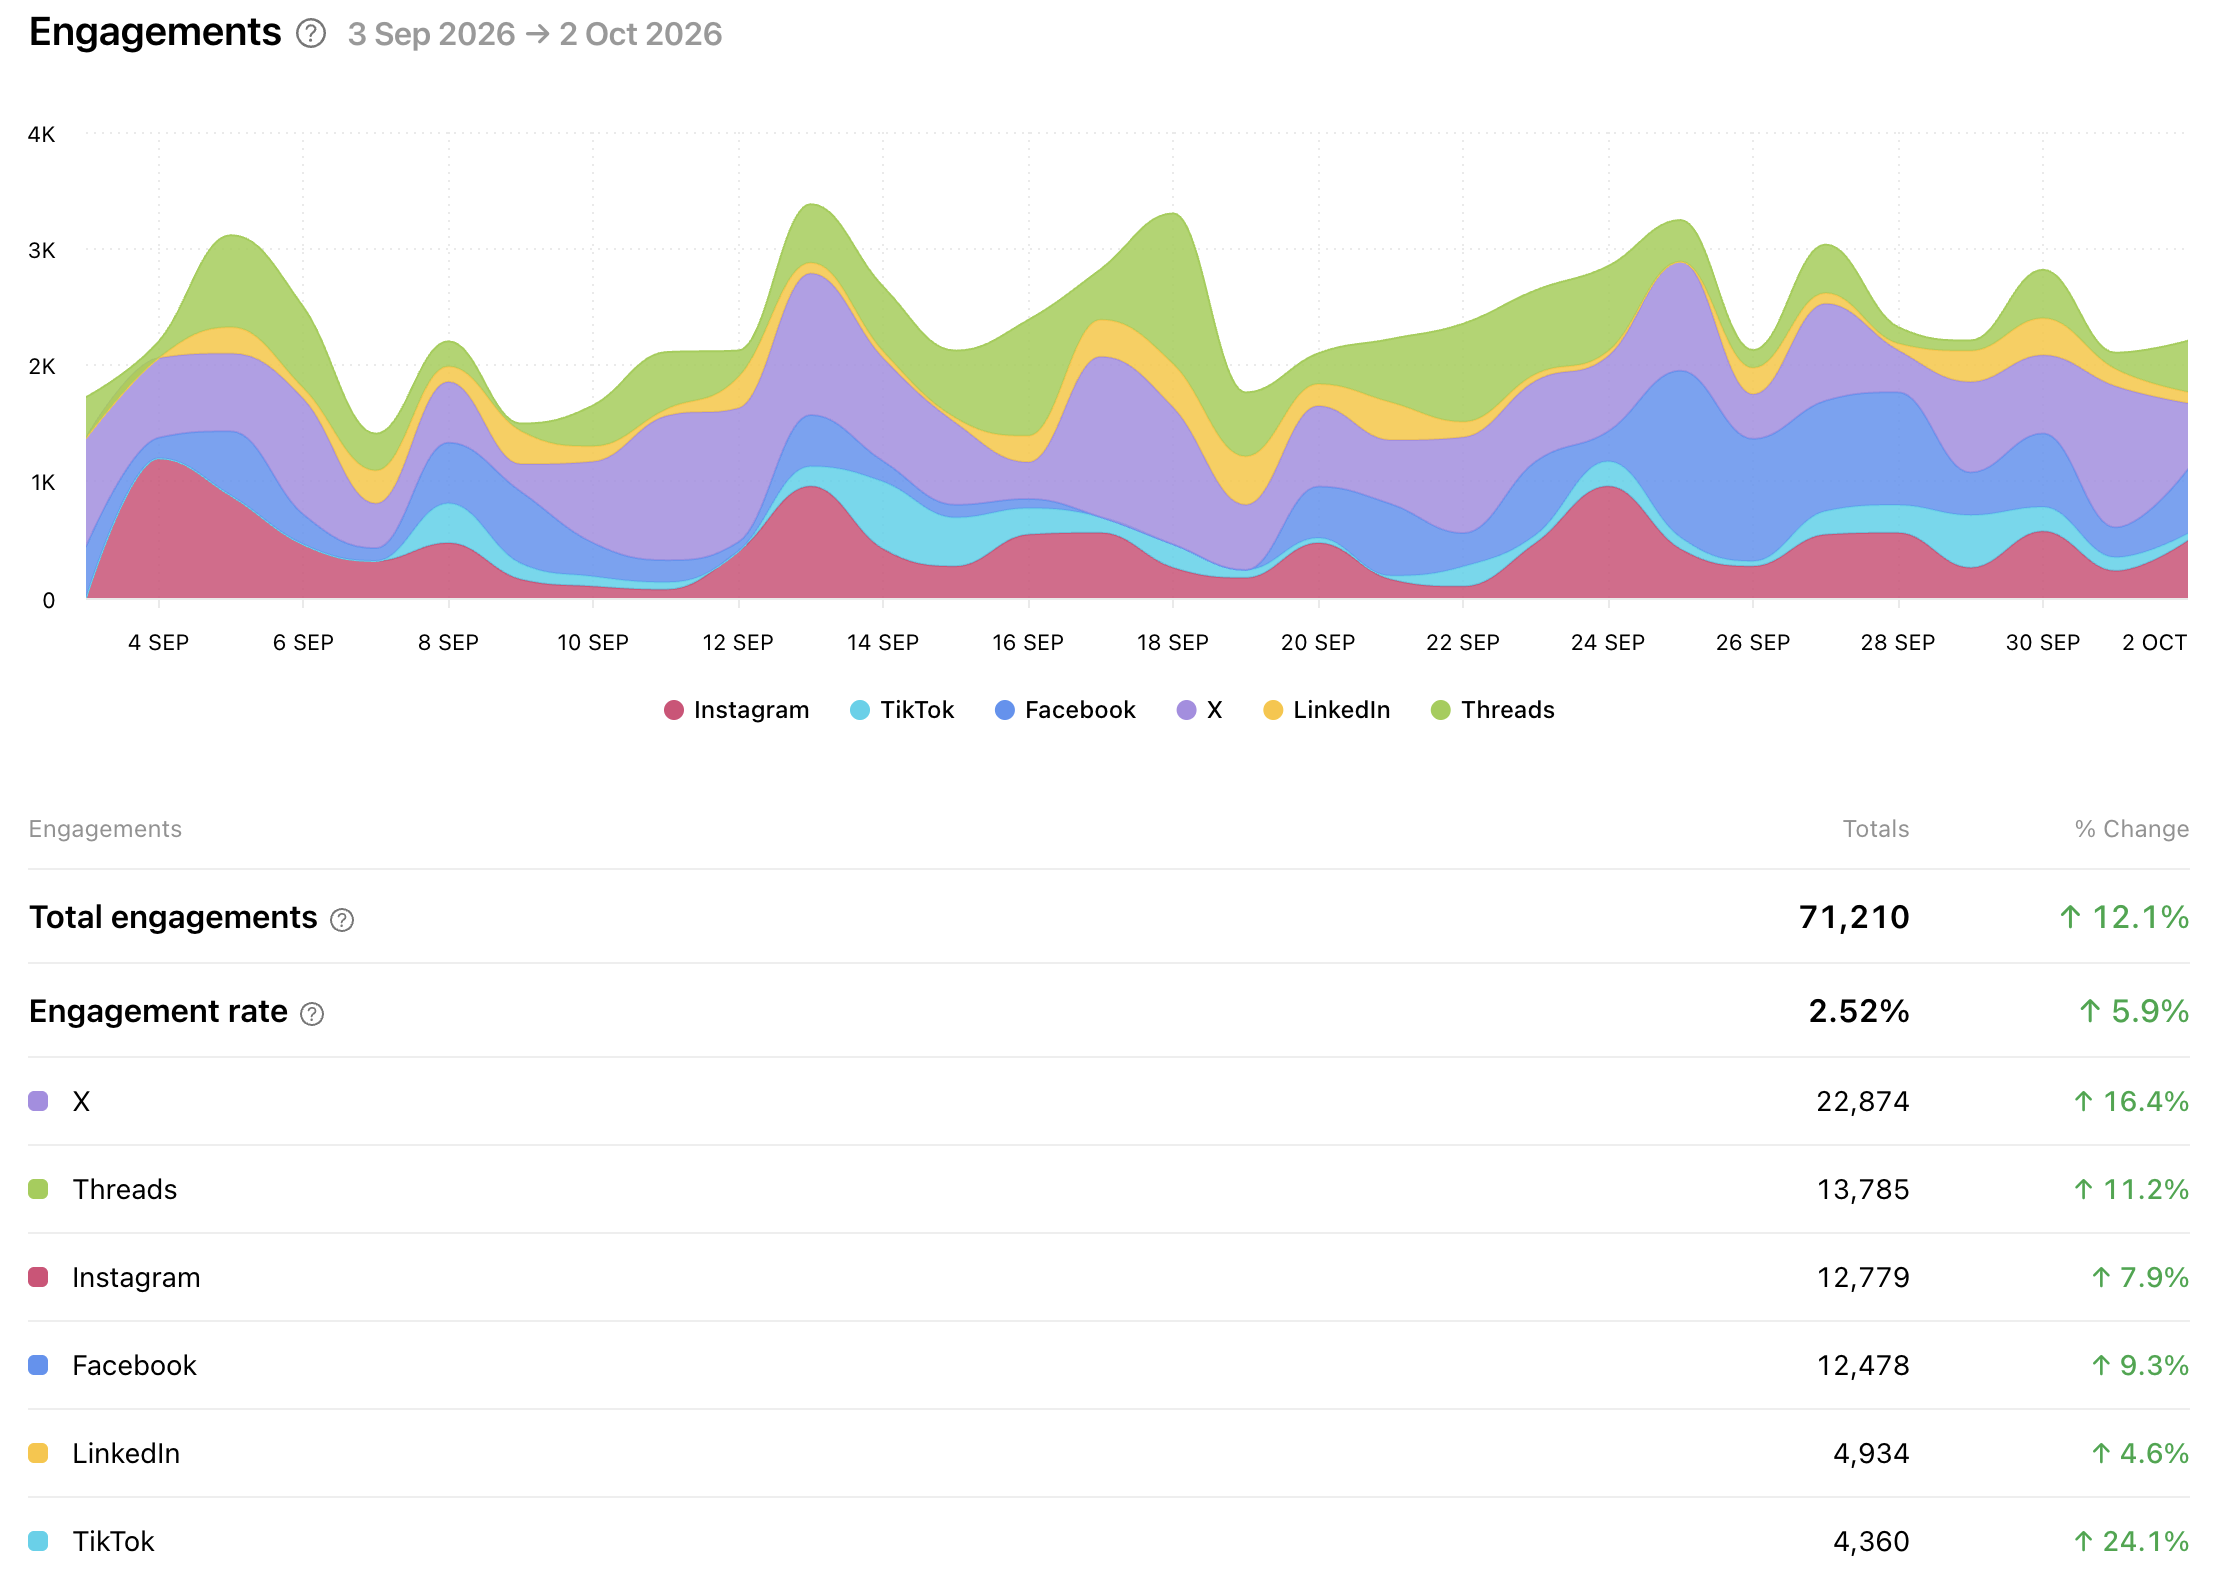
Engagements
Shows how engagements across your group change over the selected date range. Each colour represents a network or profile.
Views
Shows total views over time by network or profile.
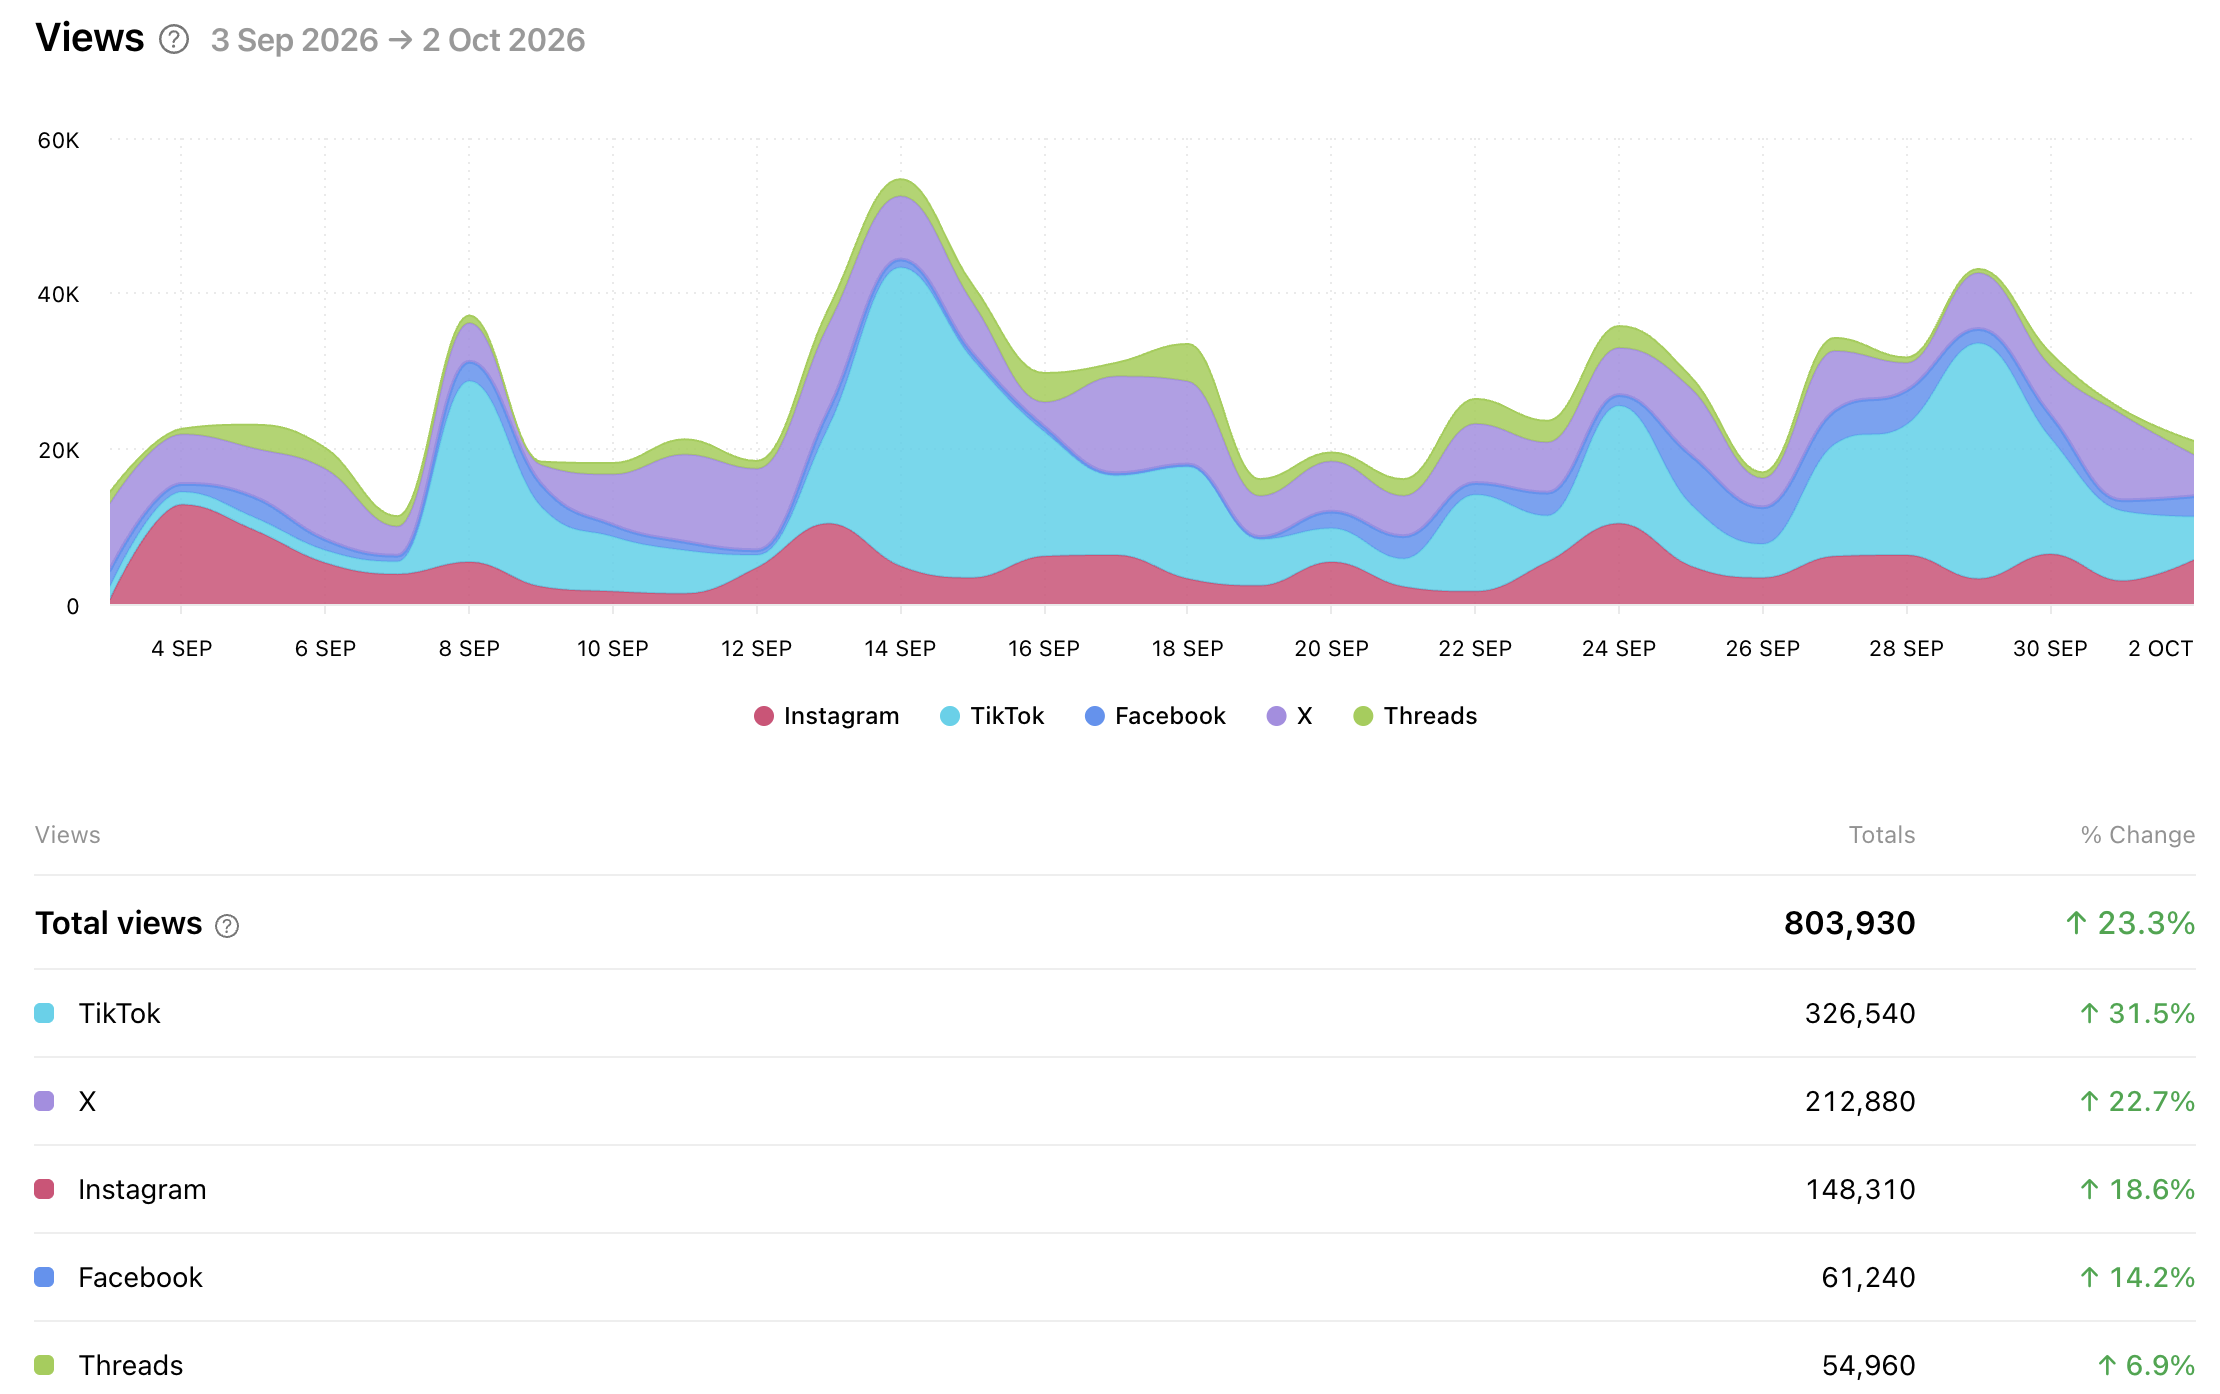
Metric availability: Some metrics are not available for every social network. Where a network does not provide a metric, its profiles are excluded from that chart. For example, the Views chart excludes LinkedIn profiles.
Profiles
The Profiles tab shows a side-by-side table of every profile in the group, with their performance metrics. Sort by any metric to compare accounts and see which profiles perform best.
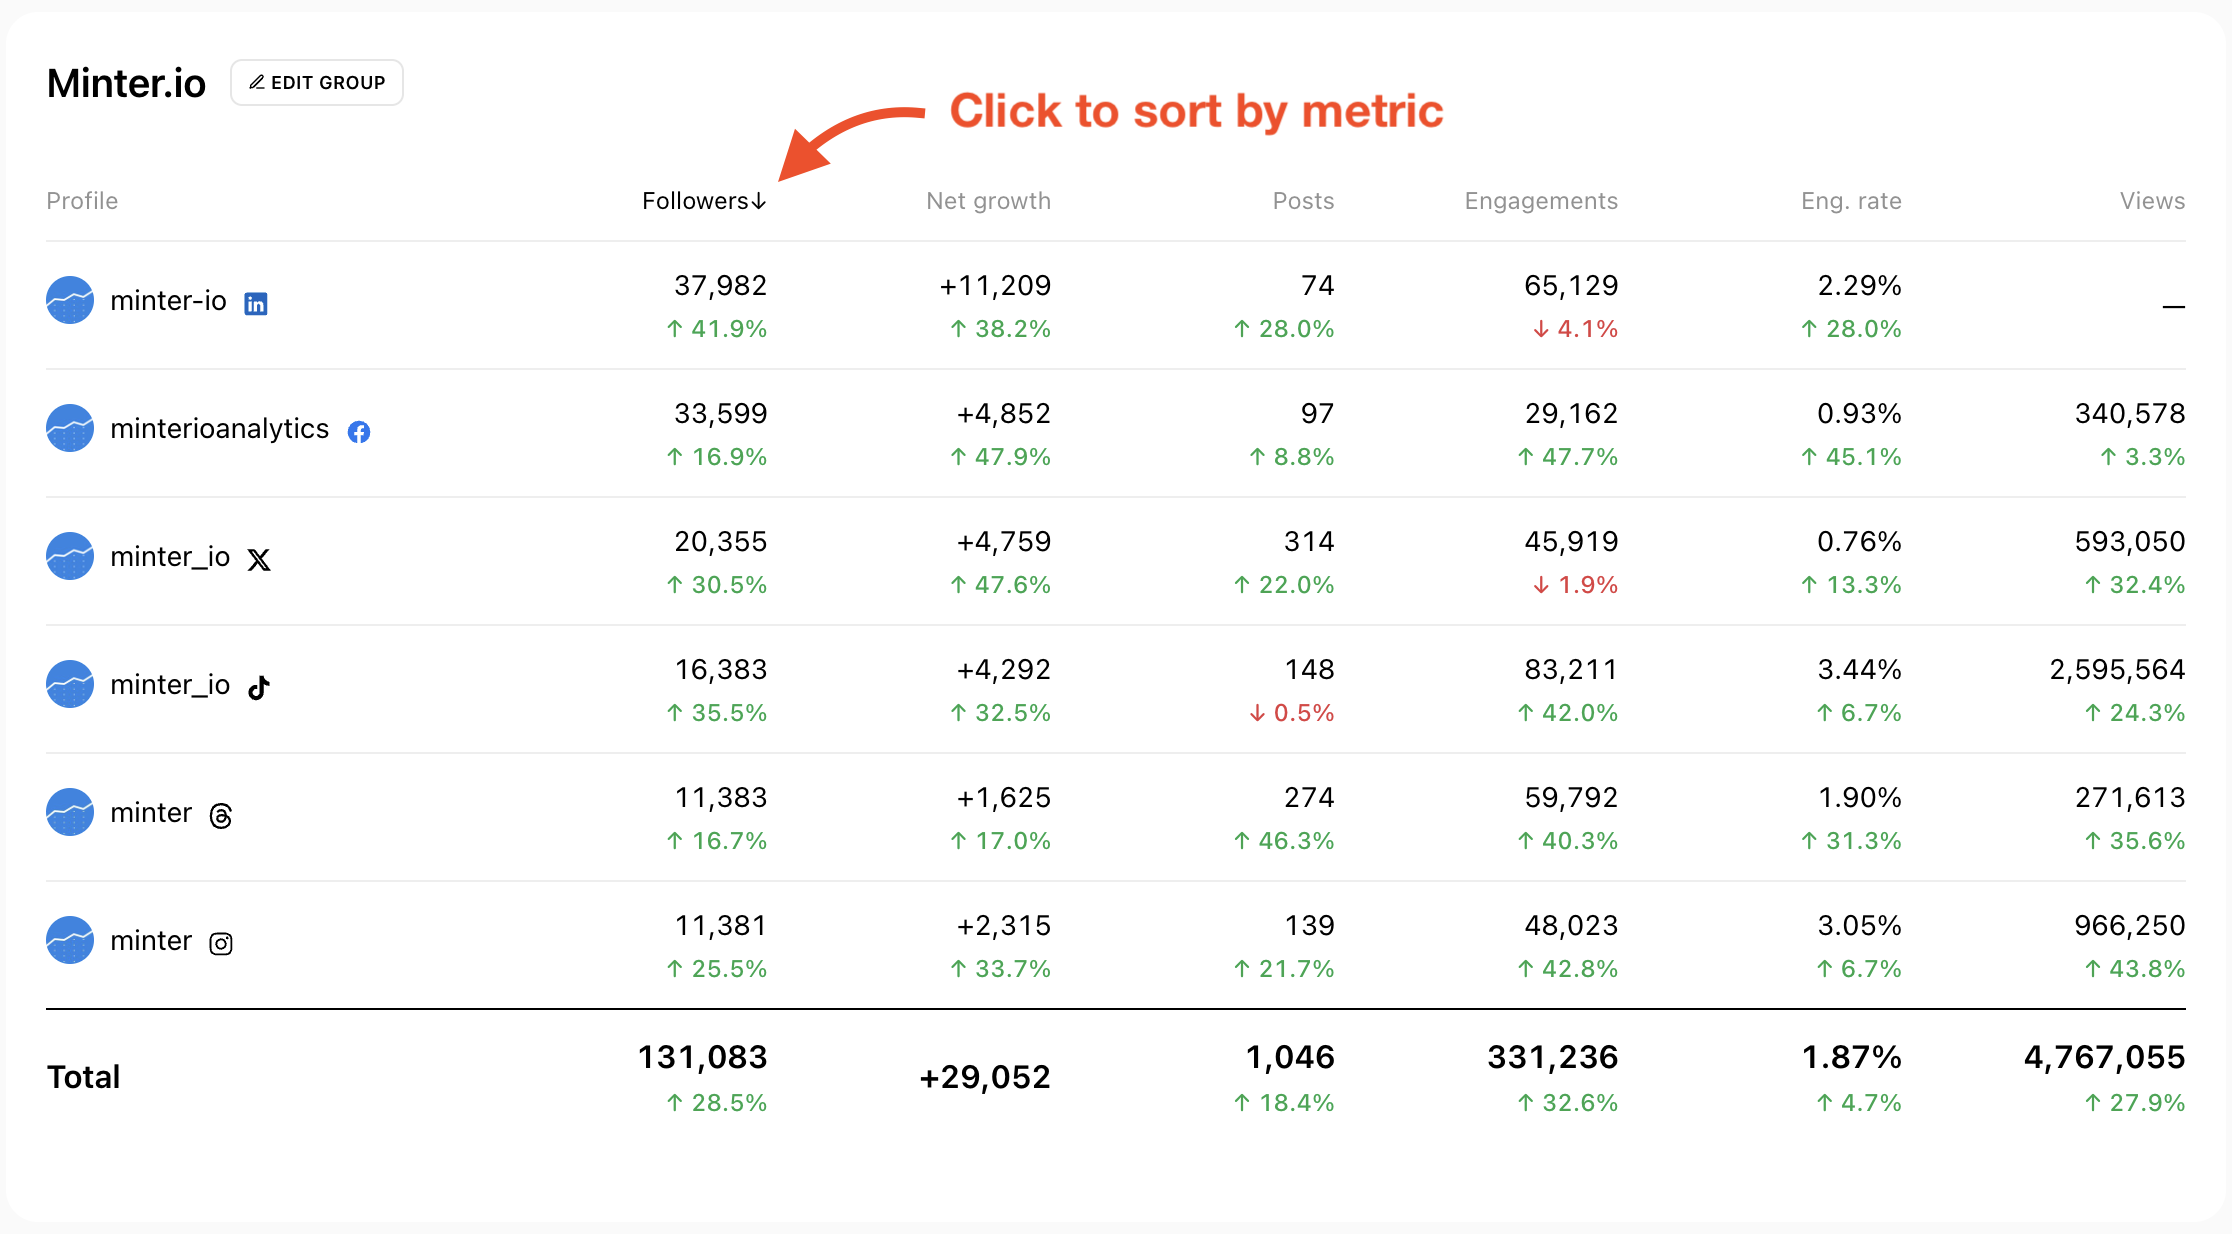
To add or remove profiles, click Edit group next to the group name. For more, see How to manage groups in Minter.io.
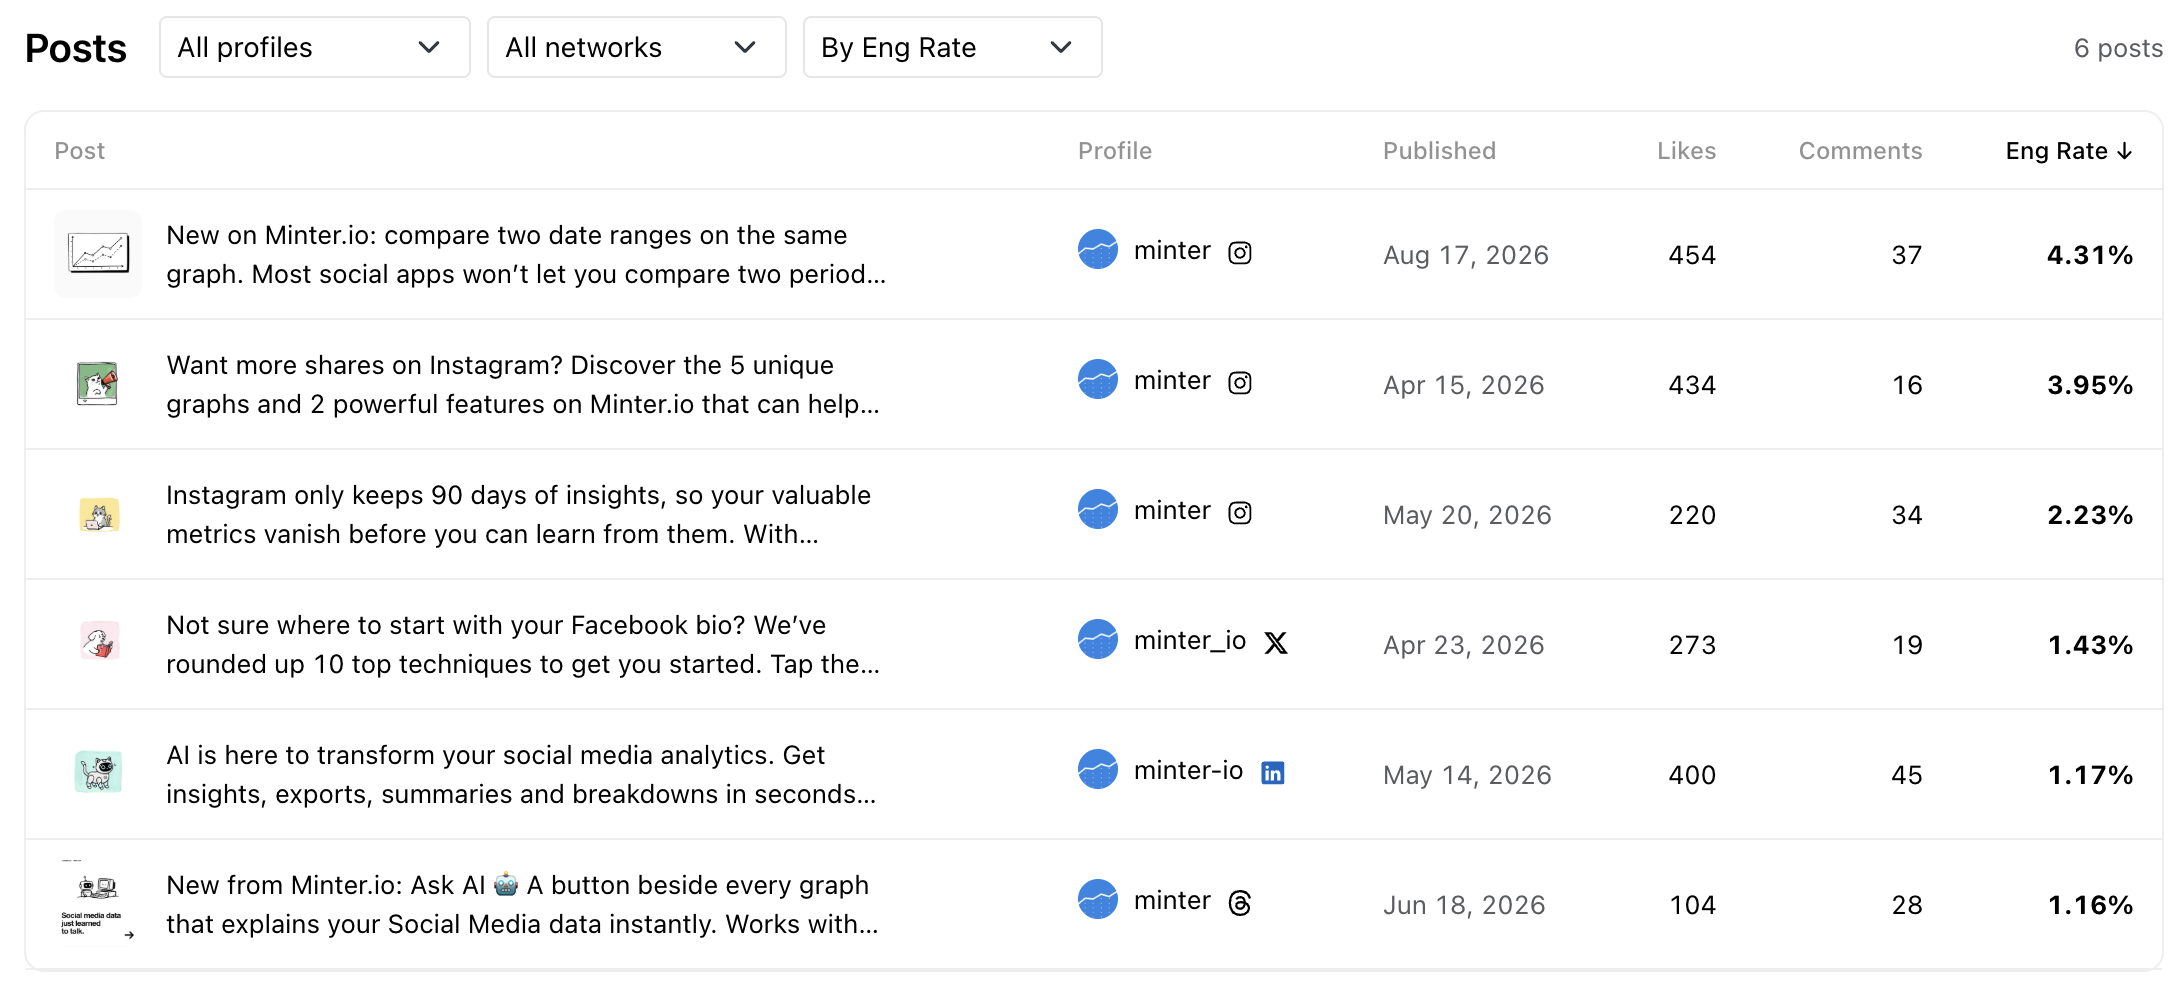
Posts
Shows every post from the profiles in the group in one list. Filter by profile or network and sort by engagement metrics to find the best content in the group.
Group reports support Instagram, TikTok, Facebook, X, LinkedIn and Threads, and are available on the Gold, Platinum and Agency plans.