Analyze your TikTok followers with Minter.io
Knowing about your TikTok followers opens the door to better content ideation, creation and sharing for the people who love your stuff. After all, conversation flows much more easily if you know who you’re talking to. If you want to provide more effective content to strengthen, grow and connect with your community, Minter.io can help.
Minter.io is a social media analytics tool that takes the guesswork out of your social media presence. It provides in-depth information presented in easy-to-understand graphs, tailored to your unique social media accounts. In this article, we’re looking at how to use Minter.io to get a better understanding of your TikTok followers - these are the people who have hit the follow button and are eager to see more from your brand. We want you to feel confident that you can nurture these online relationships so you can maximise the value you have to offer on TikTok, which can set you up for expanding your impact and growing your follower count.
Head to the Audience section of your Minter.io TikTok data to get started…
Gender of Followers
Knowing the gender of your followers is a key factor in crafting content that is likely to connect with them. Taking note of the gender split can also play a role in product design, new releases or adjusting your social media strategy with the aim to align your TikTok following with the target audience for your products and services.
The Gender of Followers graph shows the gender ratio of followers added during the selected date range. Hover over a section of the graph to see the exact split percentage.
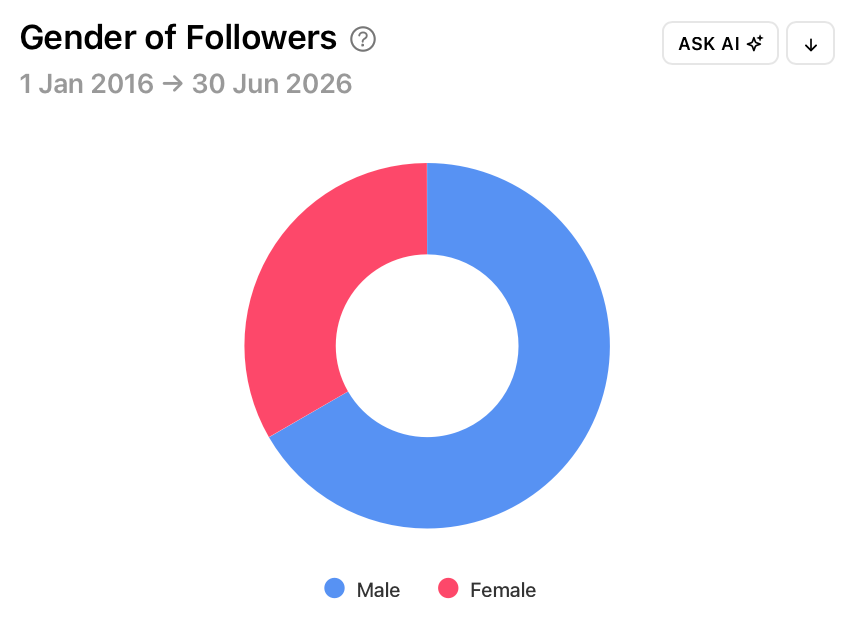
Is the gender split of your TikTok followers relatively even or does your TikTok following heavily favour male or female? How can you use this information to shape your approach on TikTok?
Want further clarity and explanation around a specific graph? Hit the Ask AI button next to any graph to access the Minter.io AI Analyst. This will start a chat about the data in your graph utilising the effective capabilities of artificial intelligence.
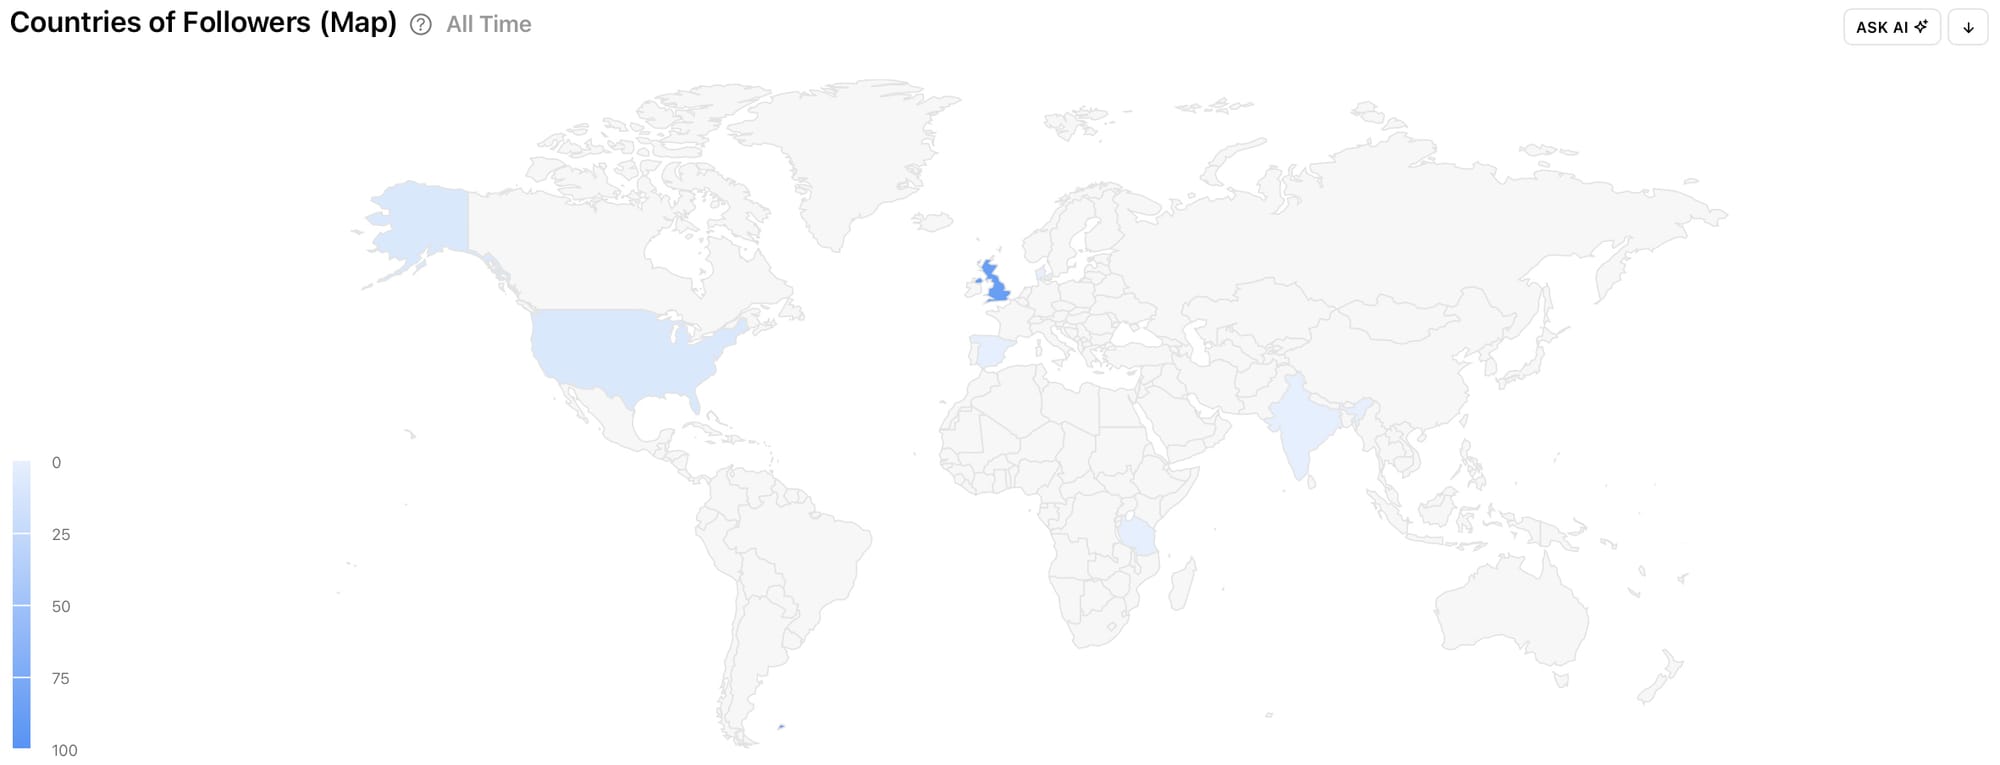
Countries of Followers
Knowing where your followers are located can shape the language you use, the times you publish content, the holidays you get involved in and the content you craft. For example, if your followers are predominantly in Australia they will experience hugely different weather and seasonal shifts than an audience predominantly in the northern hemisphere. This will impact the relevancy of certain types of content and cultural themes. Smart brands use this information to provide better value, connection and suitability.
Countries of Followers are shown in two ways: on a map and as a top 10 bar chart. The Countries of Followers (Map) graph shows the countries of followers added during the selected date range on a map. The map provides a clear visual representation of the location of your followers. Hover over a section of the map to see the exact percentage of your followers in a specific country. The darker the blue, the higher the percentage.
The Countries of Followers top 10 bar chart makes it really quick and easy to pinpoint the countries with the highest percentage of your followers. Hover over a bar to see the exact percentage.
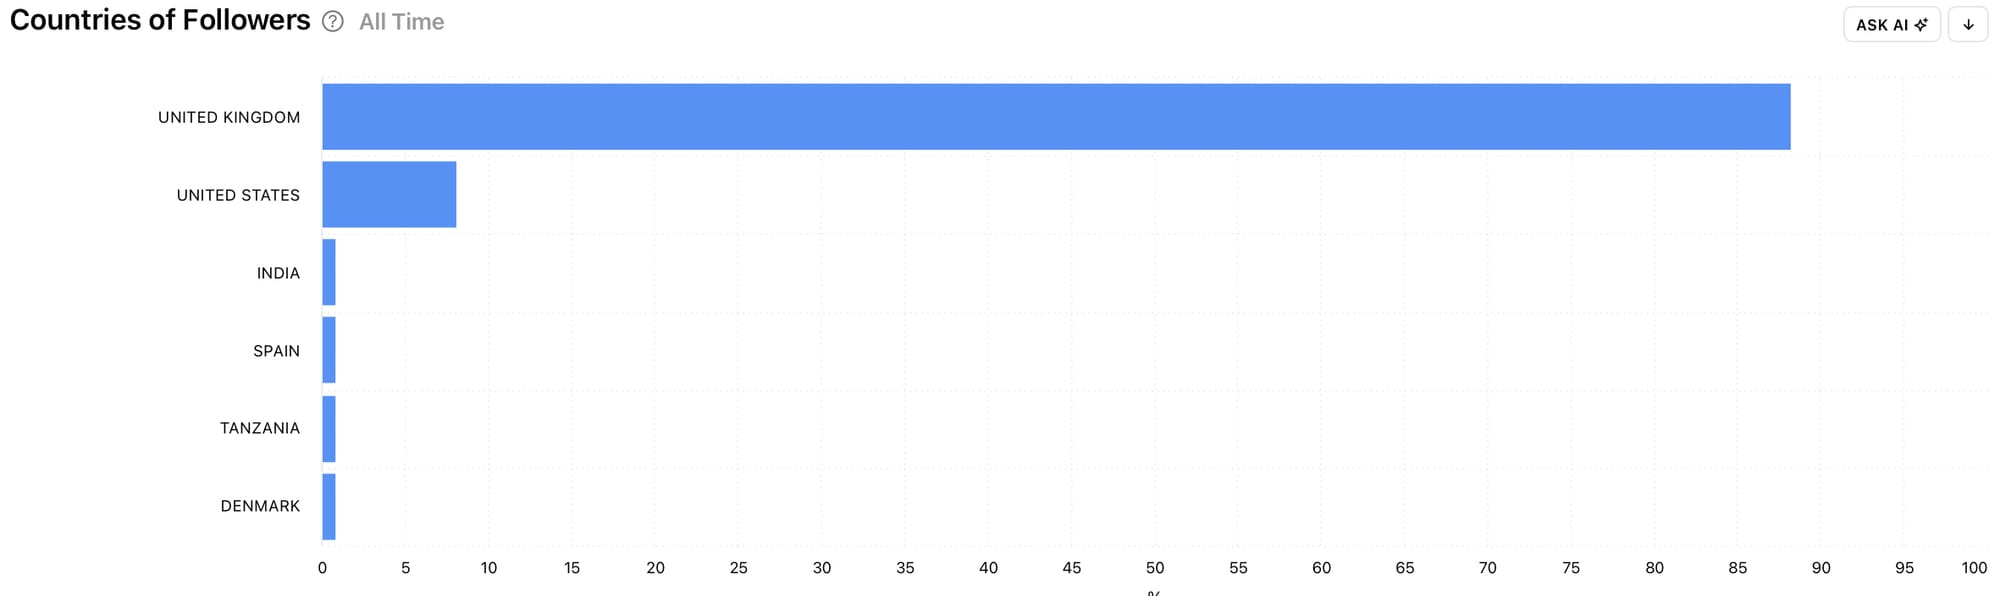
Are your followers all in one location or are they spread out across the world? Are more of your followers in the northern or southern hemisphere? Are your followers from the same location as you or are they mainly from a different country? Use this information to make informed decisions around your brand, business and TikTok content.
Followers Online
It’s also helpful to know about your followers’ behaviour, for example when they are online. By understanding their habits and routines, you can connect with them at a time that is most convenient to them.
The Followers Online graph shows the times of the day and the days of the week when followers were most active during the selected date range. The darker the colour, the higher the percentage of your followers were active. Above the graph is the time and day of the week when the highest percentage of your followers were online.
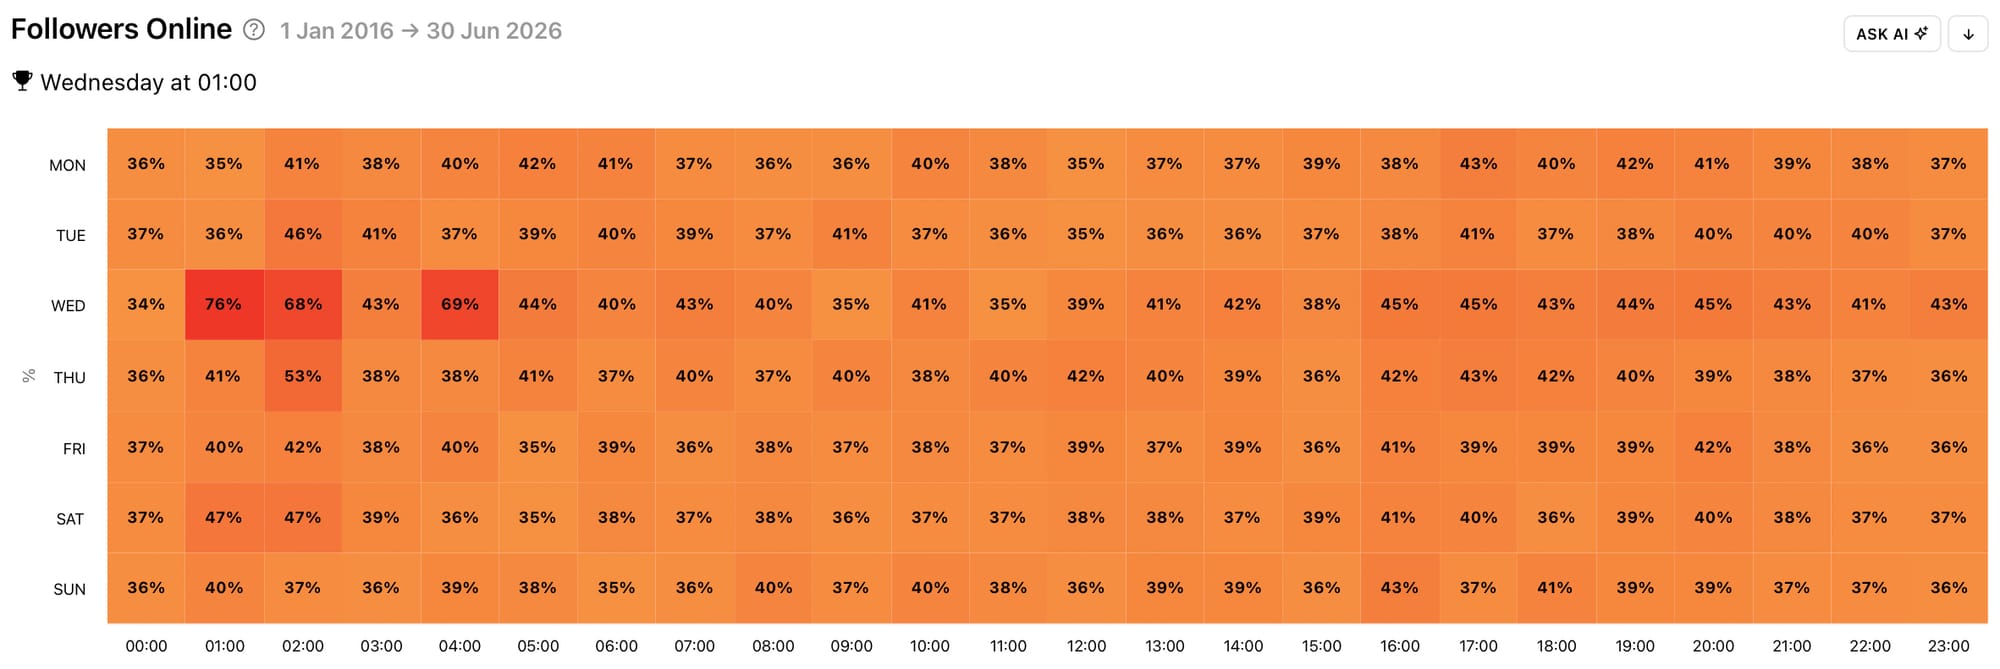
Use this information to choose times to post and interact with your followers. It may be a good idea to become available in the comments and DMs around peak times. You can also build up a picture of how your followers use the TikTok app using this graph. Do they tend to log on when they first wake up, during their lunch break, or after a long day at work? Are they more or less active at the weekend? Do they stay up late scrolling or grab their TikTok fix while grabbing a bite to eat? And how can you create and publish content that works with their activity?
AI Analyst
Minter.io has an effective artificial intelligence tool - the AI Analyst - which you can use to further your understanding of your TikTok followers. Simply input a prompt to get started.
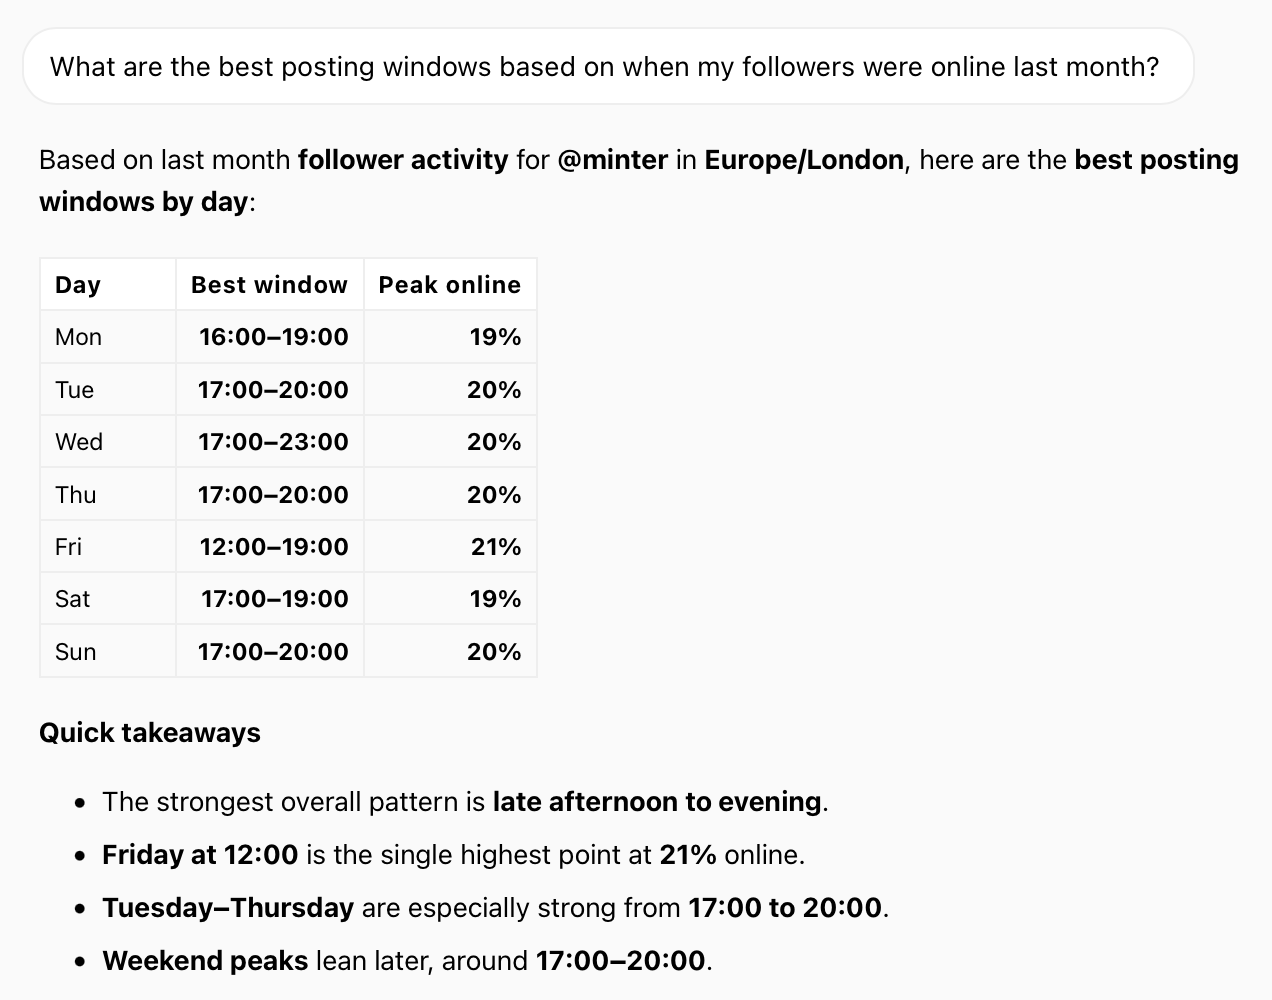
Try these prompts to better understand your TikTok followers:
- Describe my followers
- Describe my followers’ behaviour
- Build an avatar using my follower information
Try these prompts to tailor content specifically to your TikTok followers:
- Build a full marketing avatar
- What can I be doing more of to connect with my followers?
- Generate 5 TikTok video ideas to connect with my current followers
Everything in your content, as well as the way your bio is written and the way you respond to comments and DMs, is a choice that can be consciously made to better align with your followers. Content subject matter, editing styles, pacing, colours, text fonts, hooks, voiceovers, captions etc. can all be used to better connect with the people who love what you’re all about. Squeeze every opportunity to thrill your followers and see how focusing your efforts on an audience that has already signed up to see you can strengthen that bond and ultimately build your following and customer base.
To get access to all the graphs and features in this article, head to Minter.io now.