5 Top things to know about your TikTok audience
Getting to know your audience is the key to growing your audience. With data unique to your TikTok profile, Minter.io connects the dots so you can understand what’s happening in and around your presence on social media. In this article, we’re going to check out a bunch of TikTok demographic metrics, including several graphs new to Minter.io, so you can get to know your audience better. With more information in your hands, you can create content perfect for the people who mean the most to your brand online.
Here are the 5 top things to know about your TikTok audience…
Note: All demographic metrics can display data for new followers over a selected time frame, as well as for all followers using the 'All Time' option. You can access these options using the date picker in the top right-hand corner of your Minter.io TikTok data.
1. Number of Followers
It’s important to know the total number of followers you have and how this number has changed over time because this is a key indicator of whether or not people are connecting with your brand on TikTok. Following a profile is more valuable than simply viewing content from a profile as it shows user investment and almost guarantees repeat viewership and engagement.
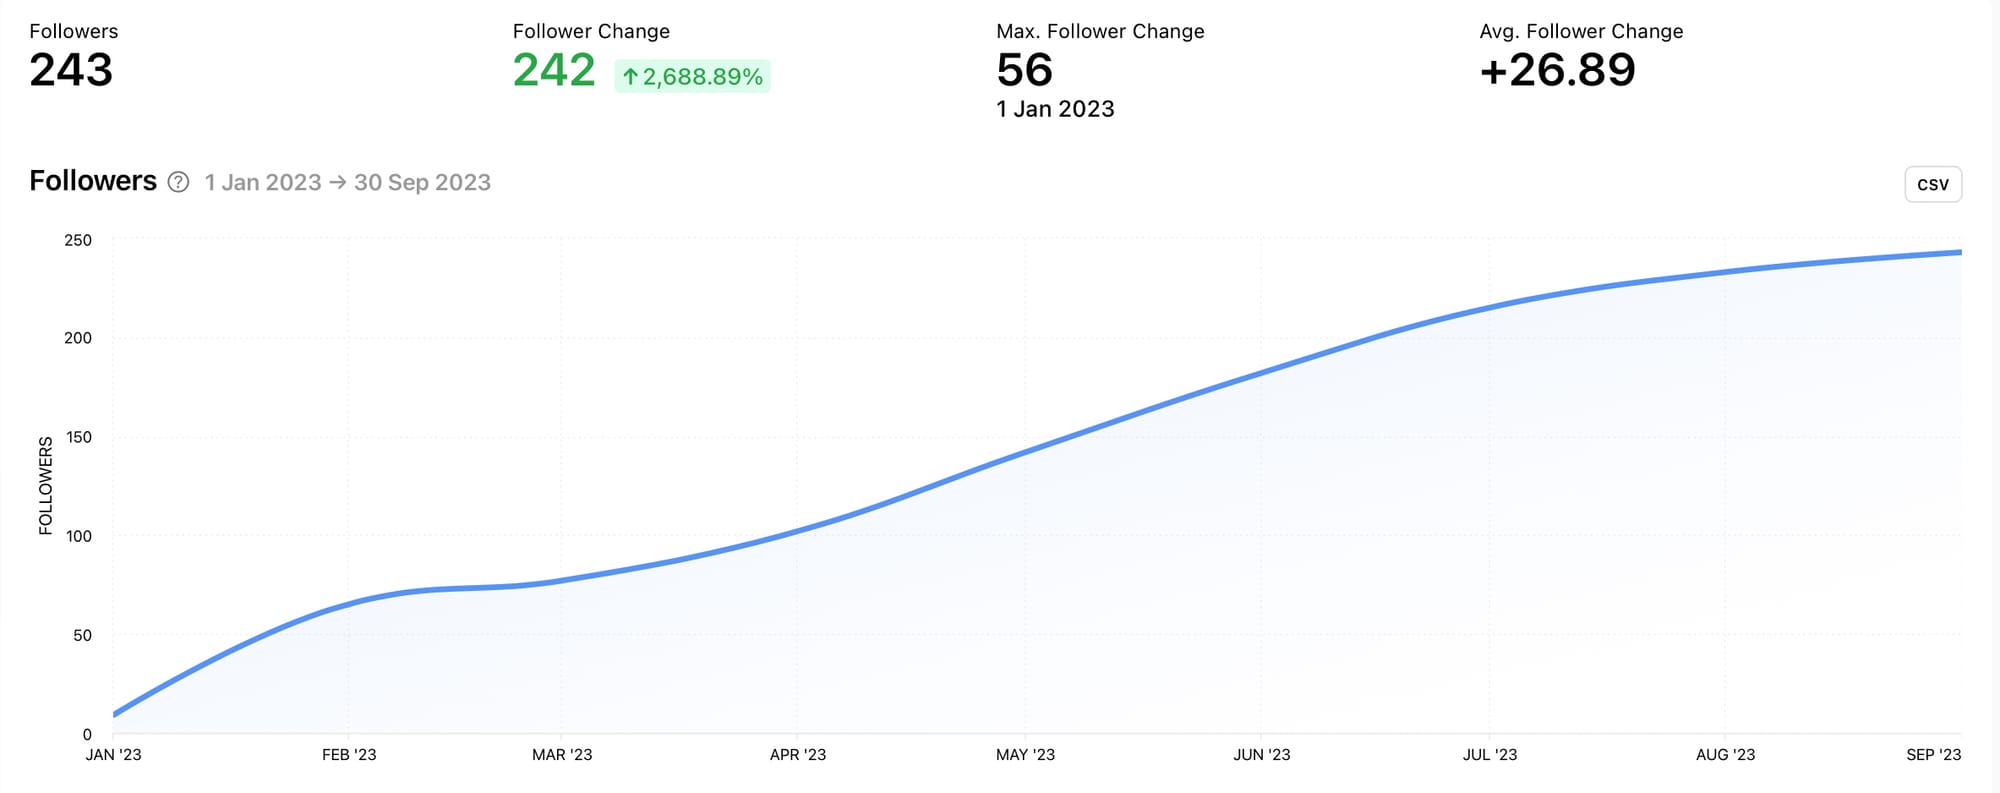
The Followers graph shows the total amount of followers over the selected date range. This graph can indicate the overall health of your follower growth as it shows your follower growth or decline, spikes and dips in followers and the general trend and speed of your follower change. Above the graph you can see the follower change and percentage, the maximum follower change and the day this occurred, as well as the average follower change per day, week or month depending on how you’ve selected to view the data.
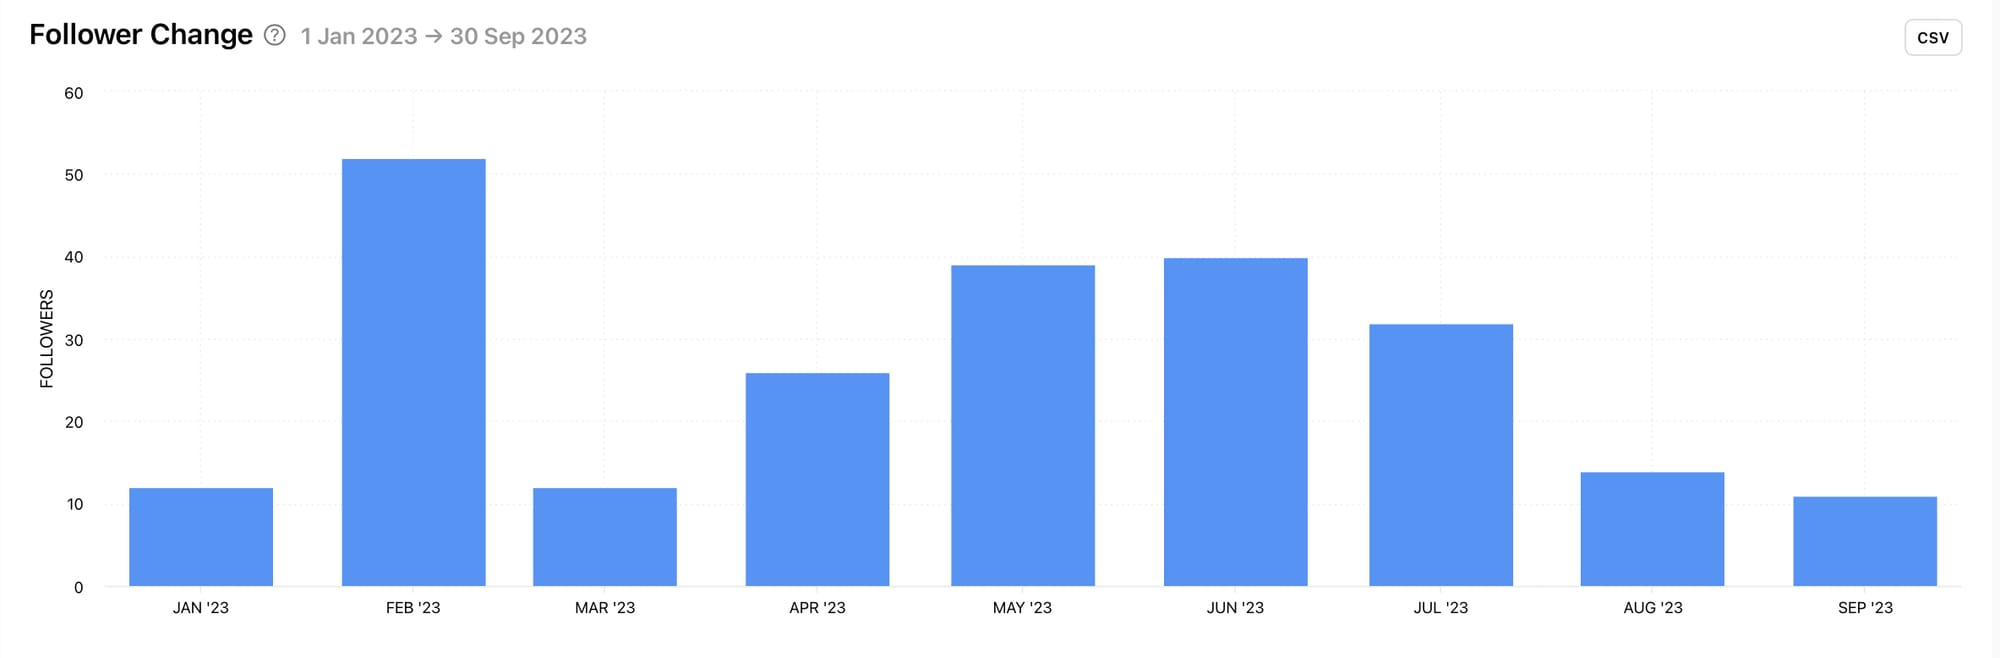
Team this information up with the Follower Change graph to see the exact amount of followers gained or lost by month, week or year within the selected date range.
2. Gender of Followers
Do you know whether your audience is made up of mainly male or female users? This information can help shape your content to be its most relevant to the people who make up the most of your audience. It can influence everything from the topics you choose to share about, the trends you join, the descriptions you write and the emojis you use. Having this knowledge to hand can guide your creative choices in a way that invites engagement from your current followers while boosting follower growth from similar audiences.
The Gender of Followers graph shows the genders of your followers split into a percentage ratio. Hover over a section in the graph to see the exact percentage.
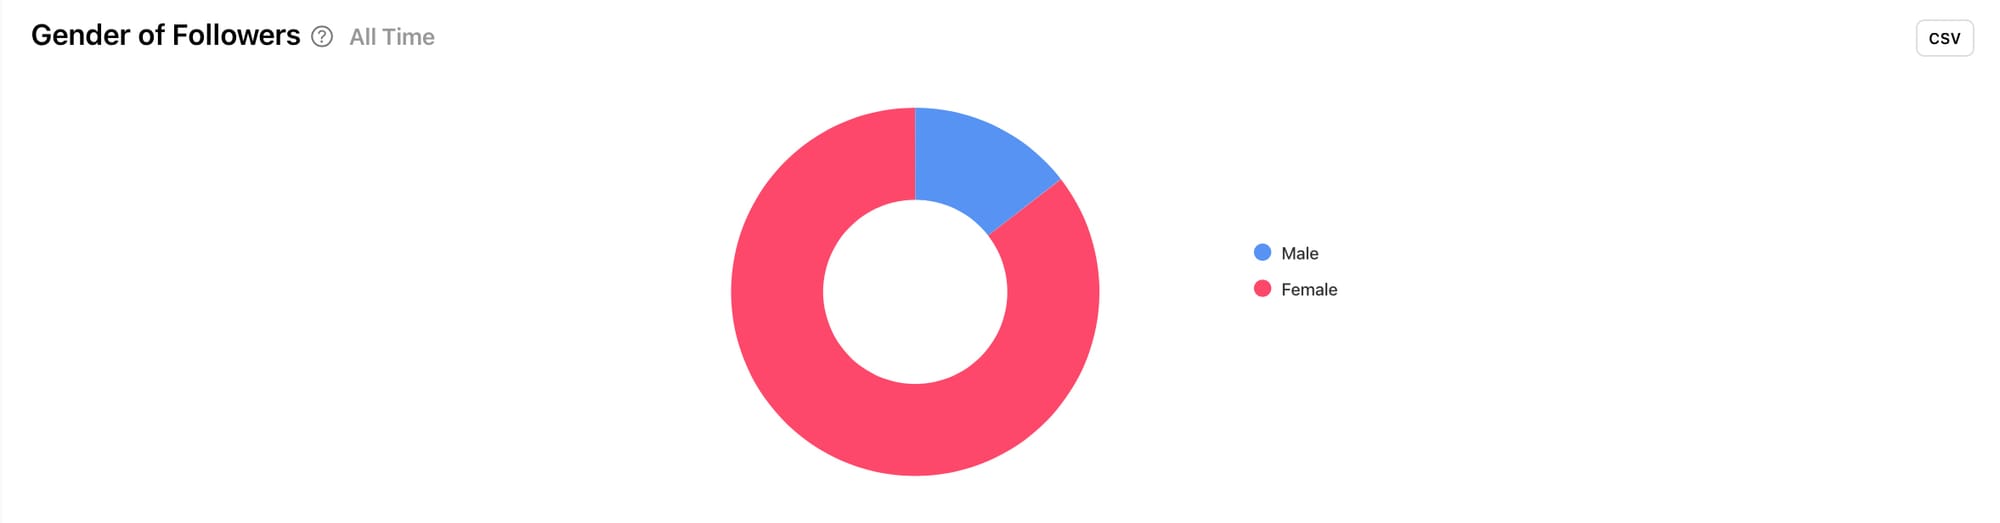
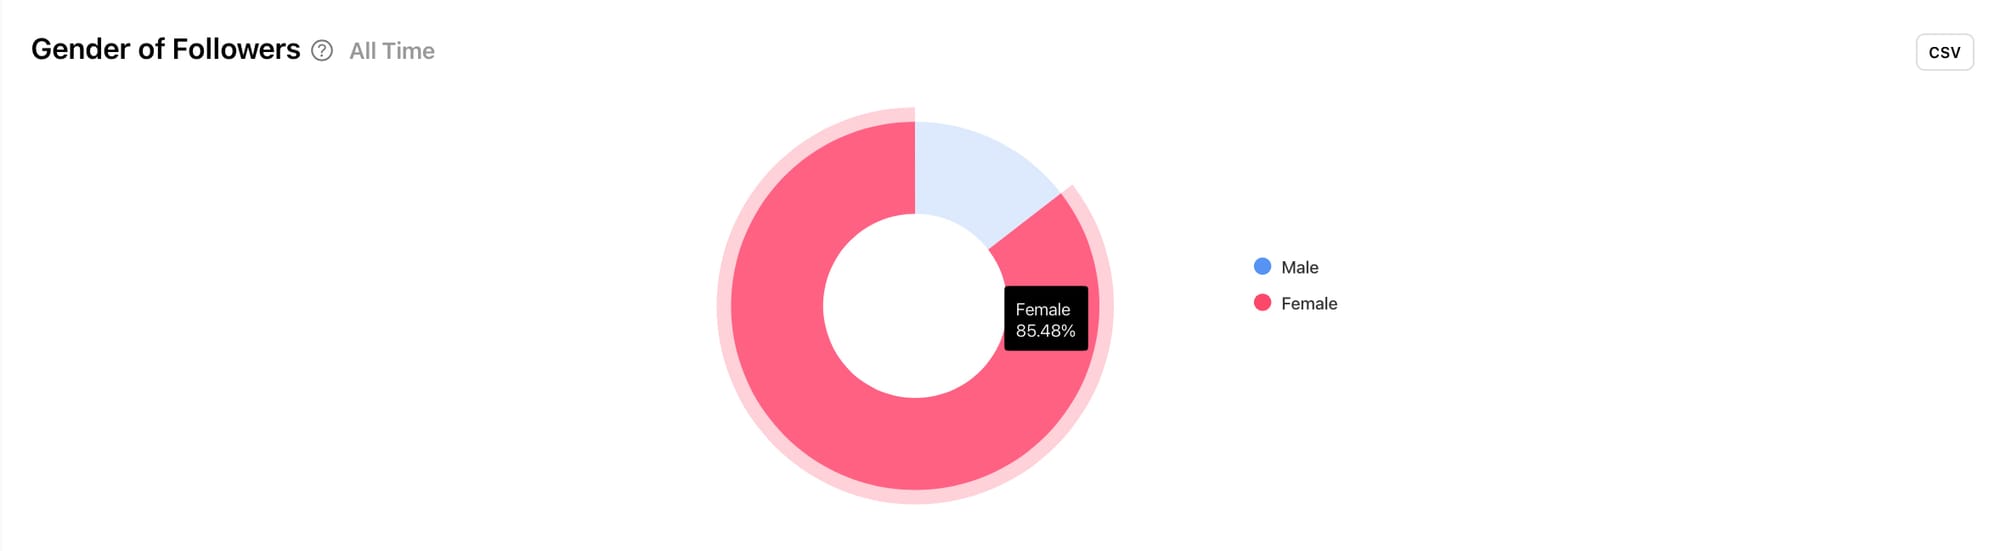
Gender of Followers graph by Minter.io (left), hover over a section of the Gender of Followers graph to see the exact percentage
3. Countries of Followers
Knowing where your followers are located in the world is a valuable metric to track, as this again can shape and strengthen your content and its relevance to your audience. By being aware of the countries where your core following resides, you can make decisions that make sense for your followers. Key choices include: the language of voiceovers, text posts, overlays and descriptions. It’s also good to be aware of cultural trends, national holidays, social movements, political shifts and religious leanings. This can help you get involved in things that matter to your followers and avoid major mishaps in the public relations department.
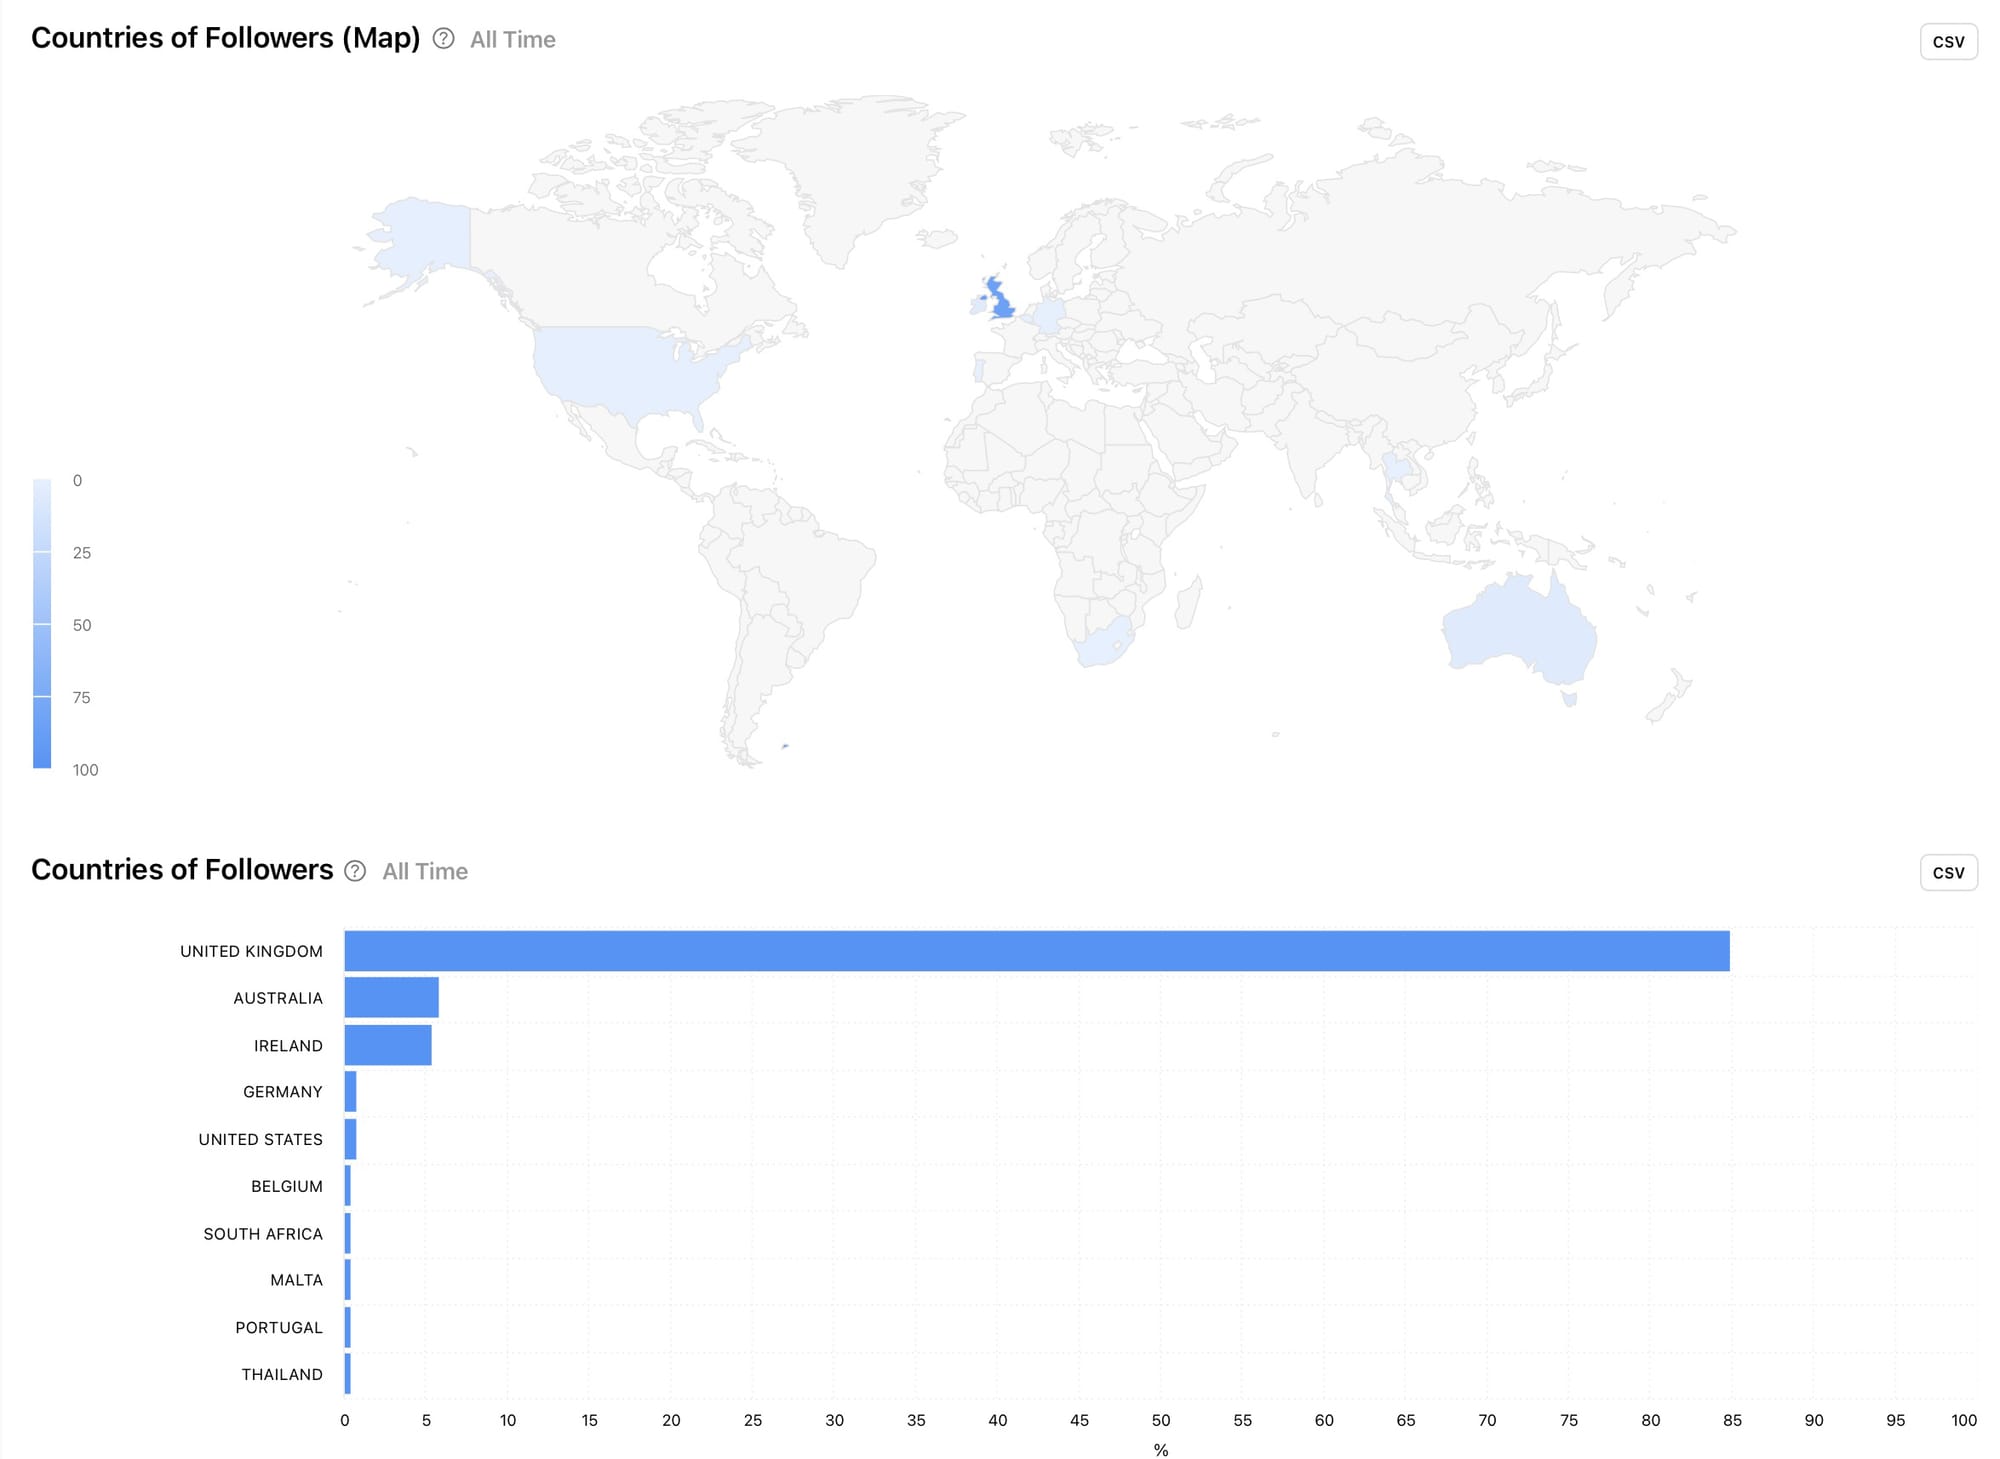
The Countries of Followers graphs show the top locations of your TikTok followers by percentage within the selected date range. You can view this data on a map as well as in a bar chart. The map gives a visual guide to the locations of your followers, while the bar chart makes it easy to pick out the top countries. Are your top locations near each other or spread all over the globe?
4. Countries of Viewers
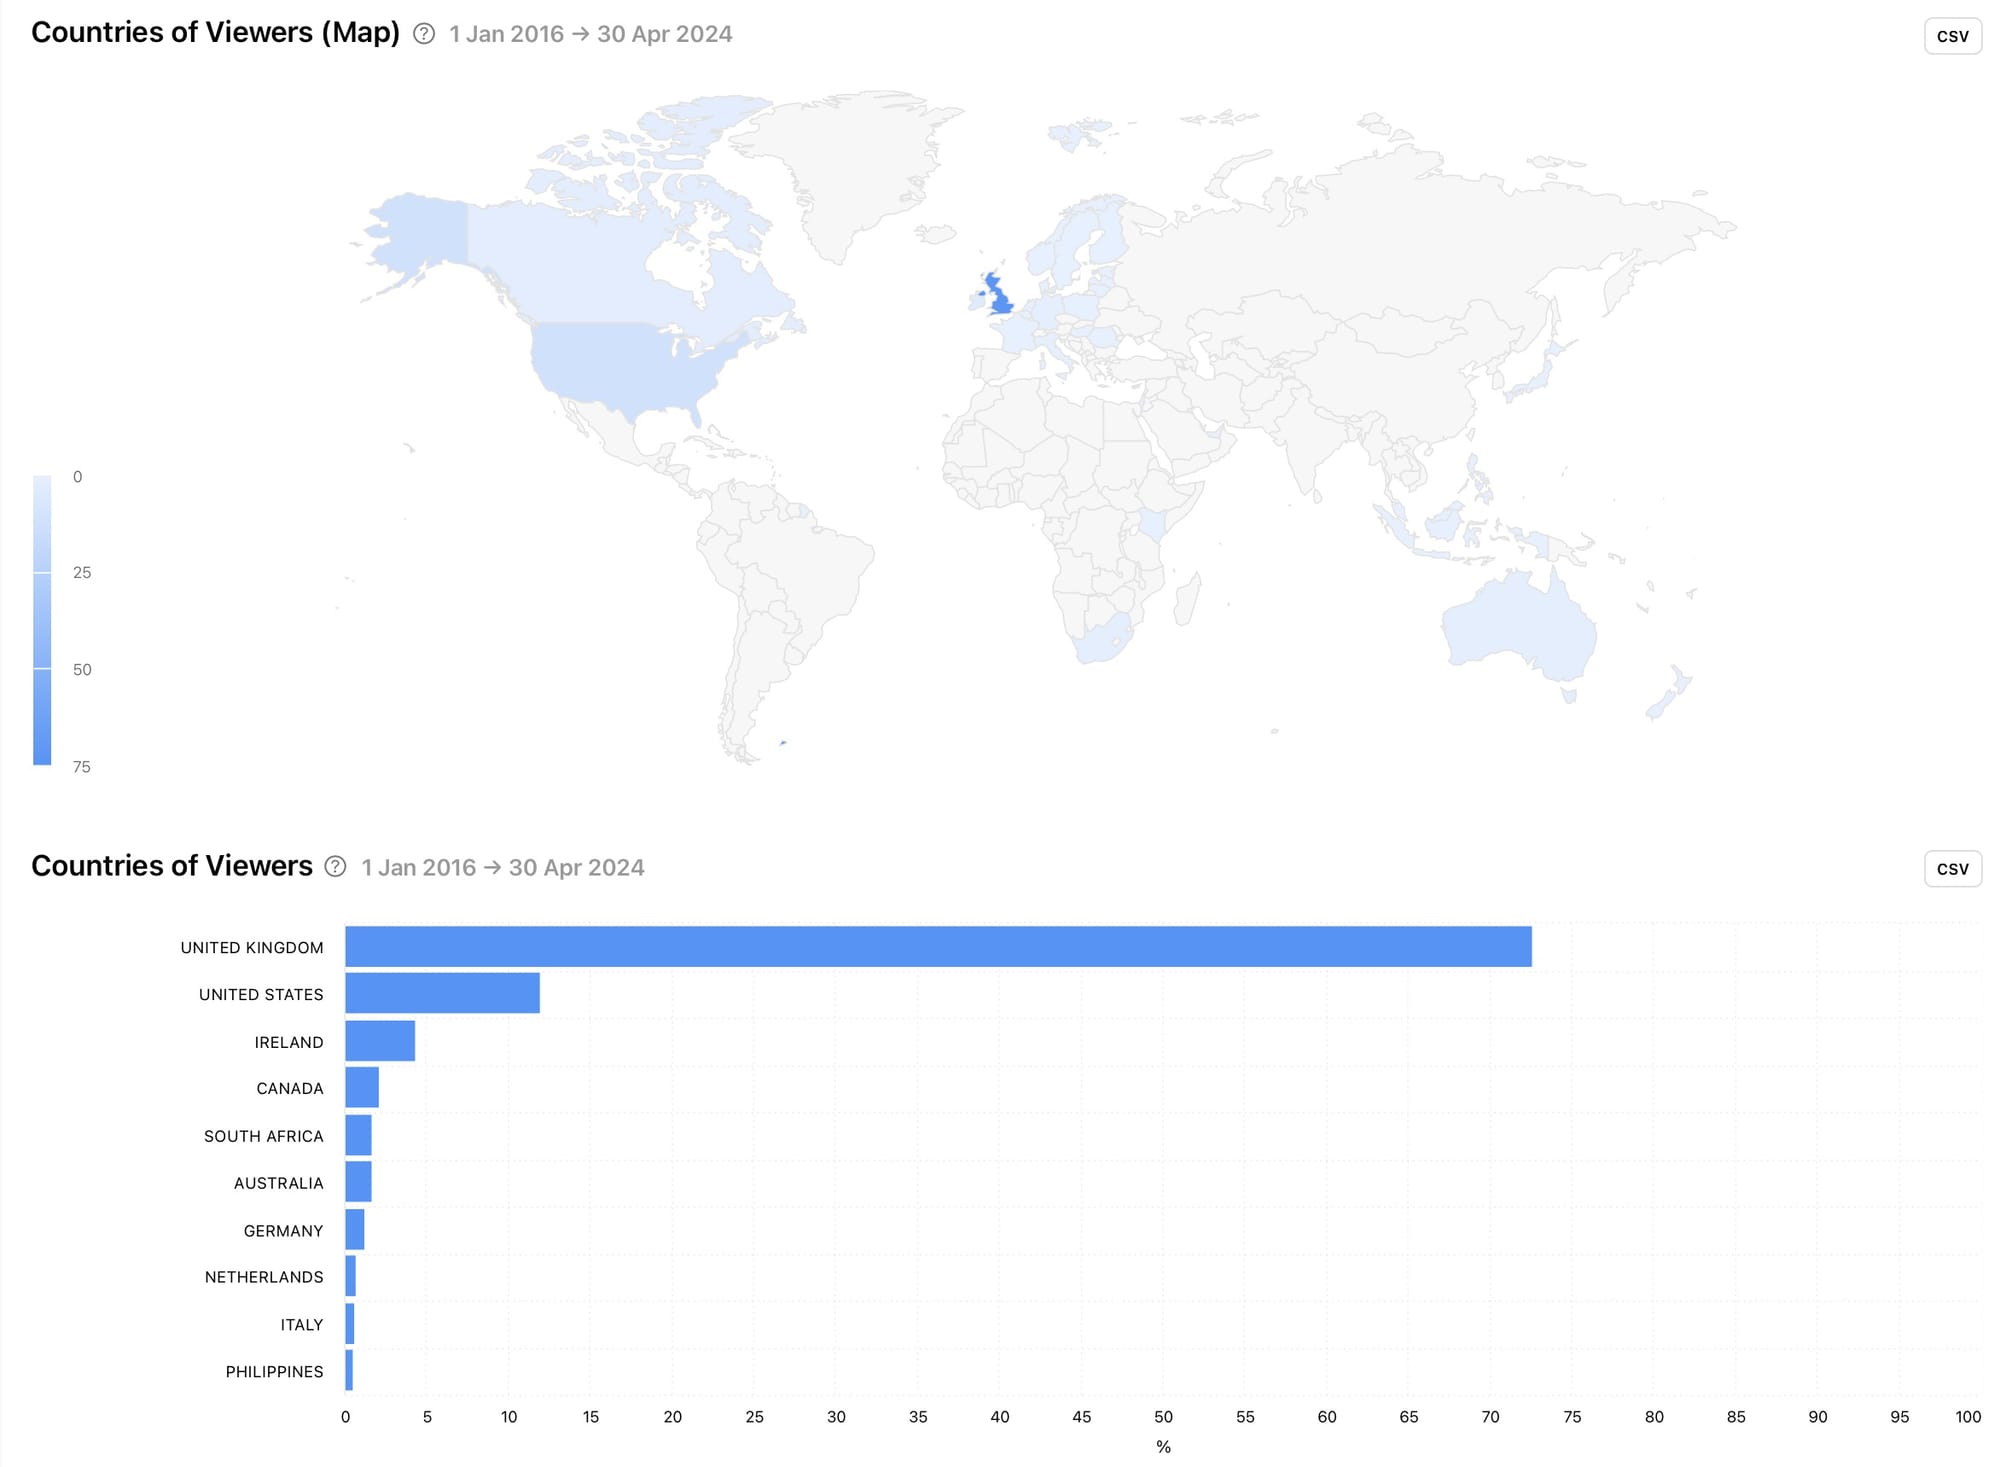
The Countries of Viewers graphs show the top locations of all TikTok users who viewed your content, sorted by percentage within the selected date range. While the previous graphs only take into account the followers of your TikTok profile, these graphs take note of every account that viewed your TikTok content within the selected date range. This gives you a better idea of where your content is being shown. You can use these graphs in conjunction with the previous graphs to determine why some viewers are watching content but aren’t committing to following your profile. Perhaps your content is tailored to be more relevant to some countries than others. This could be down to the languages used, references within the content or topics that connect with specific parts of the world. Could your brand benefit from multiple TikTok profiles, each tailored to a specific location?
5. Followers Online
When it comes to optimising your content on TikTok, one of the easiest ways to do this is to publish content at a time that makes sense for your audience. By knowing when your followers are online, you can select the times and days that are best for publishing content to your audience. People are more likely to respond to and engage with content quickly if they are online using the app when it pops up in their feed.
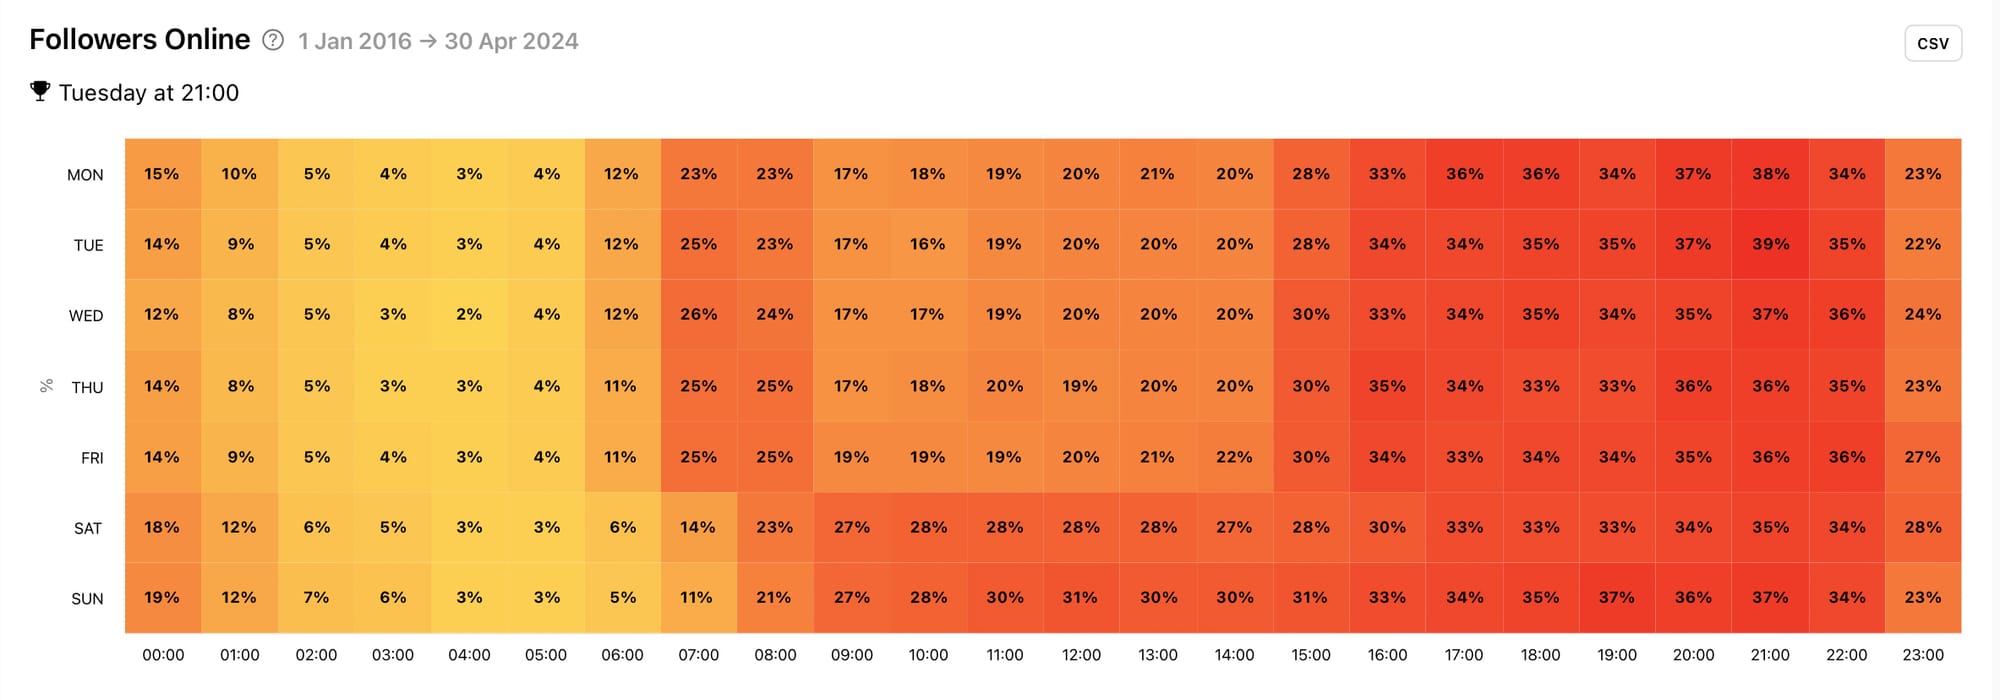
The Followers Online graph shows the times of the day and days of the week when your followers were most active on TikTok within the selected date range. The darker the colour, the higher the amount of followers were online. Each tile in the graph shows the exact percentage of your following that was online at that time. Above the graph, you can see the best day and time to post content to your profile, according to when your followers were online.
With these 5 top demographic metrics to hand, you can tailor the TikTok experience to your audience. This can help boost your views, engagement, relevancy and ultimately your following as a whole. To get access to all the graphs in this article and more, specifically shaped to your unique brand on TikTok, check out Minter.io here - the social media analytics tool for businesses online.
Start using Minter.io now→