How to optimise TikTok content with Minter.io
You’ve spent hours on your latest TikTok video, edited it to perfection, added the latest trending filter, picked the ultimate soundtrack and added captions to highlight the best bits. You hit publish and wait and wait and wait… but minimal views trickle in. Why is it that sometimes your TikTok videos pop off, but this one landed as a big wet flop?
It’s time to get the TikTok results your content deserves. By using optimisation techniques, your content is more likely to be seen by your audience, get engaged with and yield better results overall. By focusing on key timings and connectivity functions, you can aim for less disappointment every time you hit publish.
Optimisation is such an important part of driving success on social media, we’ve dedicated an entire section to it on Minter.io. Let’s have a look at how it works…
Minter.io and optimisation
At Minter.io we want your brand to succeed on social media. We’ve put together a number of optimisation graphs to help this happen. The data is unique to your social media profiles, giving you the confidence to grow online. You will learn to post content at the time when your audience is most likely to engage, while hashtag graphs help you understand which hashtags are most effective for your brand. The more you publish on TikTok, the more information you’ll have at your fingertips, so you can adapt your approach as your brand continues to grow.
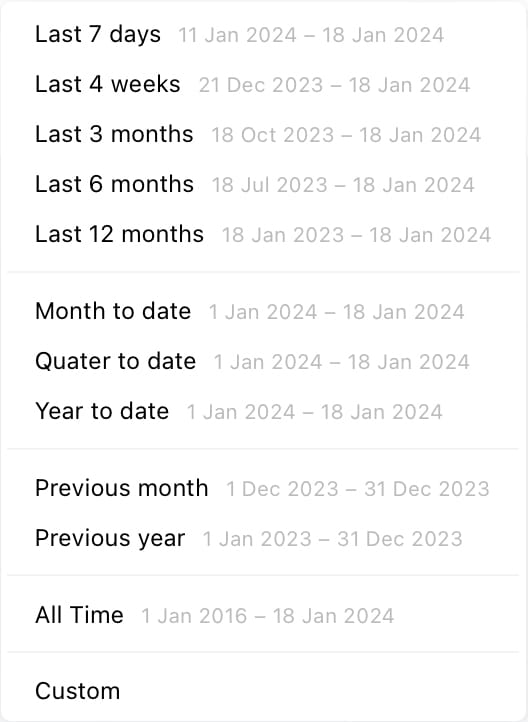
Choose a time frame
Start your optimisation efforts with the date picker. Your graphs will change depending on the time frame you want to draw from. You can optimise your content based on all the content you’ve ever posted by selecting ‘all time’, or find out what’s been working well for your TikTok account within a set time frame. You may want to look at what worked well recently, during a specific campaign, season, quarter, month etc. Choose a preset or fully customise the time frame. You can do all this with the date picker.
Best Time to post
The Best Time to post graph shows the average engagement rate of TikTok content published at specific times and on specific days of the week within the selected date range. The darker the colour, the higher the average engagement rate of content published within that time window. The number written over each tile represents the average engagement rate percentage. For example, TikTok content published on Monday at midnight totalled an average engagement rate of 9.3%.
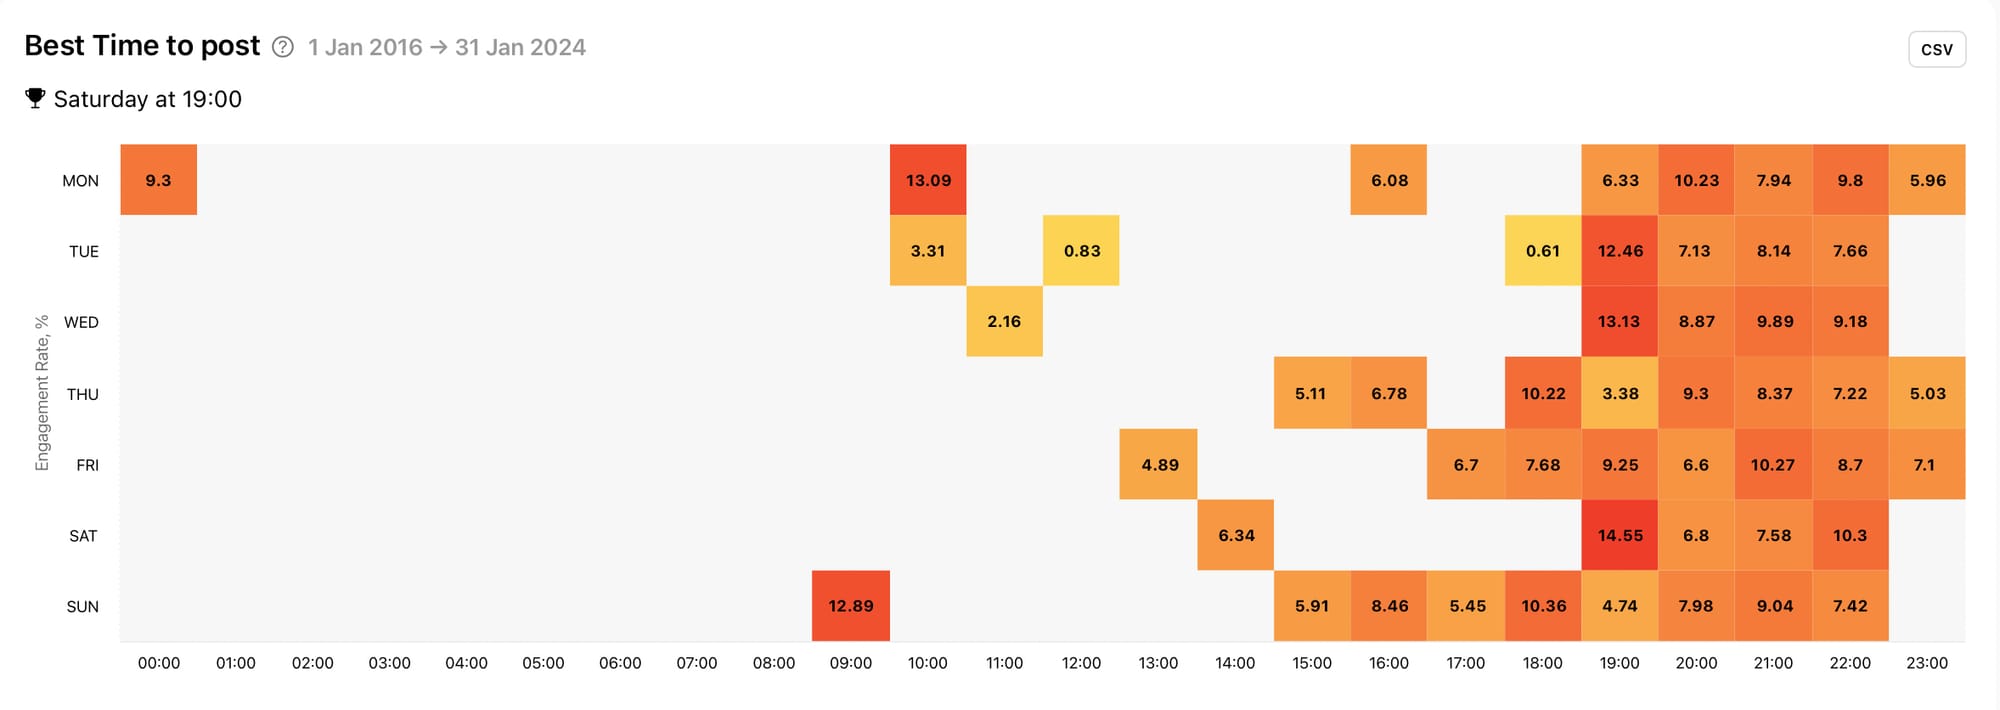
To make it super easy to pick out the best time to post for your brand, above the graph is the day of the week and time of the day that gained the highest average engagement rate. In the example above, Saturday at 7pm is the best time to post for this profile.
Top Hashtags by Interactions
The Top Hashtags by Interactions graph shows the top hashtags within the selected time frame sorted by the total number of interactions. Interactions include likes, comments and shares. This data is taken directly from the hashtags you’ve used in your content, so it’s easy to find the hashtags that are currently working best for your brand, as well as hashtags that aren’t connecting as well.
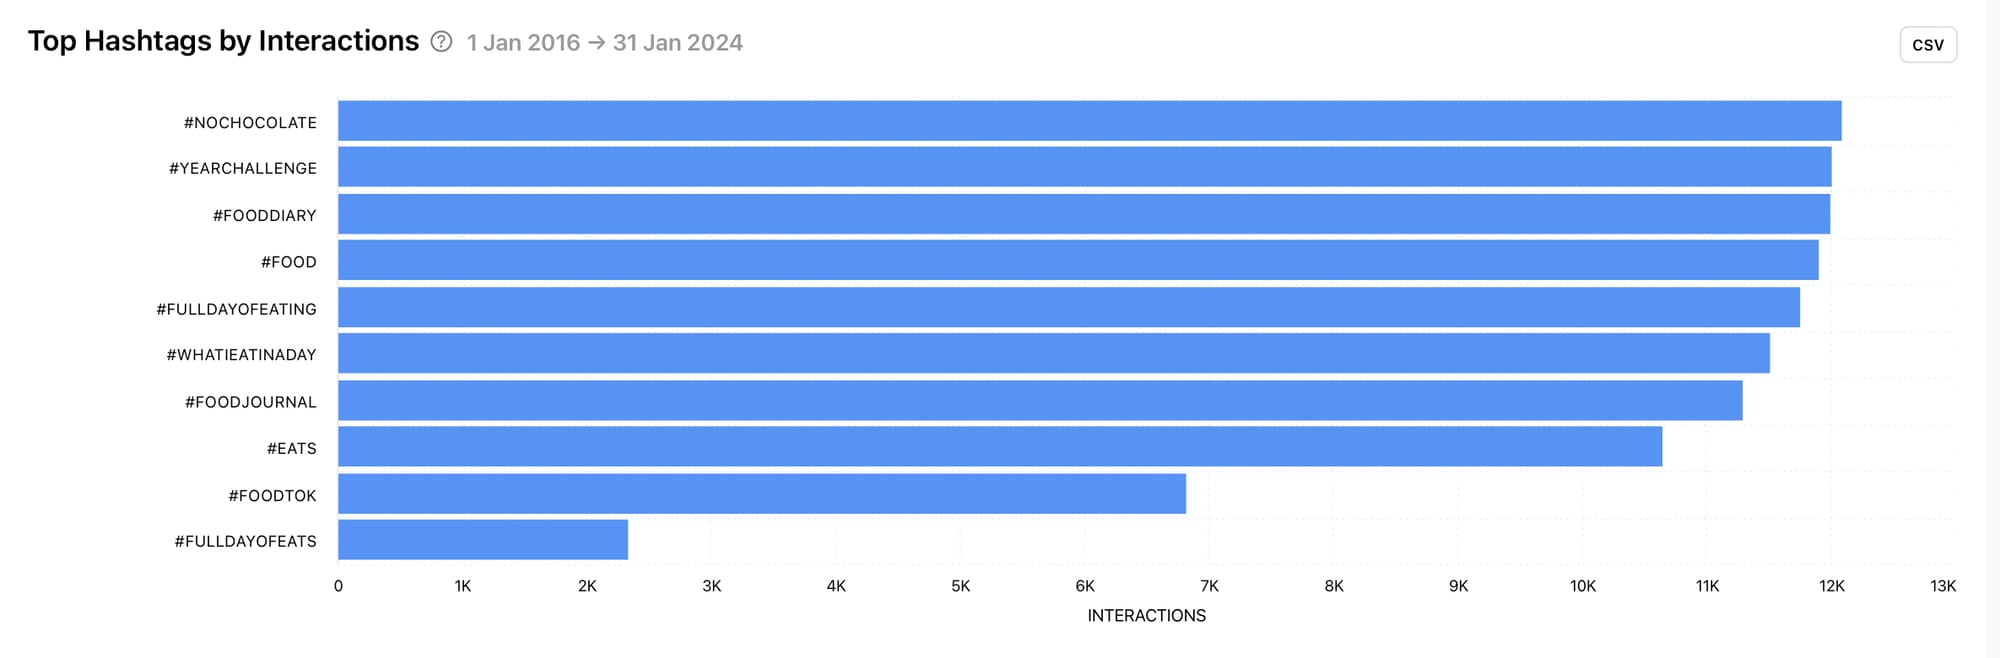
Are you regularly using your top hashtags? Are there hashtags you are using that aren’t doing much for your visibility? You could research popular, niche or trending hashtags to find more hashtags to bring into the fold and see how they affect this graph.
Most Effective Hashtags
The Most Effective Hashtags graph shows the top hashtags within the selected time frame sorted by the average number of interactions. Interactions include likes, comments and shares. When used in conjunction with the previous graph, you can find a powerful combination of hashtags that are pushing the needle in the right direction for the growth of your brand on TikTok.
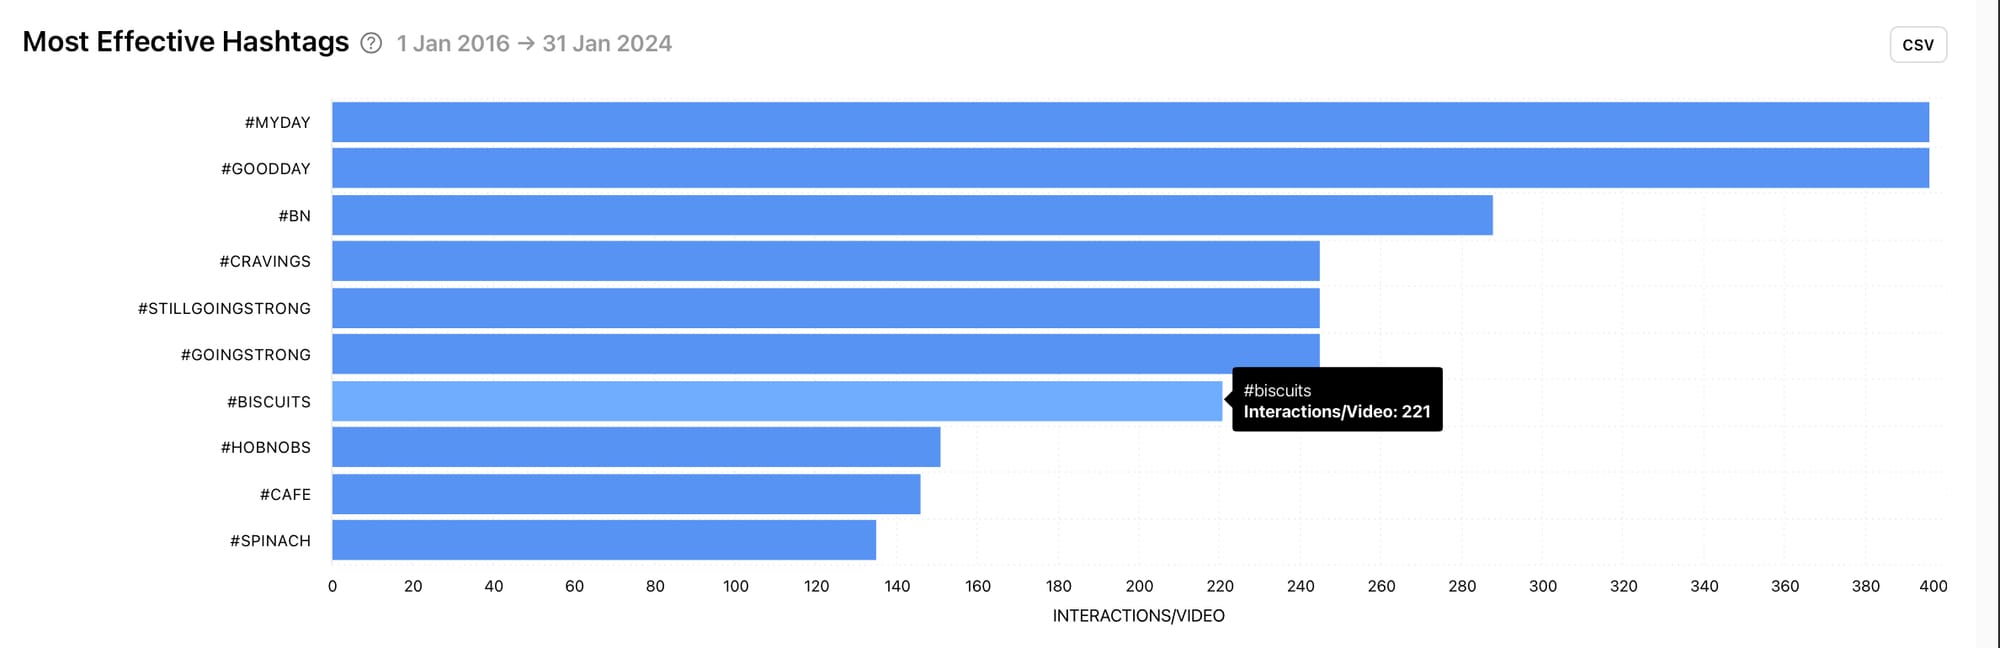
Hover over a bar in the graph for more information. In this graph and the previous graph, hover over a bar to view the exact number of interactions gained by the specific hashtag.
Number of Hashtags
The Number of Hashtags graph shows the number of videos published within the selected time frame, grouped by the number of hashtags used on these videos. This can give you an idea of what you’re regularly adding to your content descriptions to provide clarity.
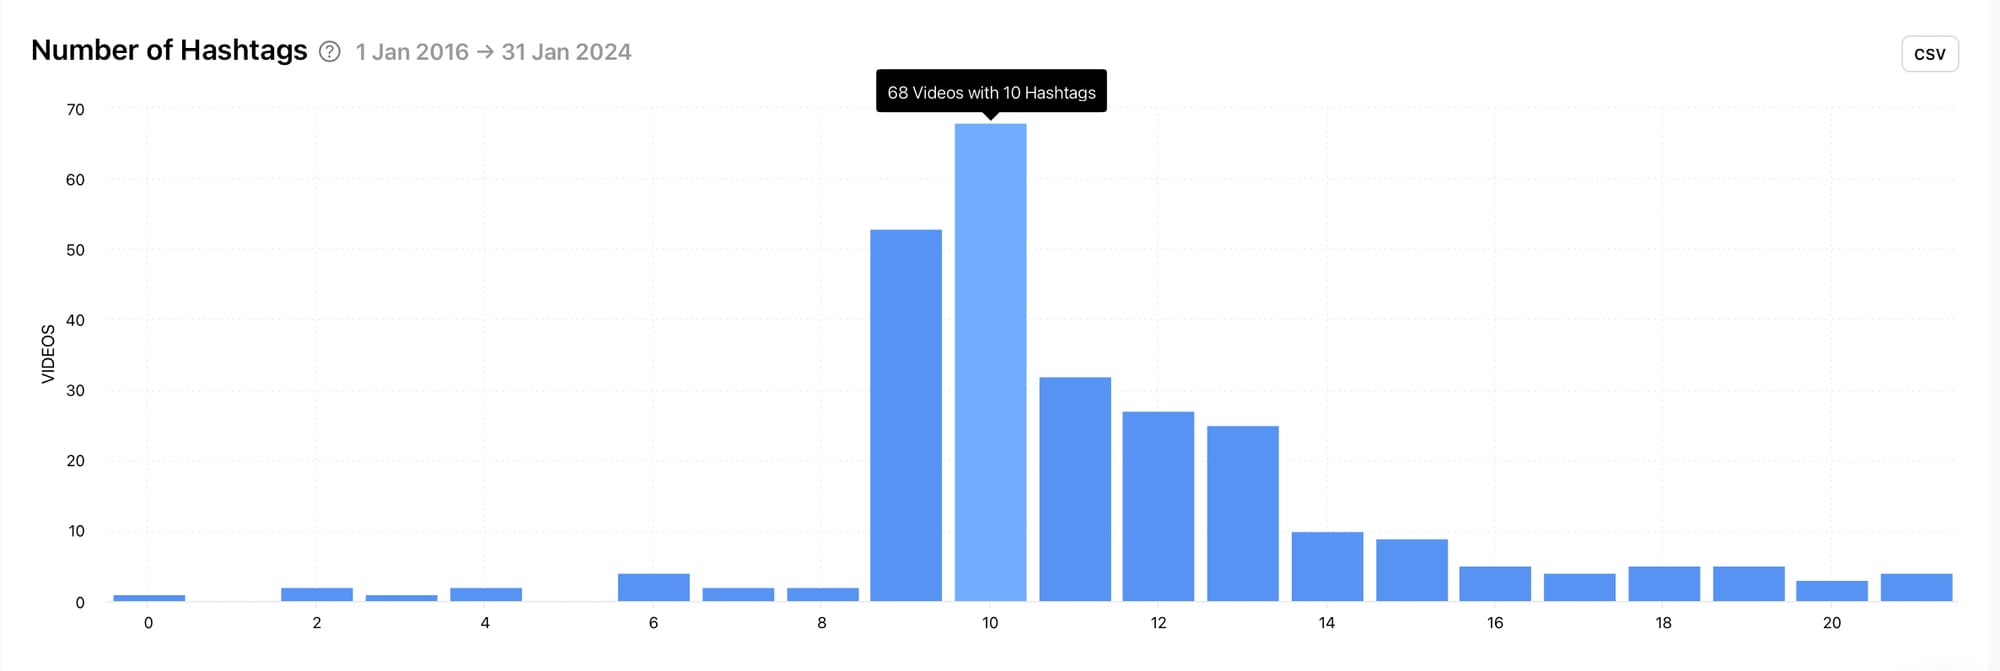
How often are you using hashtags? How is this affecting the amount of people finding and connecting with your content? More hashtags doesn’t necessarily mean more effective connection, so use this graph in harmony with the previous 2 graphs to find the sweet spot for your brand.
How to start from scratch
If you’re a brand new TikTok profile and don’t have any data to hand, start by researching best practices and experiment from there to start building your audience. Different target audiences are likely to shape the data in significantly different ways, so what works well for one brand might not work well for another. Think about who you’re trying to reach, who would connect with your TikTok content, when those people are likely to be online and which hashtags they’re likely to already be acquainted with. This will inform your choices at the beginning of your journey. TikTok may suggest hashtags to try and you can always do a quick search on the platform to find hashtags your content is relevant to and would fit in well with.
The more content you publish, the more data you’ll have to draw from. This will help you come to accurate conclusions about what is and isn’t working for your brand.
Isn’t it about time your TikTok content got the attention it deserves? Head over to Minter.io now to access all the graphs from this article, loaded with your unique data.
Try Minter.io now!→