How to get more likes on TikTok using Minter.io

Likes are the lifeblood of social media, keeping the online community flowing and growing. They are currency; bargaining chips for big brand deals, partnerships and sponsorships. They are a magic mirror, reflecting and proudly displaying popularity, value and social proof. We all want more likes on TikTok and there’s good reason for it. Not only is the like count a positive marker for engagement on content - more likes often equates to more reach, more customers and more sales. Now we’ve outlined what makes likes so great, let’s get more of them!
Here’s your guide on how to use Minter.io to get more likes on TikTok…
Understanding data with Minter.io
Minter.io collects data on your social media metrics, so you can accurately assess what is and isn’t working for your brand. Data about your audience and content alongside information on optimisation can help you understand what’s happening under the hood of your social media accounts, so you can drive your strategy to destination success.
The approach of using Minter.io data to increase the amount of likes on your content is based on your unique profile and what is currently working well for your content and your audience. With your unique data, you can learn what your audience is already responding well to so you can replicate, tweak and perfect the ideas and techniques likely to grow your like count on future content.
Here are 3 steps to get started…
1. Learn from your content
Discovering which of your TikTok videos gained the highest amount of likes can provide insight into the kinds of content your audience responds well to.
How to find your content with the highest like counts:
- Go to Minter.io and select your TikTok profile.
- Choose ‘Content’ from the menu on the left-hand side of the screen.
- Scroll until you reach your TikTok videos sorted by your chosen metric.
- Choose ‘by Likes’ from the drop-down menu.
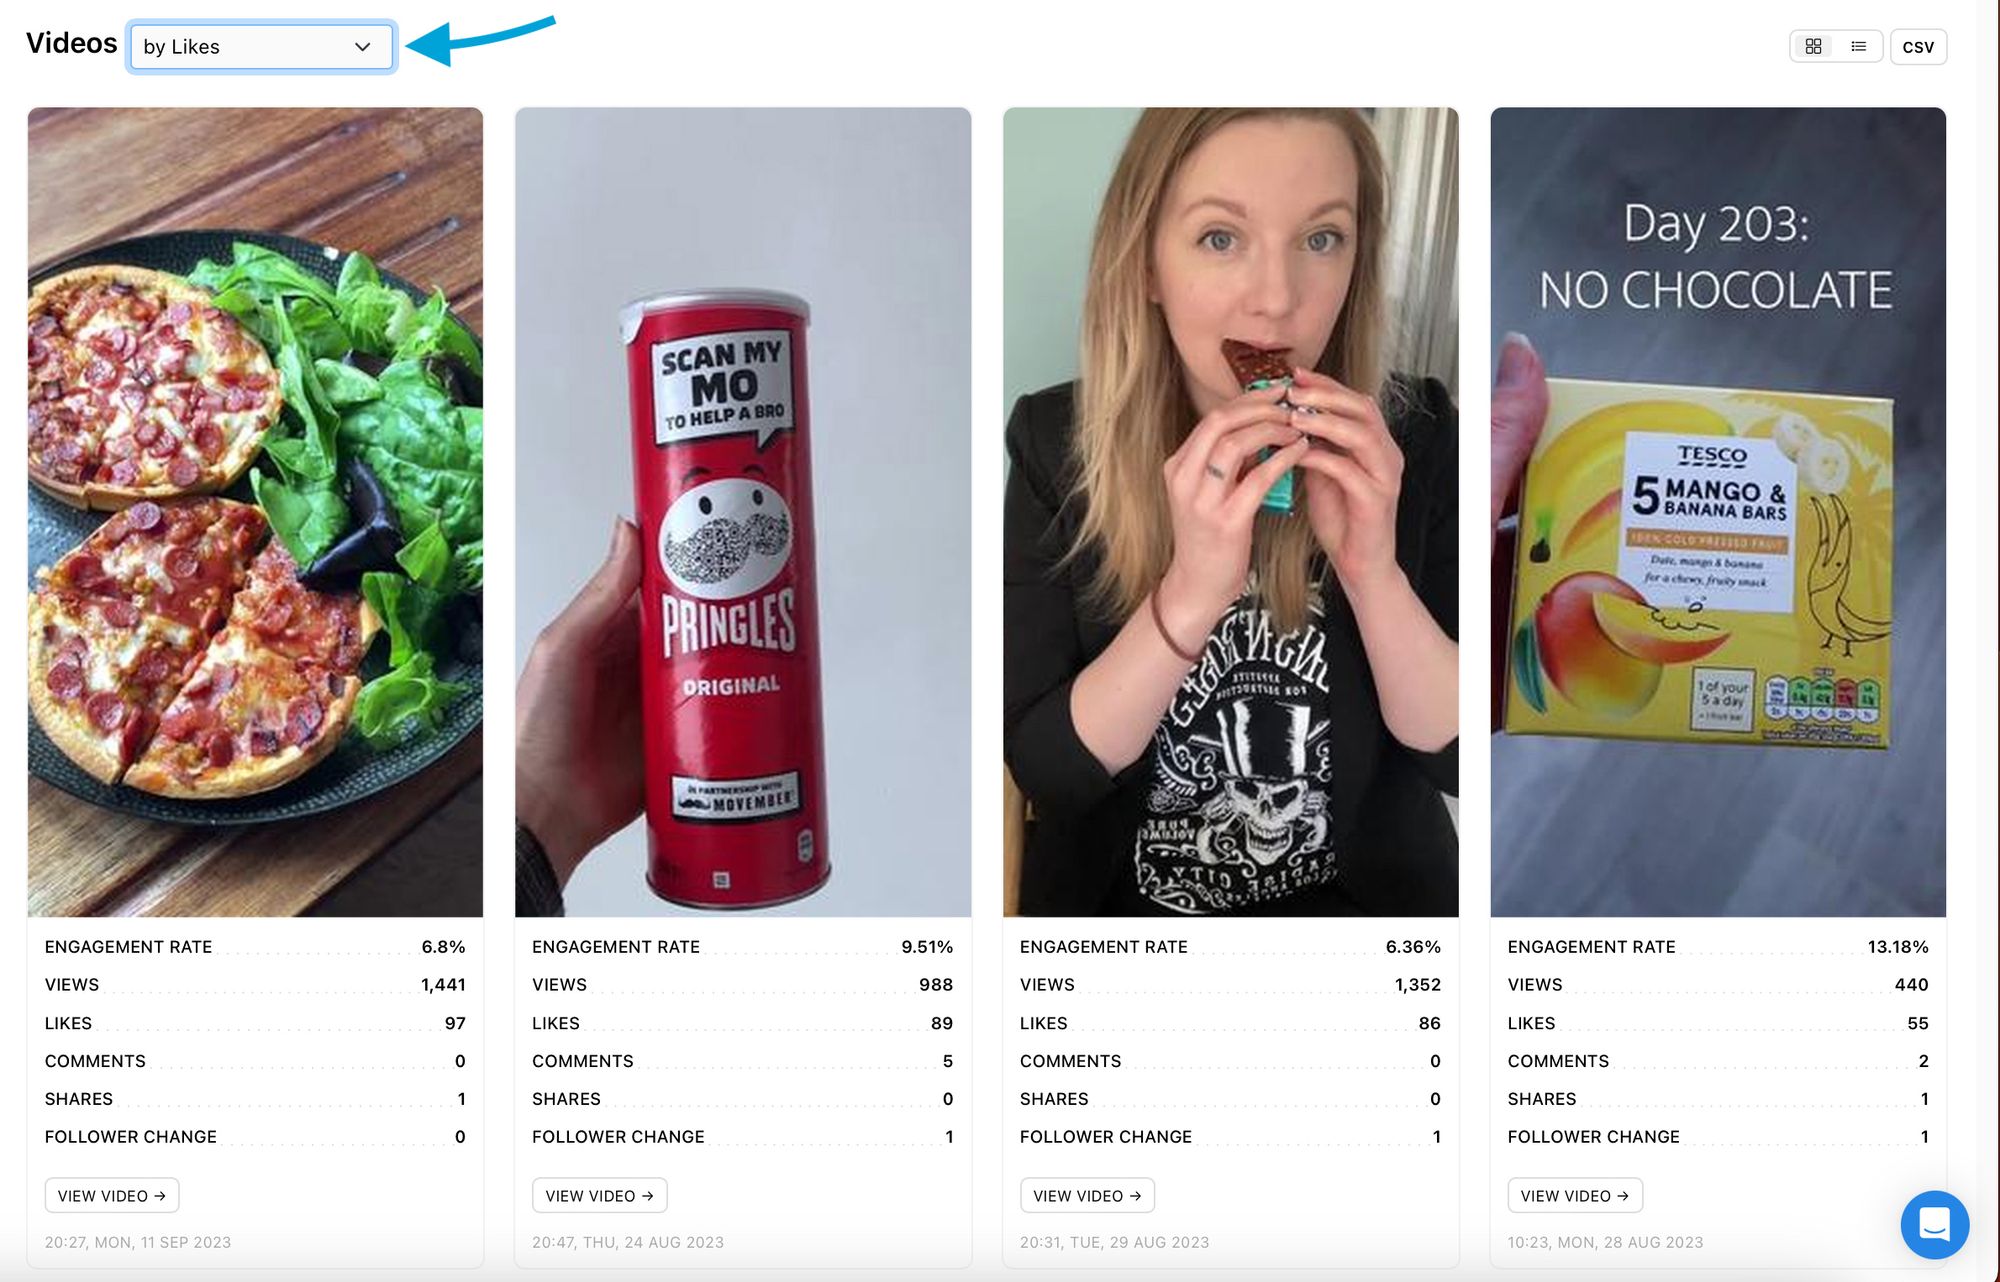
Now you are viewing your content from the highest like count to the lowest. Check out the first video and the first row. Do these pieces of content have similarities? If so, pay attention because they’re clearly working in your favour.
When looking at your highest-performing content, take note of the:
- topic or theme
- subjects (people, animals or objects in your video)
- filming location or background
- filming style
- editing style
- title
- cover image
- colours
- emojis
- text overlays
- audio choice
- templates
- filters
These elements can give you clues as to what your audience engages with. Maybe your content with the highest like counts used the same filters and effects, or a text overlay in a particular colour. Perhaps you jumped on a trend and that type of trend fitted well with your brand. Understanding the makeup of your content can help you create more content likely to get your desired result - a higher like count in this case.
2. Discover more graphs for more context
The graphs you scrolled past in the previous step can provide more insight into the bigger picture surrounding your TikTok content. Check out the likes, videos and video engagement rate graphs to give further context to your rising and dipping like count. You can also use other graphs to determine which other metrics spiked at the same time(s) as the likes graph, alongside noting trends such as a few days with a high amount of likes, cultural events and specific marketing agendas across certain days and time periods.
The amount of likes on a given day can be influenced by factors other than a single piece of content performing well. In the example below, we can determine that on the day when views where at their highest, the amount of TikTok videos increased as well, making this a defining factor in the high amount of likes on that day. This suggests that posting more regularly at the current video quality could increase the overall amount of likes for this account.
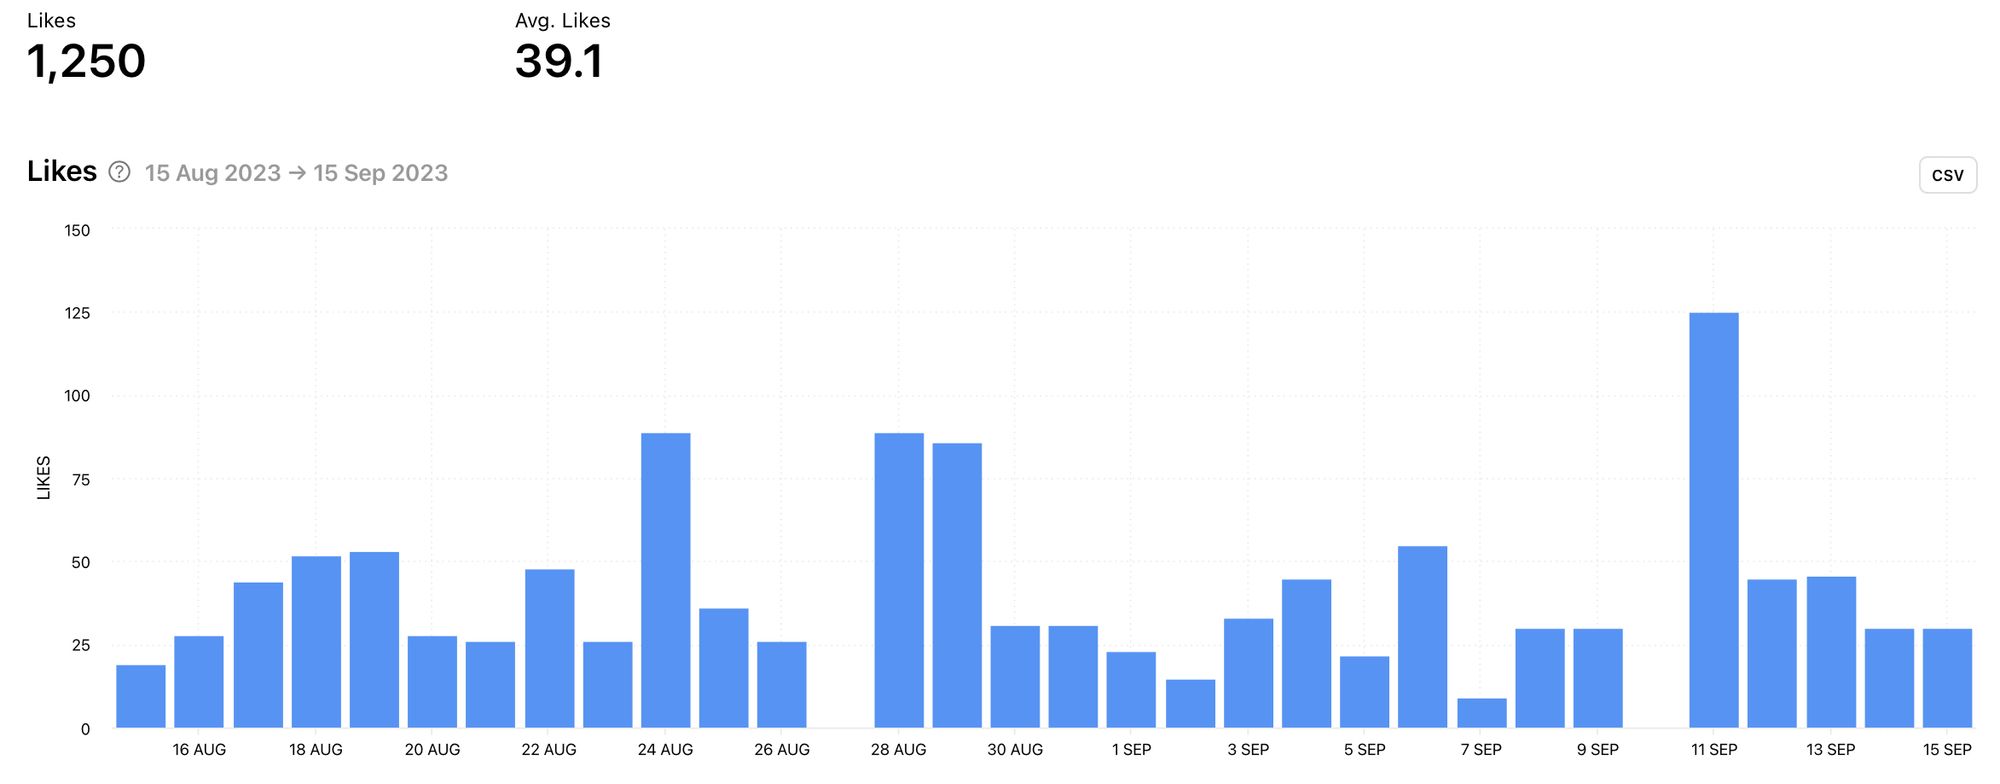
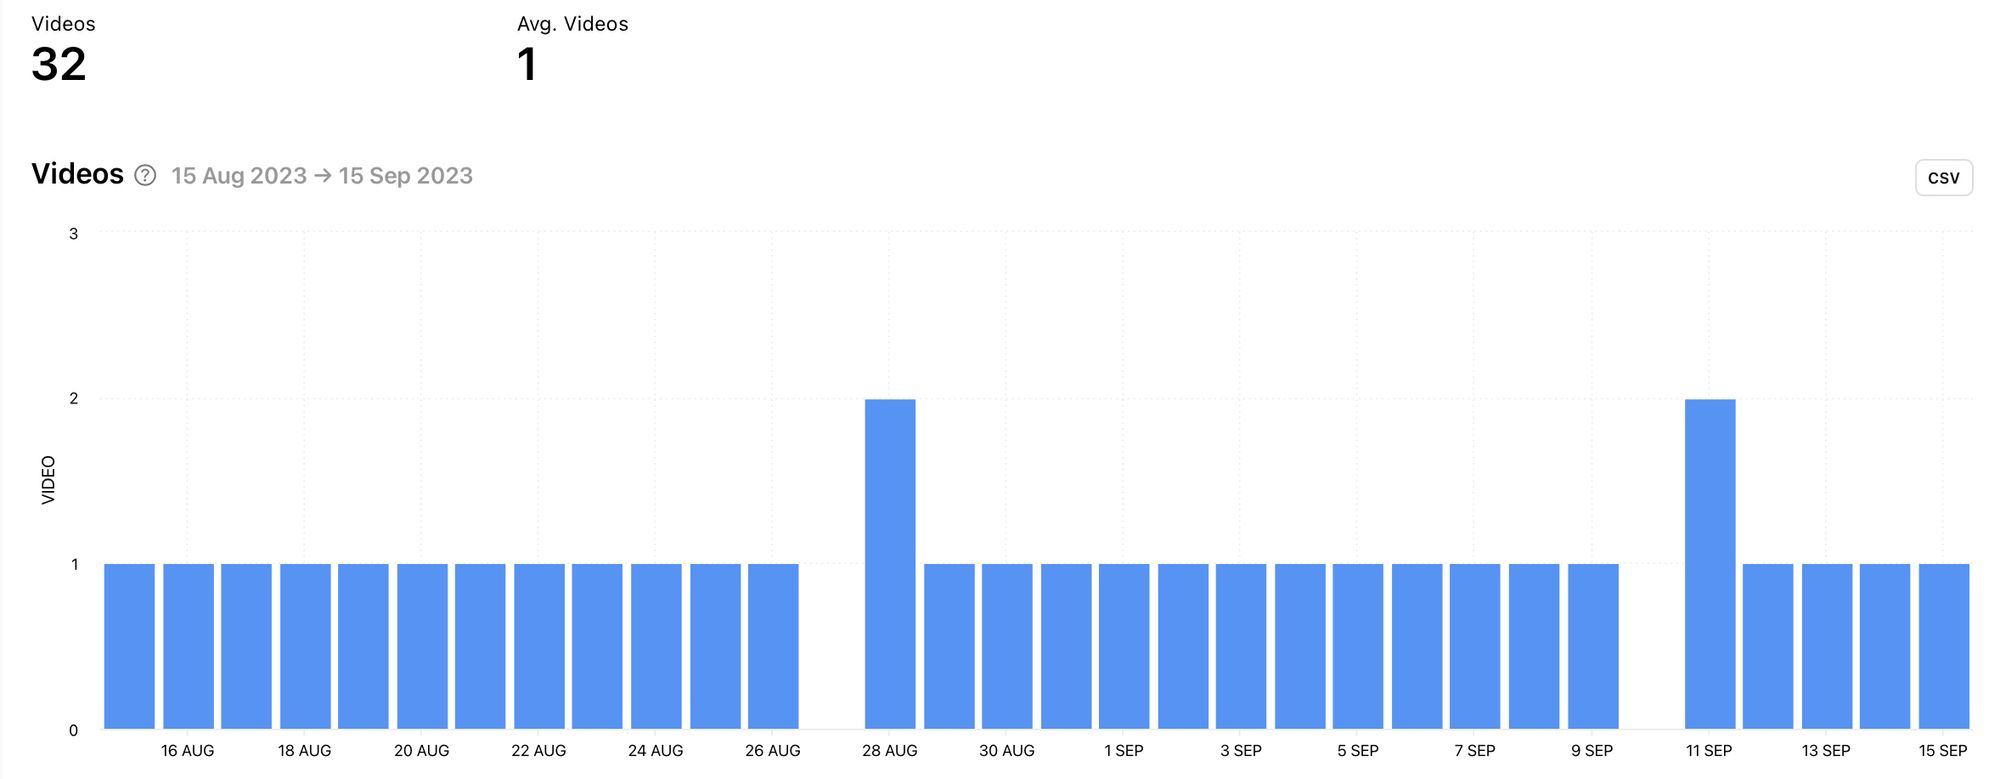
Likes graph (left) and Views graph (right) by Minter.io
Is the amount of likes on your account influenced by other factors? How does posting more frequently, creating seasonal content or jumping on trends affect the amount of TikTok likes? Experiment to gain more data and grow your understanding around your audience's preferences through engagement metrics.
3. Expand with additional dynamic features
We’ve covered the main graphs associated with the like count, but there are countless other factors that could be playing into the amount of likes you’re currently gaining on your content. By having more data to hand, you can make more informed decisions designed to boost your likes on TikTok.
One key feature to be aware of is the 72 hour data feature.
How to access 72 hour data on Minter.io:
- Go to Minter.io and select your TikTok profile.
- Choose ‘Content’ from the menu on the left-hand side of the screen.
- Scroll until you reach your TikTok videos sorted by your chosen metric.
- Select one of your TikTok videos.
- Scroll down to view graphs with 72 hour data.
Here you can find 72 hour data for views, likes, comments, shares and followers.
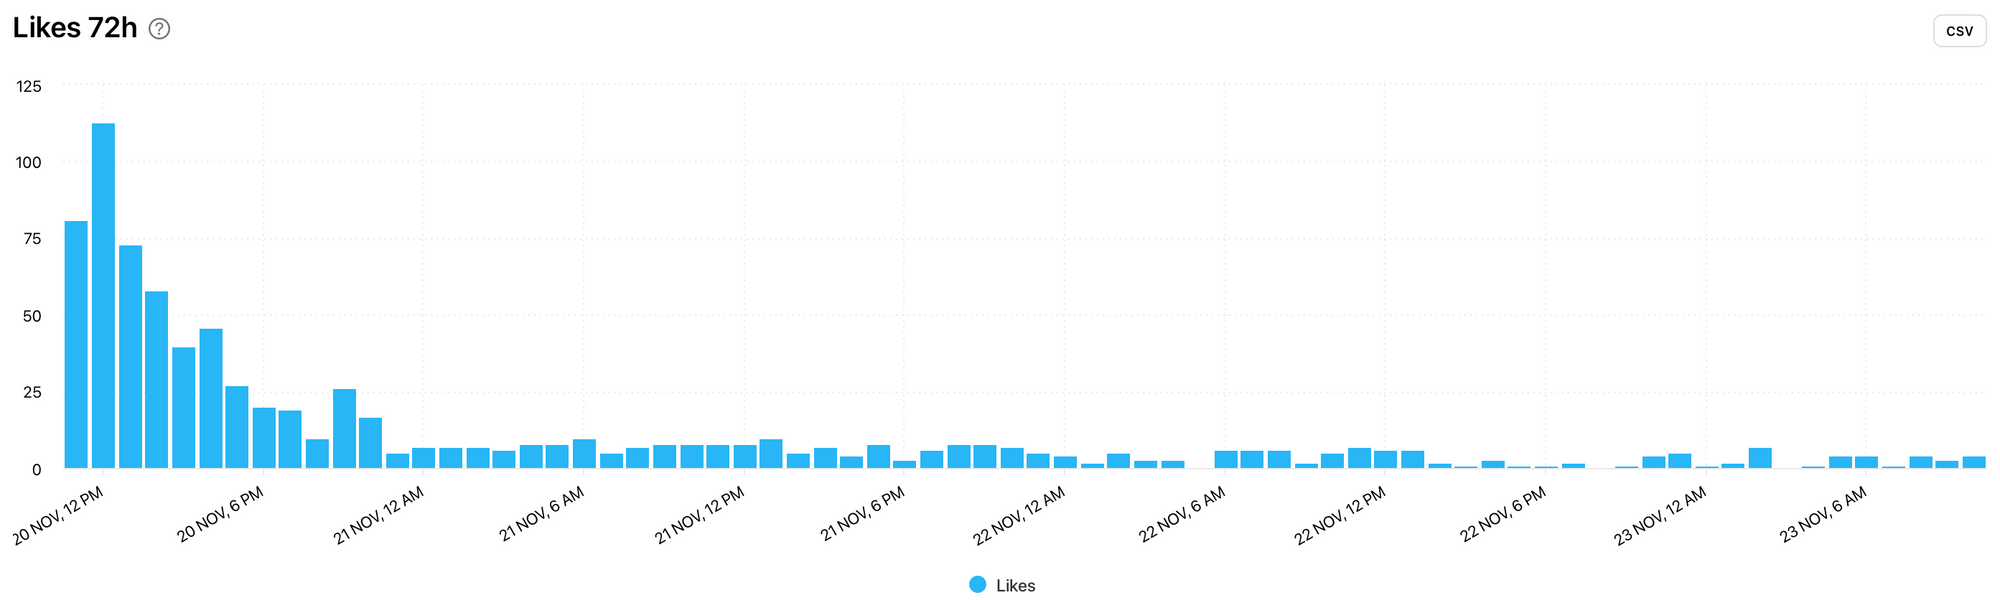
Looking at the example above, we can see that the vast majority of likes were gained within the first few hours of publishing the content. This suggests that content that got a high amount of likes was posted at an optimal time. Alternatively, it could mean that posting content at a time when more of the following is online or likely to engage with the content could result in a higher like count.
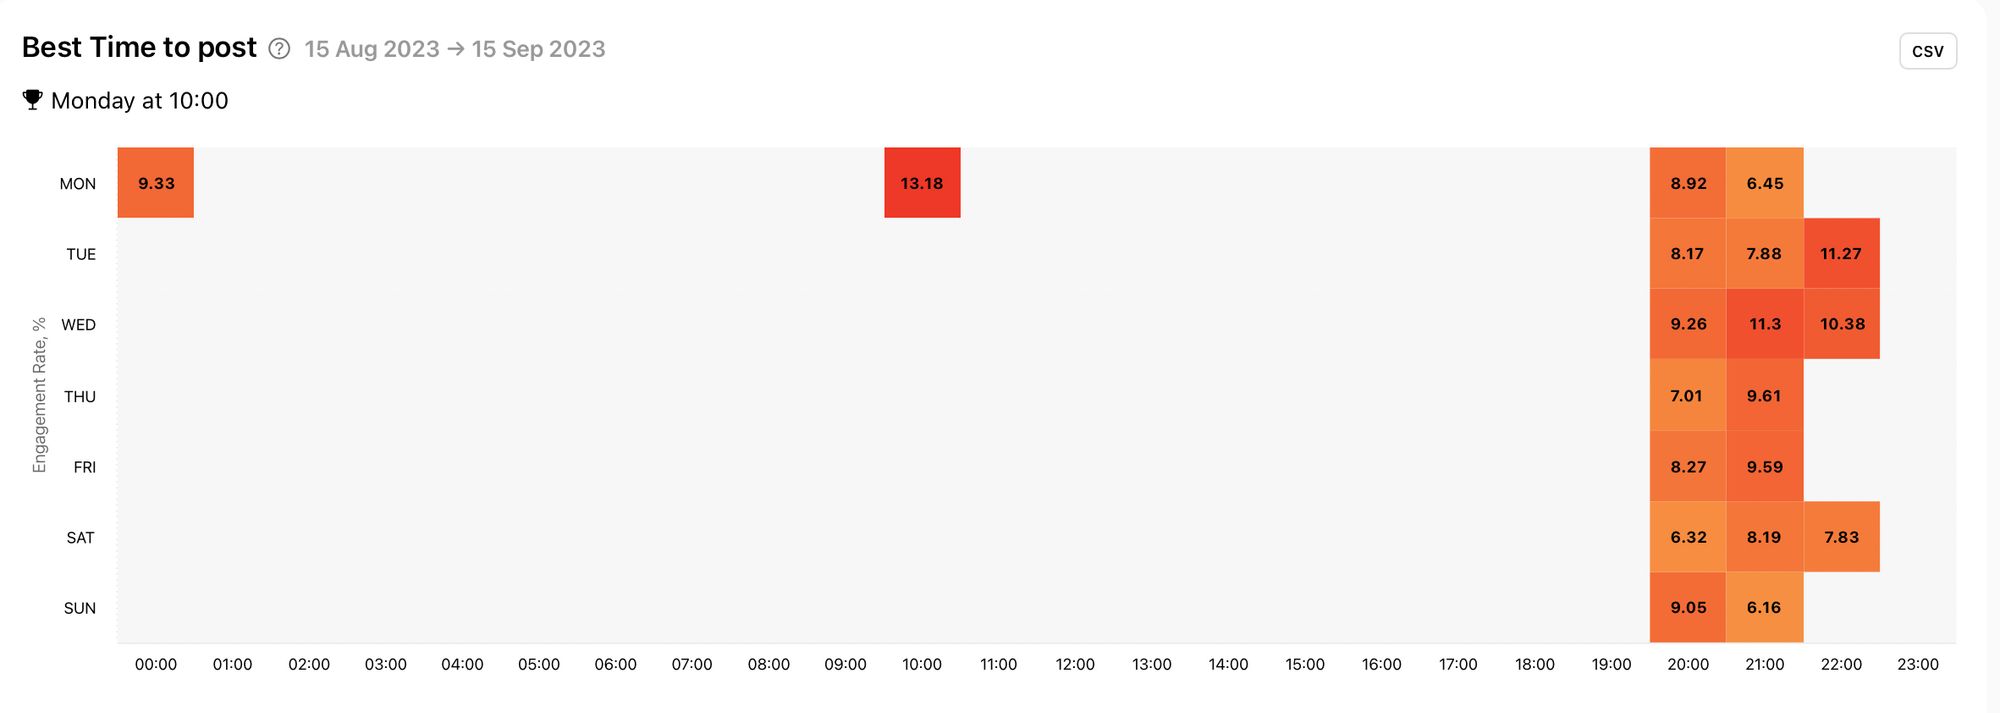
Armed with this knowledge, we can venture into the optimisation section on Minter.io by selecting ‘Optimization’ from the menu on the left-hand side of the screen. This features the best time to post graph, helping you publish content at a time that works well for your audience, so you’re more likely to get the high like counts you’re looking for.
Get more likes with the help of powerful features by Minter.io - the social media analytics tool for businesses online. We hope you really like it.
Try Minter.io today!→