How to get ahead of your Facebook competitors with Minter.io
You don’t need to be a secret agent to spy on your Facebook competitors’ insights. All you need is Minter.io - the social media analytics tool for effective business strategy. In this article, we’re exploring 4 big ways to use your competitors’ data to build your social media presence; turn their wins into your growth system, use their losses to avoid missteps and harness their data to shape your strategy.
1. Make sure the Facebook Page is worth copying
The first absolutely critical step is to make sure the Facebook Page you’re about to explore isn’t in decline. If you want to have a successful business presence on Facebook, do not follow techniques from failing Facebook Pages. A business growing steadily or on the rise is the perfect place to find strategies worth stealing.
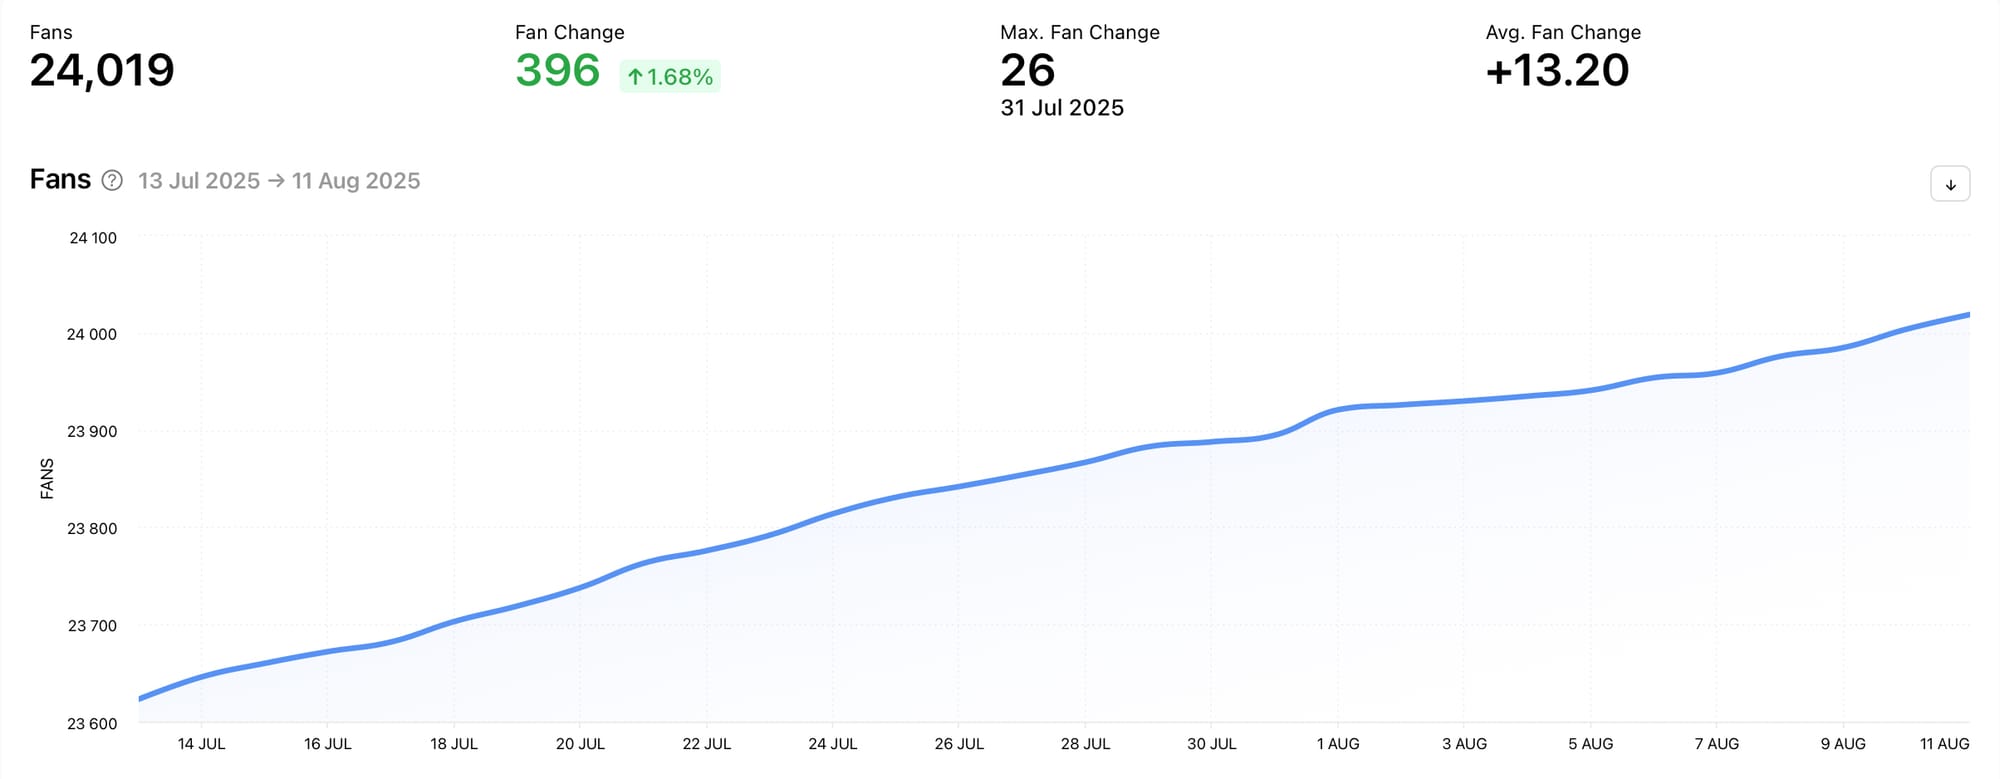
The must-see graph to determine whether your competitor is worth copying is the Fans graph, which shows the amount of fans a Facebook Page has over time. To determine whether the competitor you’ve chosen has insights that will help your business presence grow, view the trend of the graph. If the line is steadily or steeply increasing - building over time - continue on your quest to find treasure in their insights. If the amount of fans is falling over time, this might be a Facebook competitor to avoid getting masses of inspiration from, except to sidestep their mistakes.
2. Look for positive anomalies
Once you’re sure your competitor is growing on Facebook, look out for posts, techniques, strategies and times that are helping them gain an engaged and happy following. There are a number of graphs by Minter.io that can help you find positive data that breaks the mould.
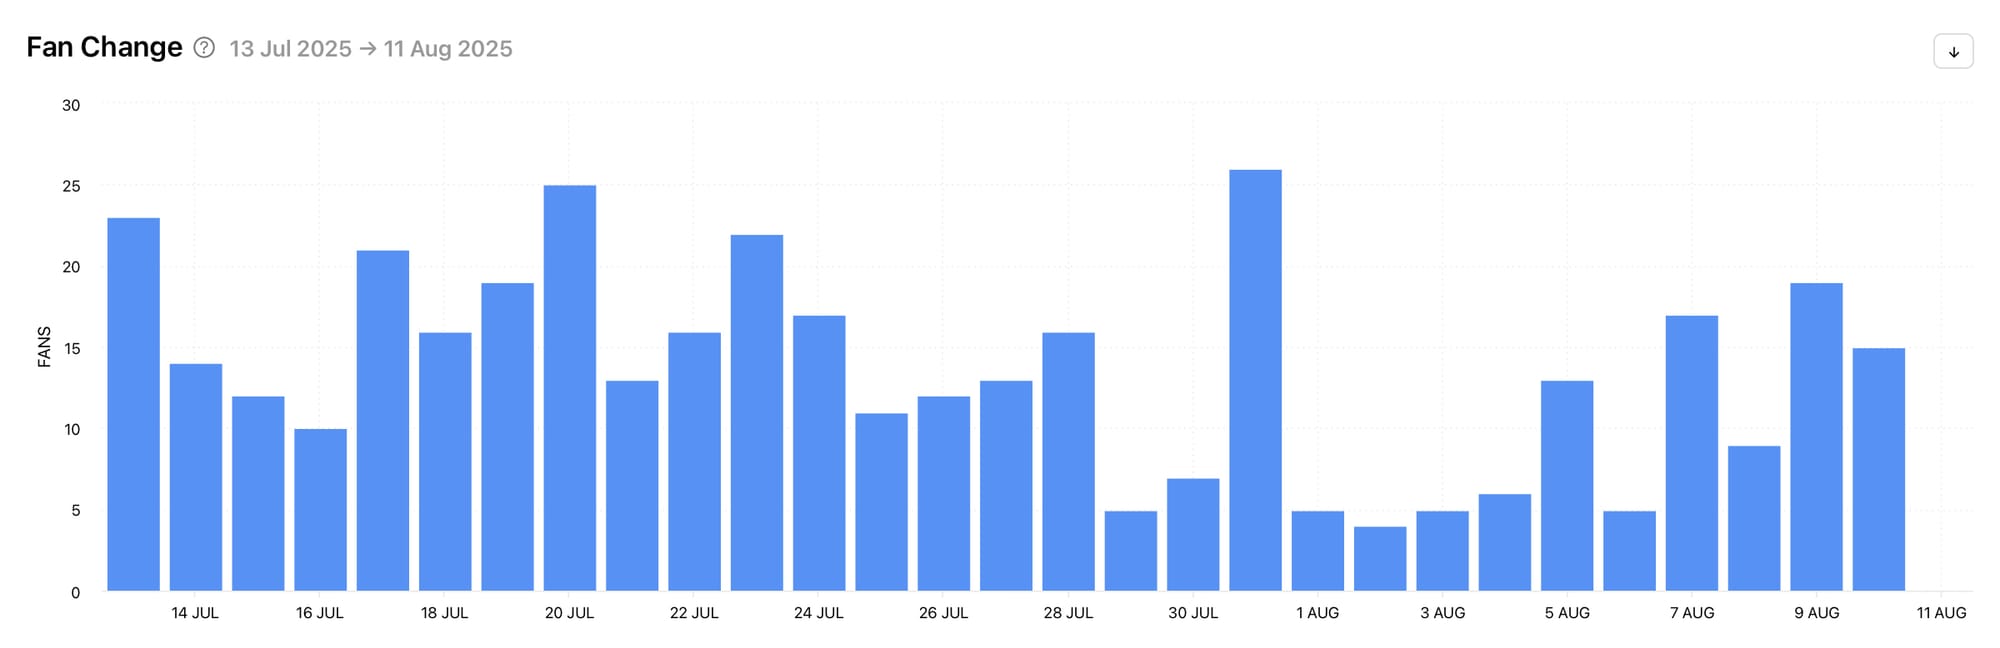
In the Audience section of the Facebook Page competitor data on Minter.io, find the Fan Change graph. Think of this graph as a more detailed breakdown of the Fans graph we previously looked at. The Fan Change graph helps you pinpoint days, weeks or months (based on the selected settings) when your competitor gained more fans than usual. Look for spikes in the data to determine when your competitor had positive outliers.
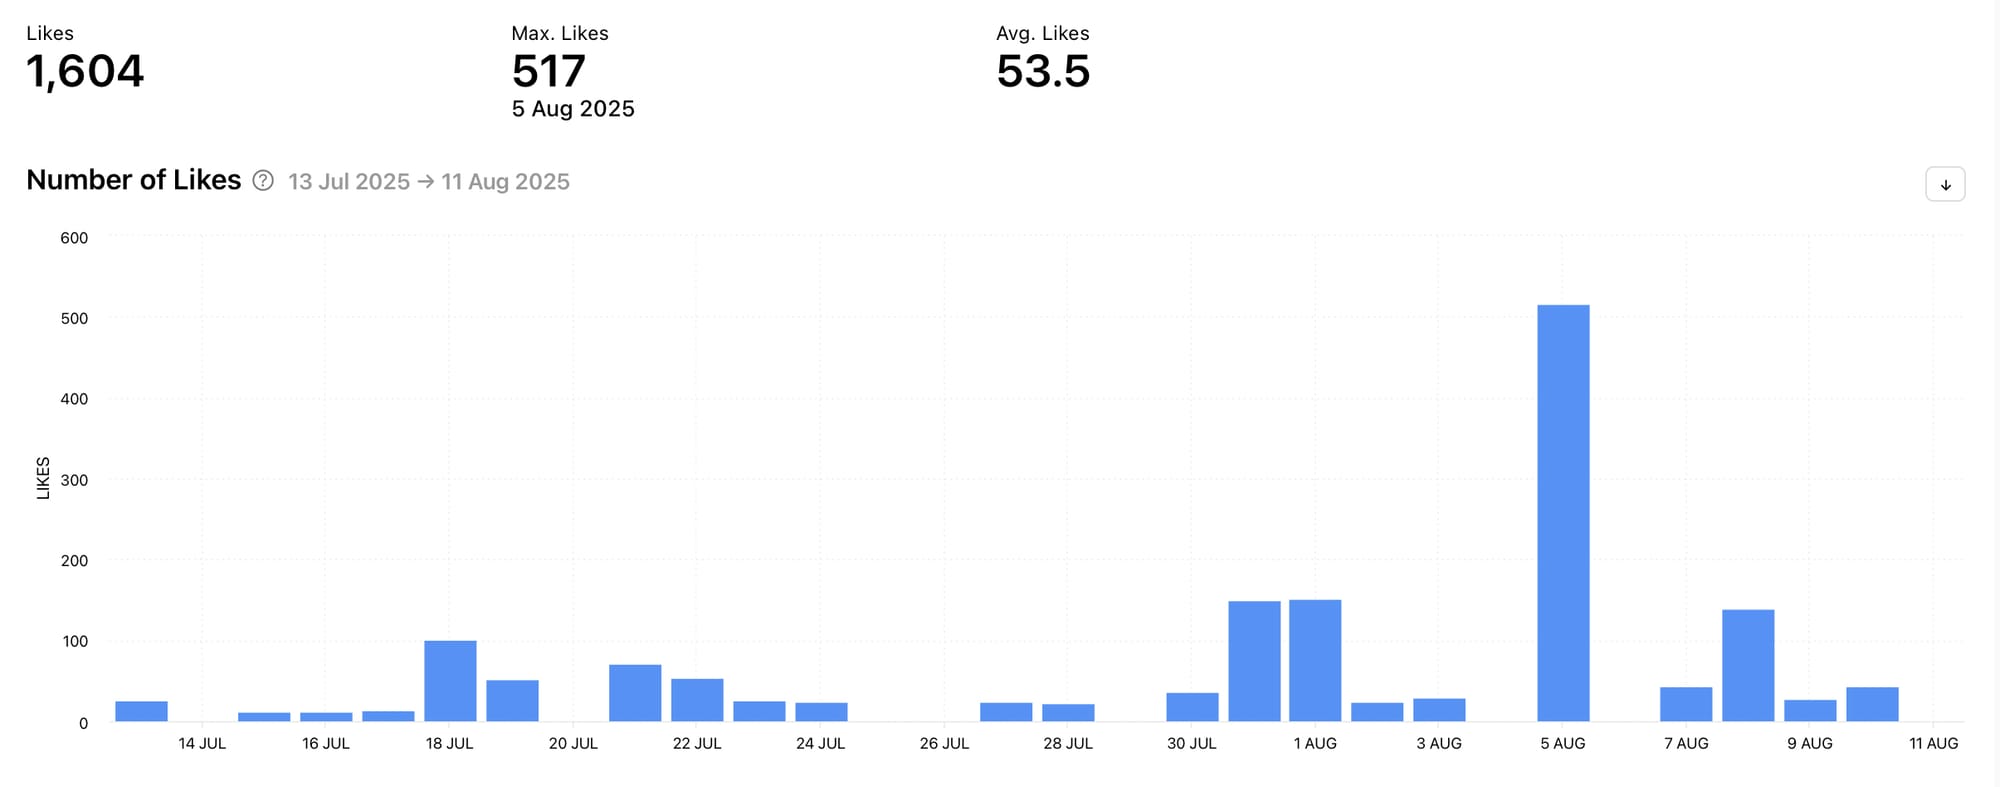
Then head to the Posts section of the Facebook Page competitor data on Minter.io. Here you will find a number of graphs that can help you find more positive outliers. Explore the Number of Likes, Number of Comments, Number of Shares, Link Clicks, Post Engagement Rate and Profile Engagement Rate graphs. Look for spikes in the data to see when the audience was engaging more than usual with the content and/or Facebook Page.
Keep in mind that engagement (other than likes) can be positive, negative or neutral, so a spike in engagement doesn’t always mean your competitor is displaying behaviour worth copying. To offset this possibility, view engagement graphs in conjunction with the Number of Likes graph. You can also explore activity from times with an explosion of engagement to determine whether the engagement is mainly positive or not.
Once you have found spikes in the data, filter your competitor’s posts by your metric of choice, informed by the anomalies found in the graphs. Here you can dive into the exact posts with elevated engagement for your competitor. Get a snapshot of the engagement rate, and the number of likes, comments and shares for each post.
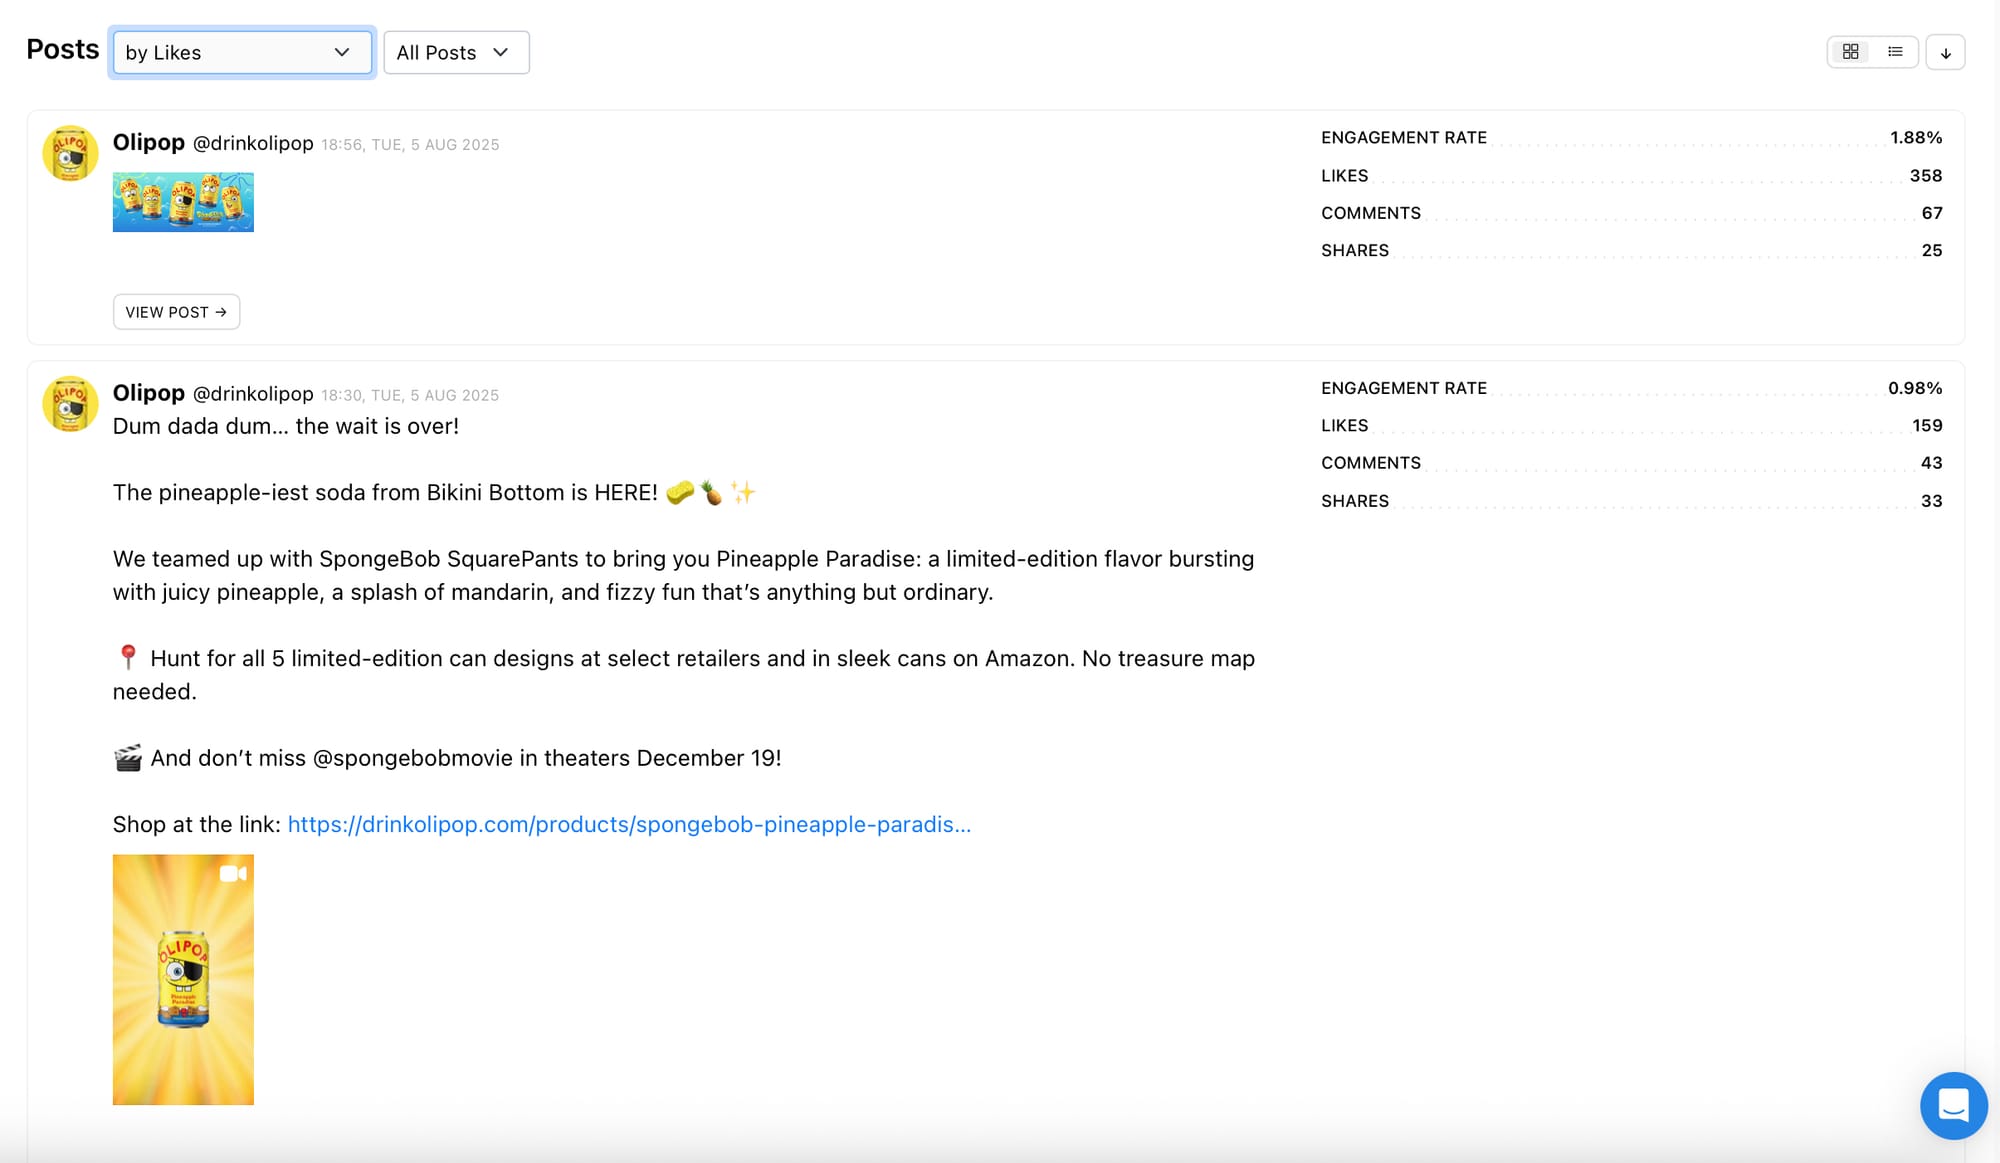
Use your competitor’s top-performing posts to inspire post creation for your brand. Find similarities within the top-performing posts. Take note of the media types, visual elements, colours, length of copy, tone of voice, emoji use, link use and other elements. Use these to help encourage more positive engagement and growth for your brand.
Ask yourself:
- What’s working well?
- Why does it stand out?
- How can my brand replicate this in a way that aligns with our values, ethos, voice etc.?
3. Optimise based on competitor info
Find out how your Facebook competitor could optimise to improve their performance, and leverage this information for your own Facebook Page. Head to the Optimization section of the Facebook Page competitor data on Minter.io to find multiple graphs to inform your strategy further.
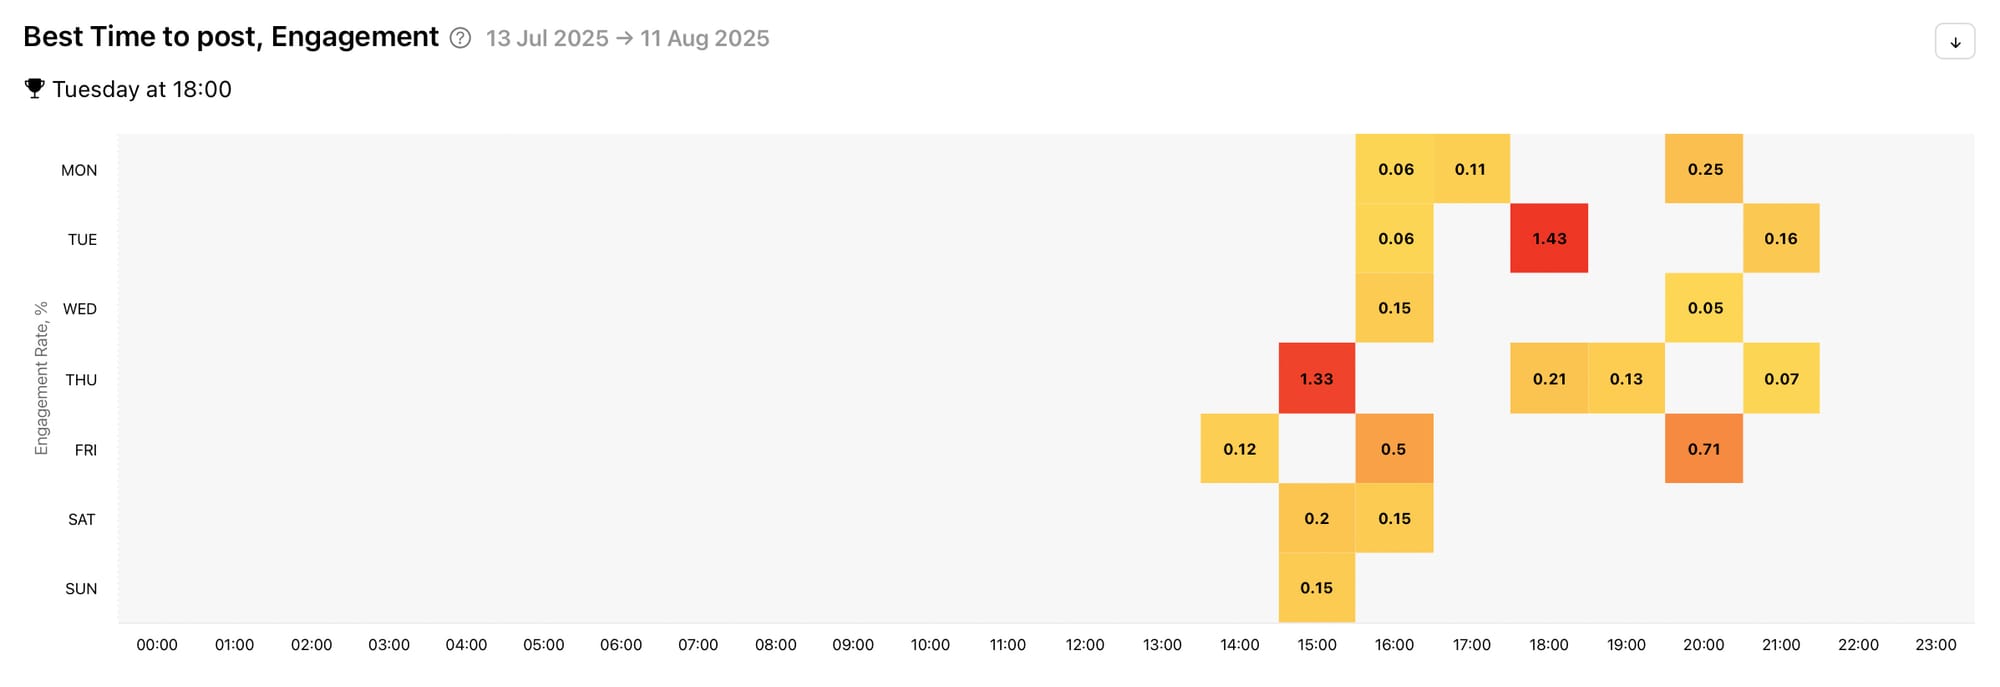
The first graph to explore is the Best Time to post, Engagement graph. This shows the average engagement rate of posts published at specific times of the day and days of the week during the selected date range. The darker the colour, the better the time to post. Above the graph, the best time and day to post is plucked out and displayed, making it easy to pinpoint a day and time to try for your own posts.
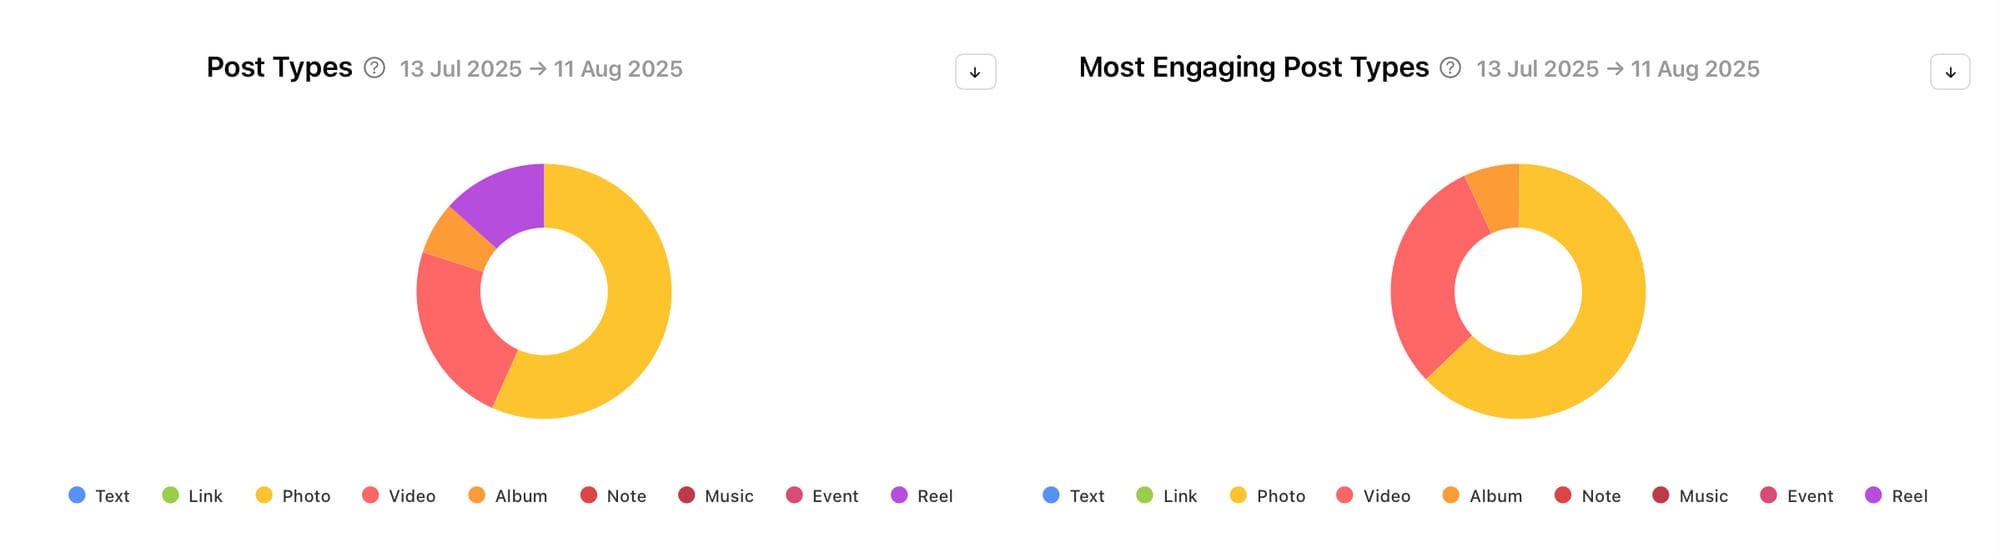
Next, get your eyes on a pair of graphs that are displayed side by side. The Post Types graph shows the types of posts your Facebook competitor published during the selected date range, while the Most Engaging Post Types graph shows the distribution of post types by the number of interactions during the selected date range.
Using these two graphs, you can determine the post types your competitor favours, as well as the post types that are raking in the most engagement. Do both graphs match up or is your competitor missing a trick that you can take advantage of?
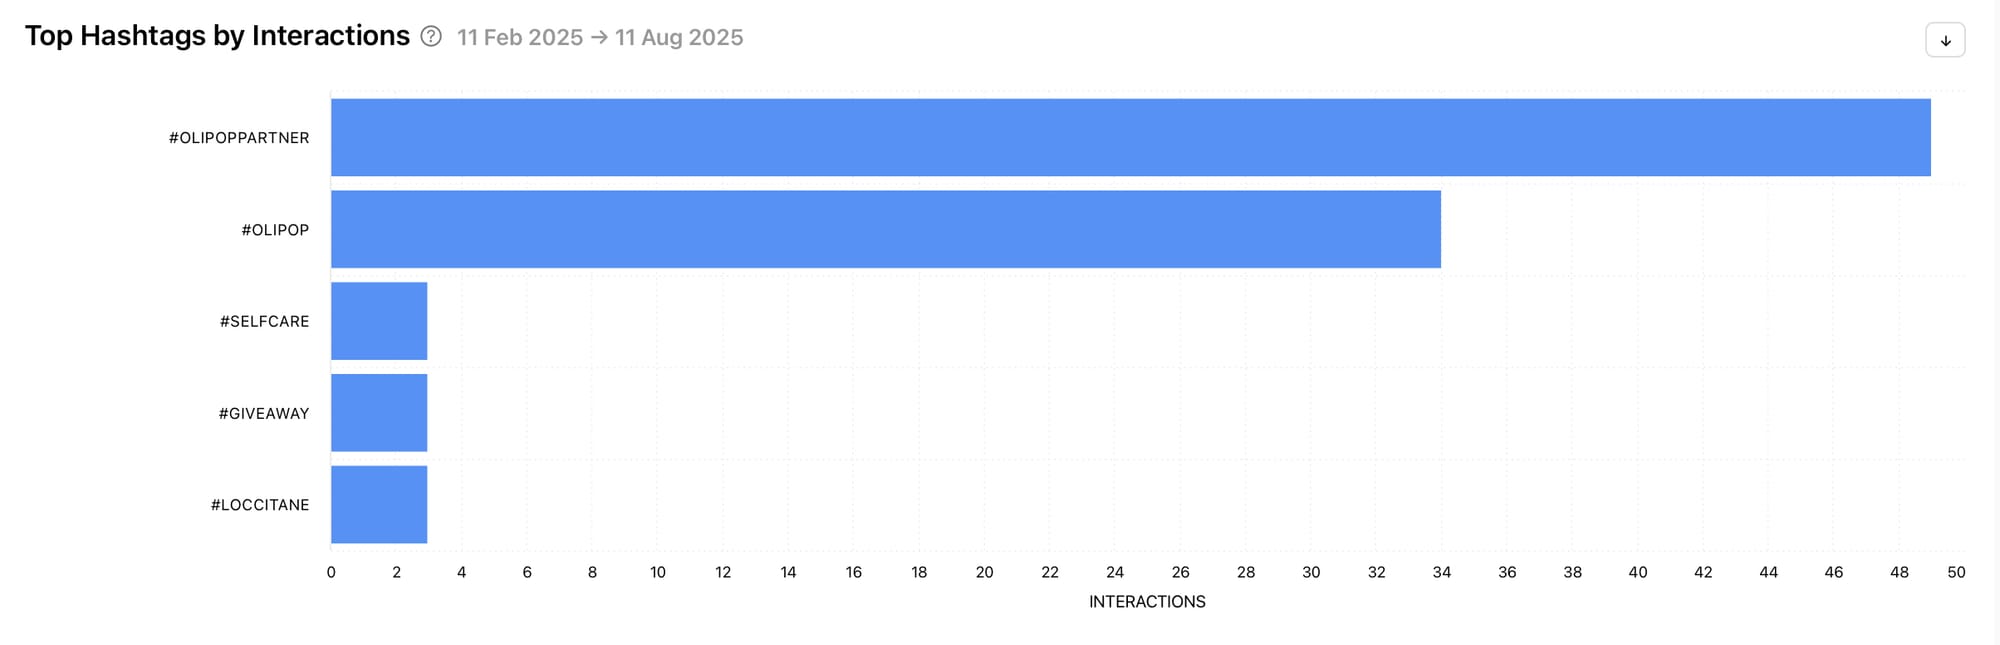
Another pair of graphs to consider making use of are the Top Hashtags by Interactions graph and the Most Effective Hashtags graph. Explore hashtags your competitor is using which might be relevant to poach for your own copy. Are brand-specific hashtags performing the best and should you consider developing your own? Perhaps there are a few broader hashtags included in these graphs that are relevant to your business and the wider community on social media.
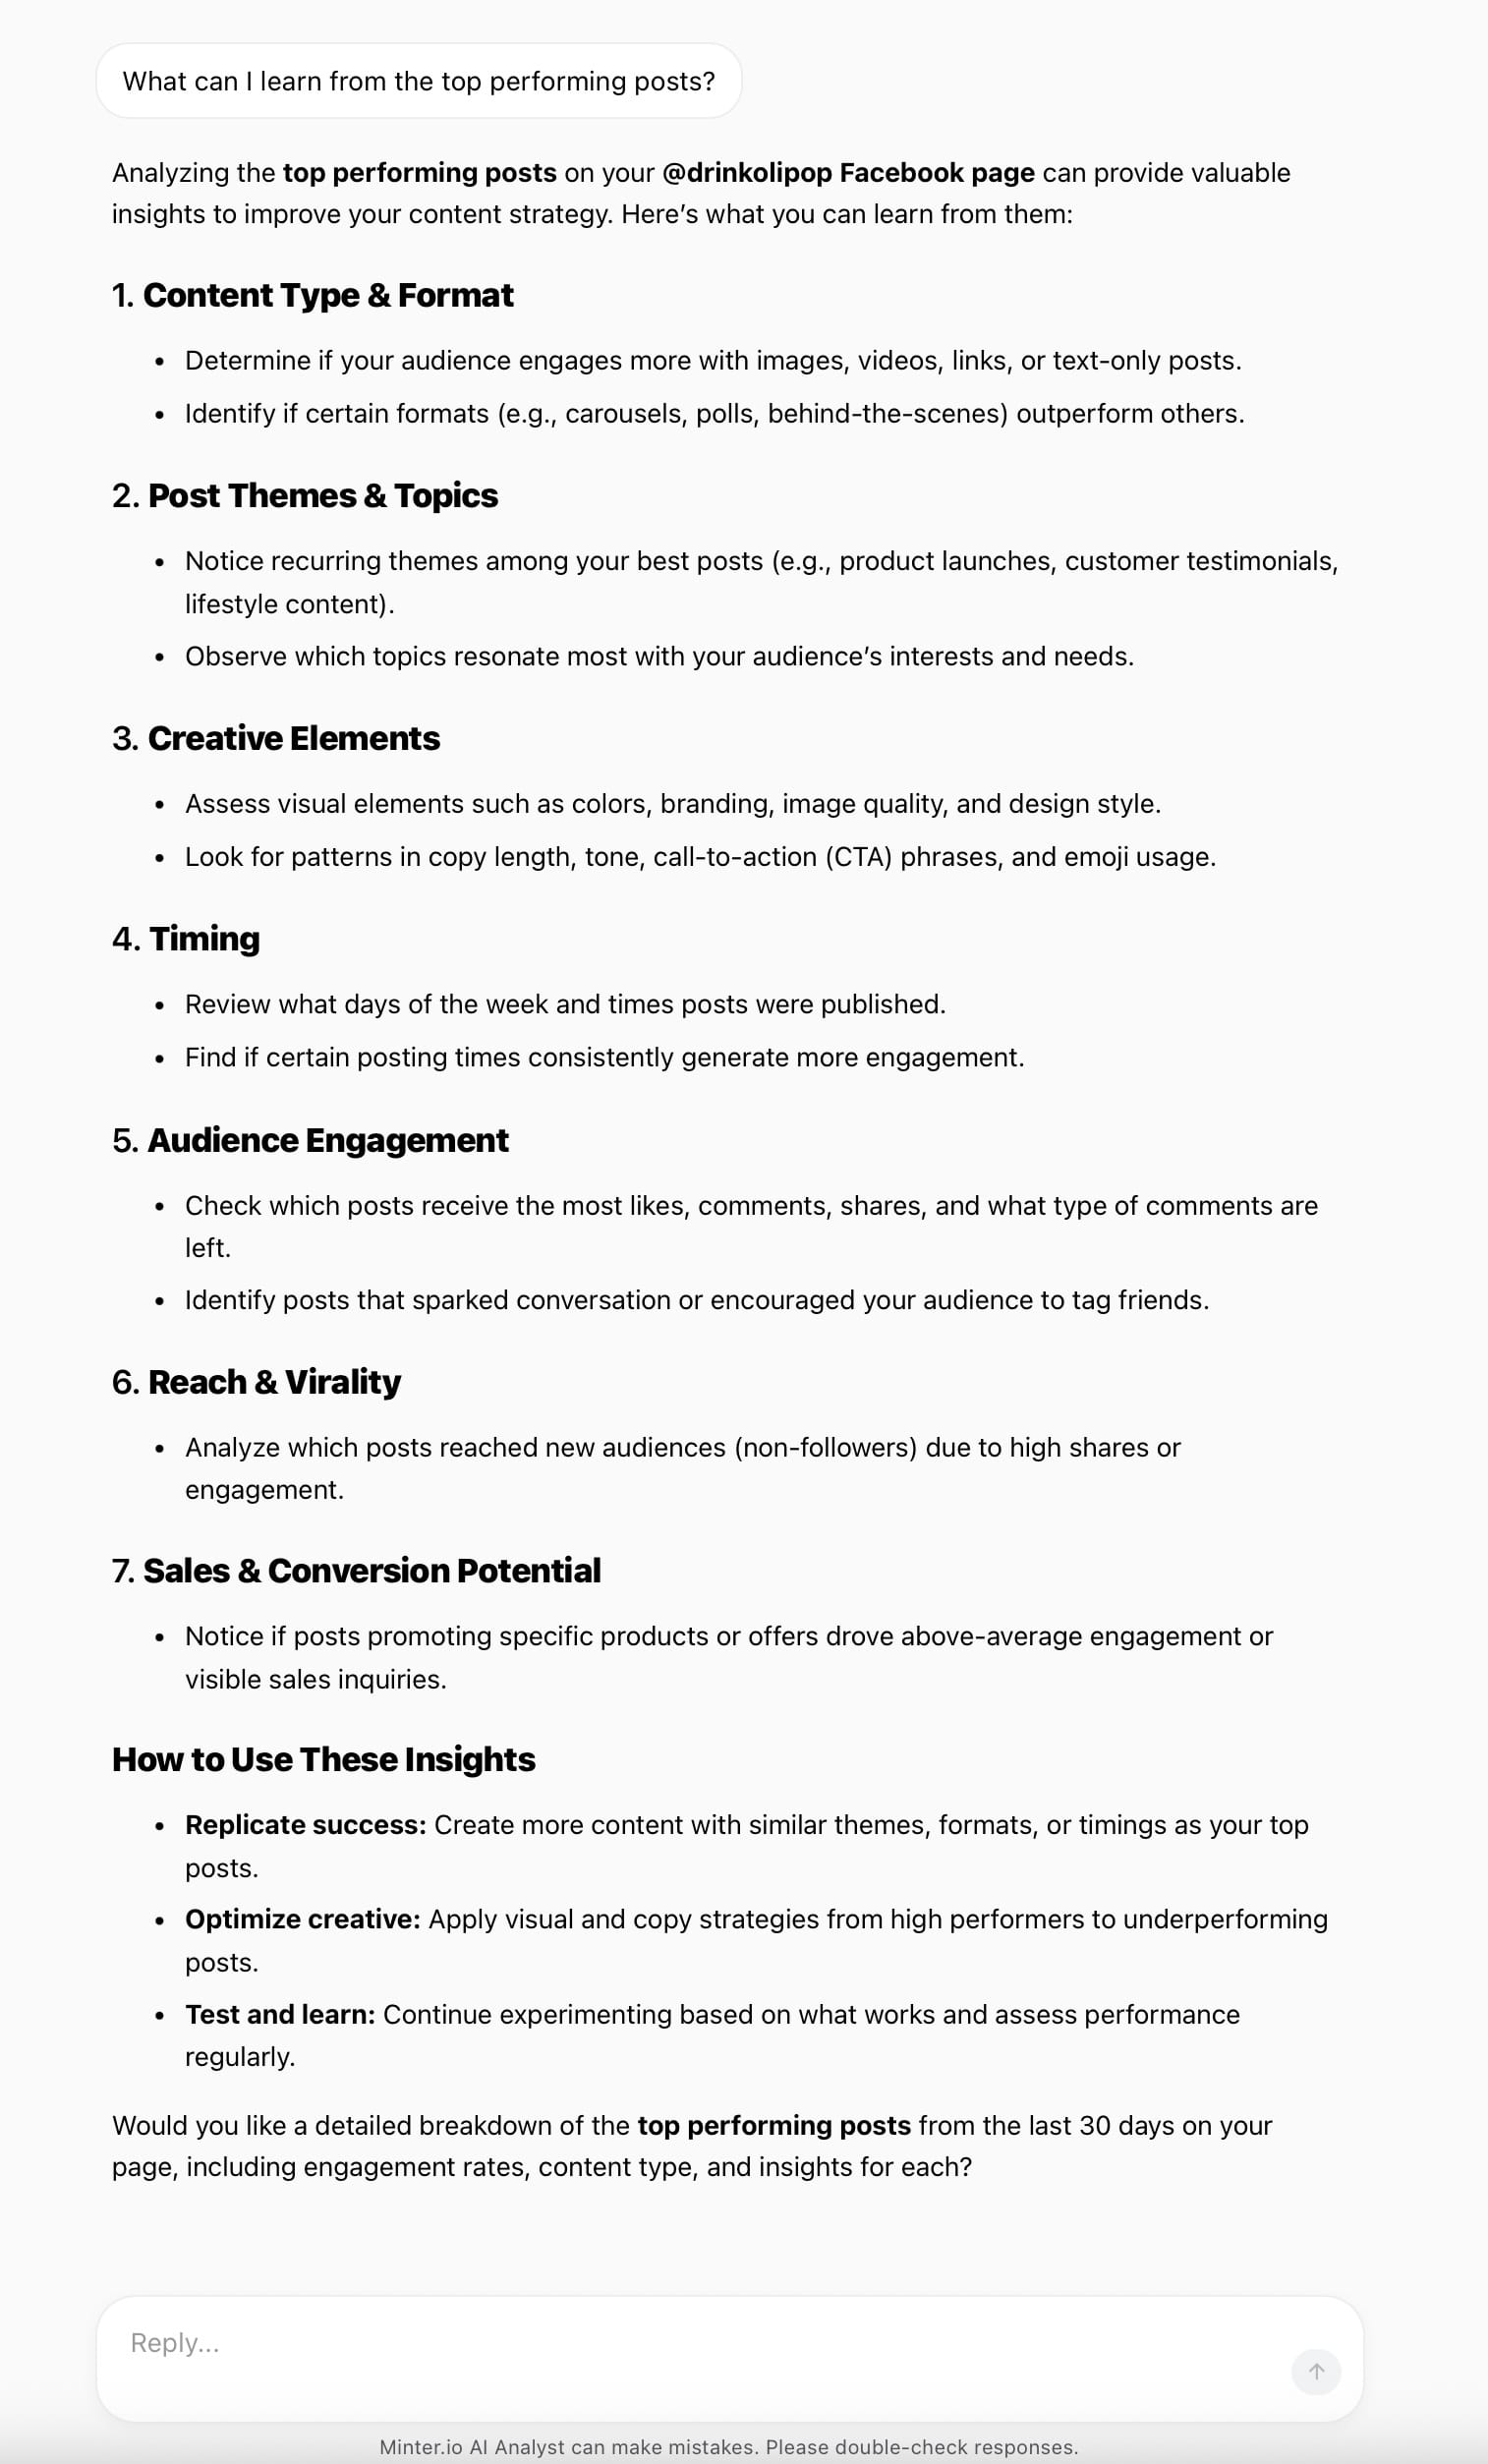
4. Enlist the AI Analyst
The AI Analyst is a new feature by Minter.io which enables you to harness the power of AI to find effective answers to questions about your competitors as well as your own social media data. Use the AI Analyst to answer your questions, clear up any confusion, help you understand the data and get in-depth, articulate answers quickly.
Access your Facebook competitor’s data with Minter.io - the social media analytics tool for businesses on social media. As well as unlocking the graphs and features in this article, discover in-depth insights for your own presence across multiple social media platforms including: Instagram, Facebook, TikTok, LinkedIn, X and Threads. Find out more here!
Try Minter.io analytics today→