How to use NEW Fans Change by Source metric for Facebook success
It’s vital to know whether your Facebook fan count is going up or down but wouldn’t it be useful to know exactly why? With the new Fans Change by Source graph by Minter.io you can do just that. Find out exactly where fans were gained and others were lost. Are your ads doing you a favour? Perhaps your page needs some tweaks? Find out everything you need to know below.
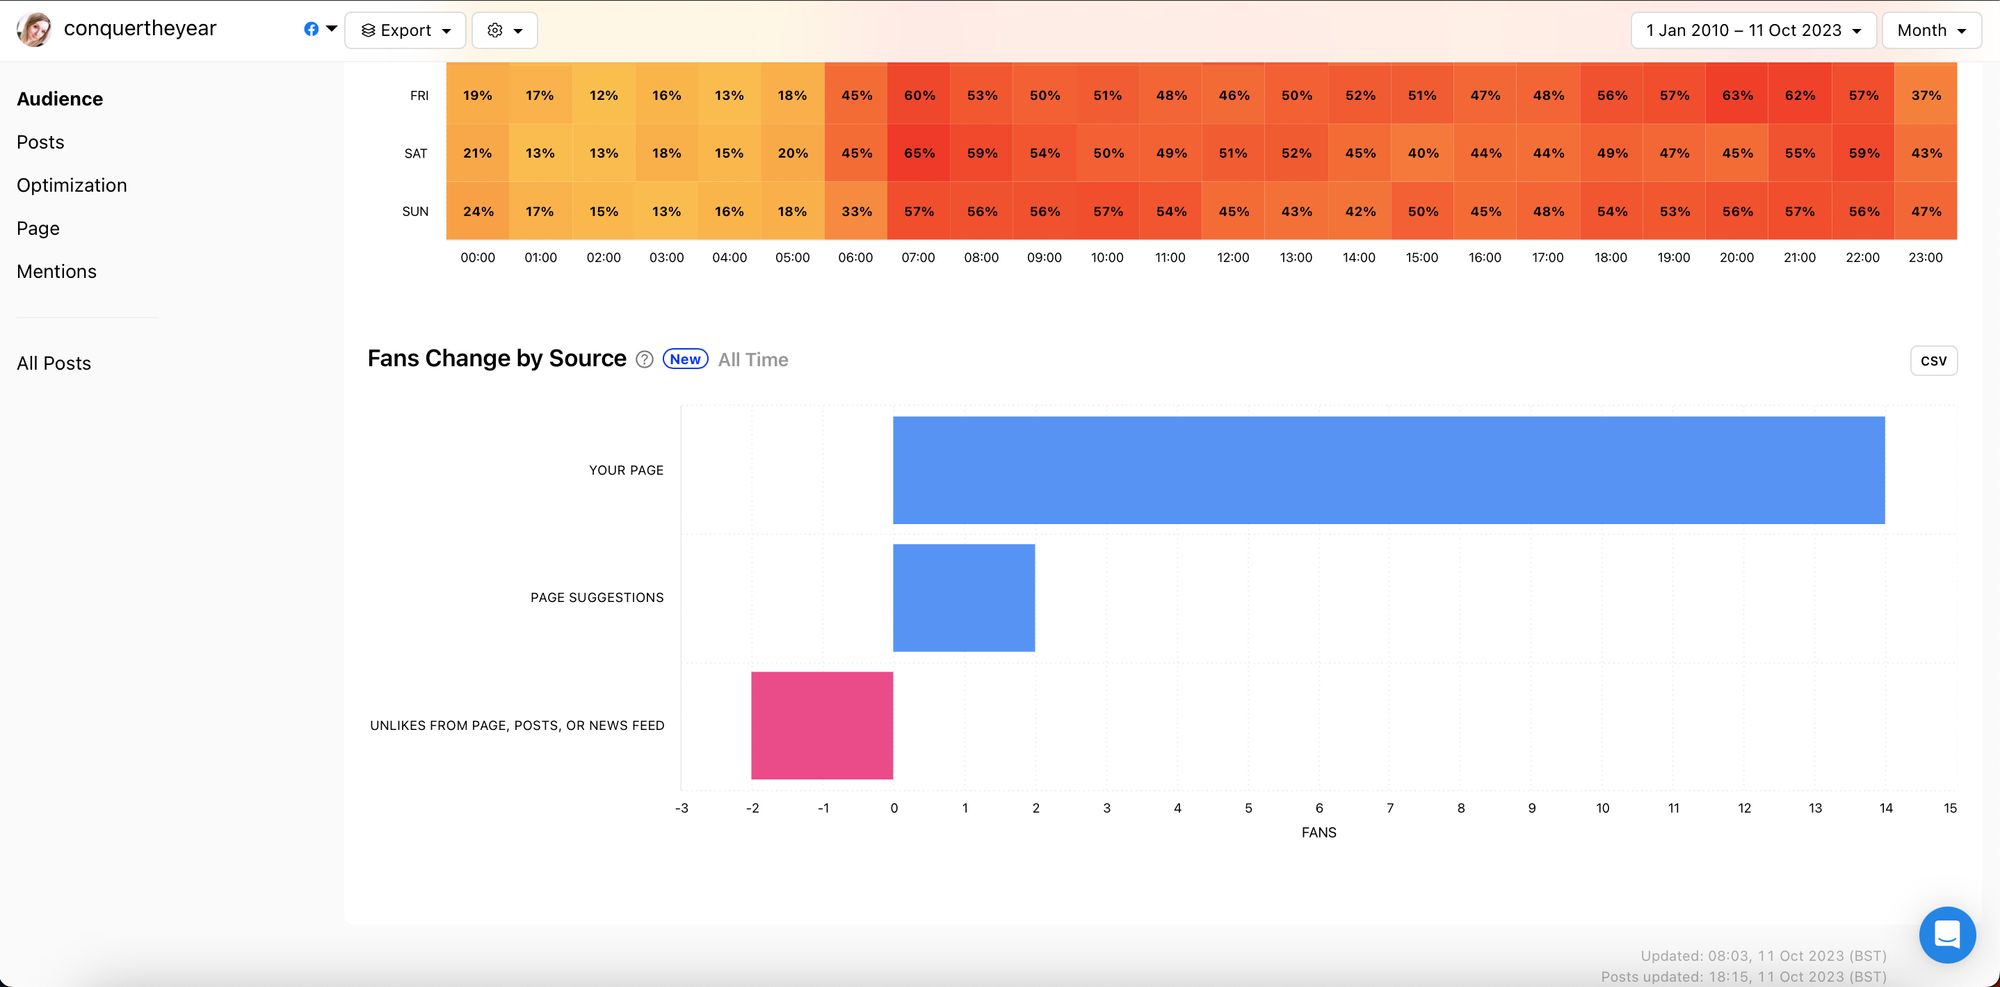
Discover the Fans Change by Source graph
The Fans Change by Source graph shows Facebook page owners where fans were gained and lost within a selected time frame. You can completely customise the selected time frame to suit your needs.
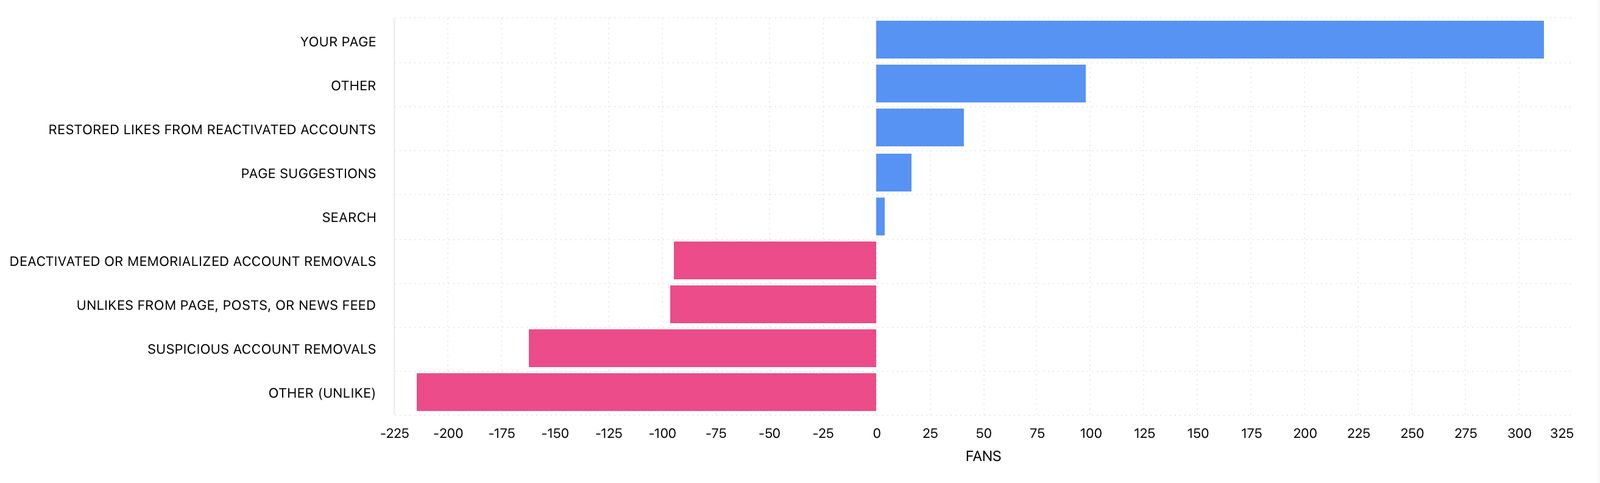
View a number of sources including:
- Ads
- Your page
- Page suggestions
- News feed
- Restored likes from reactivated accounts
- Search
- Deactivated or memorialised account removals
- Unlikes from page, posts or news feed
- Suspicious account removals
How to interpret the data
Knowing exactly what triggered page likes and unlikes can guide you towards positive decisions that shape your Facebook strategy.
Armed with this data, you can…
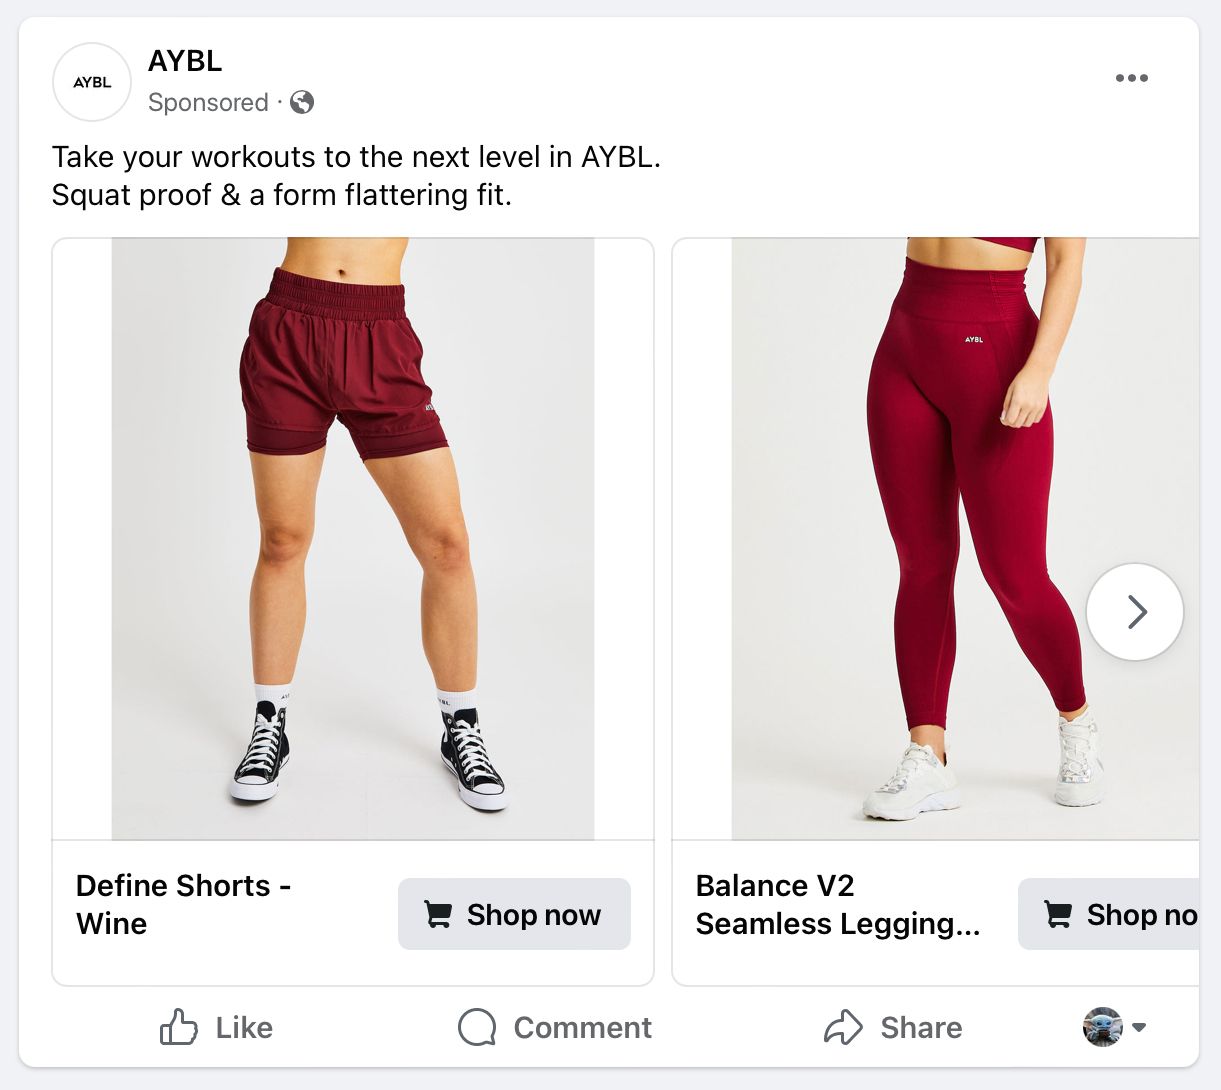
- Determine whether the response to your ads has been net positive or negative.
Are your ads resulting in new page likes or a loss in page likes? Use this knowledge to shape your advertising strategy. Replicate ads that positively influenced the page like count and eliminate ads that negatively impacted the growth of the Facebook page.
- Work out whether your page is helping or hindering your fan growth.
Are likes or unlikes coming directly from your Facebook page? If you’re gaining likes from your profile, it means you’re doing something right. If the opposite is happening, it’s time to look at optimising your Facebook page for success. Look at your profile picture, banner media, bio and branding. Do these elements present a good first impression of your business? Think about the use of colour, logos and copy. Are you leveraging social proof? Are you producing quality content on a consistent schedule. Every element on your profile can influence whether viewers like or unlike your Facebook page, so make sure you’re making the most of every opportunity to give people a reason to stick around.
- Spot restored likes coming from reactivated accounts.
If a user deactivates their account without deleting it, they have the option to reactivate it at a later date. When an account is reactivated, their page likes are restored alongside their profile. This isn’t a new like, but a reinstated one.
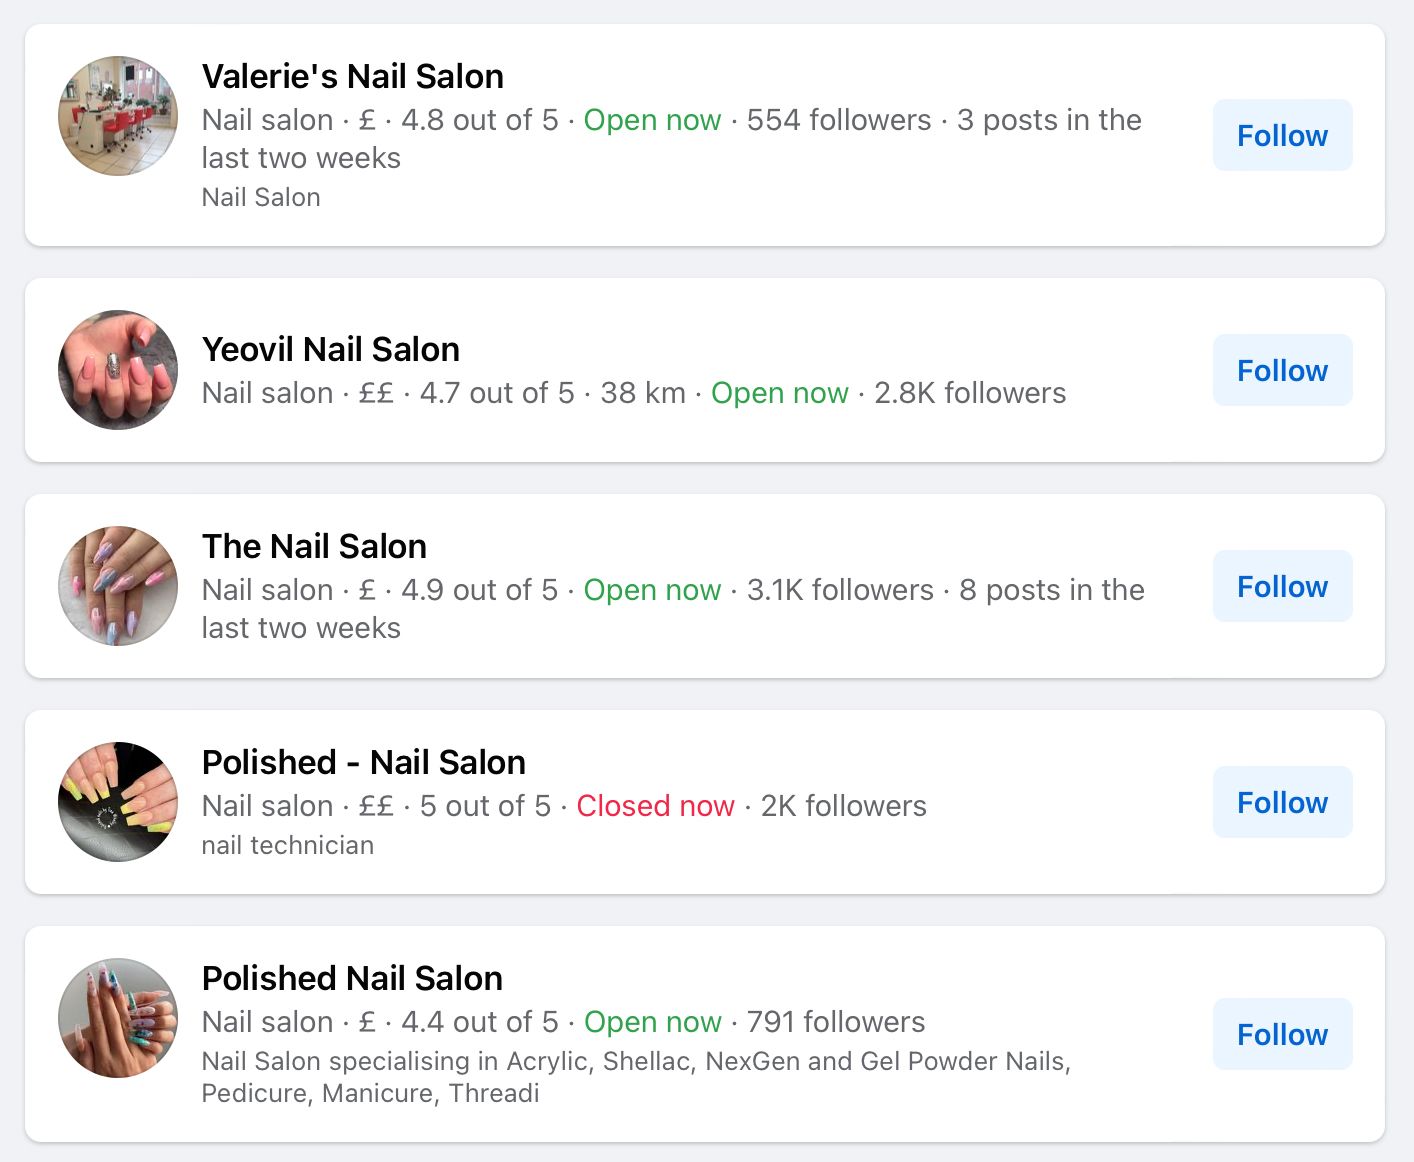
- Notice how many likes your page gained from search.
Facebook search is a powerful tool which connects users with a multitude of results. Whether connecting with long-lost friends or discovering new brands and groups, there’s so much to explore. The search function takes into account the user’s search term and location, then ranks results in the order it deems most fitting to the user.
Pages can be ranked highly in search, making it an ideal placement to get discovered. If you’d like to drive up your discovery in search, pay close attention to the pages that get ranked well and the initial information viewable to the user. The page name, profile picture, business type, price information, star rating, distance from the user, opening times, follower count, bio and number of recent posts can all be visible within search, making these elements crucial for drawing in new likes.
- Know whether your page is being suggested to new people.
When your page is being suggested to new people, this is proof of the algorithm working in your favour. Keep doing what you’re doing.

- Learn how people respond to your content in their news feeds.
When content appears in the news feed of a user, they can choose to like or unlike the page in addition to viewing and interacting with the content. Make sure the content you’re publishing is a good representation of your business. Publish content you’re proud of and that has value to the end user. It only takes one good piece of content to connect with a potential customer; it only takes one piece of bad content to put a customer off.
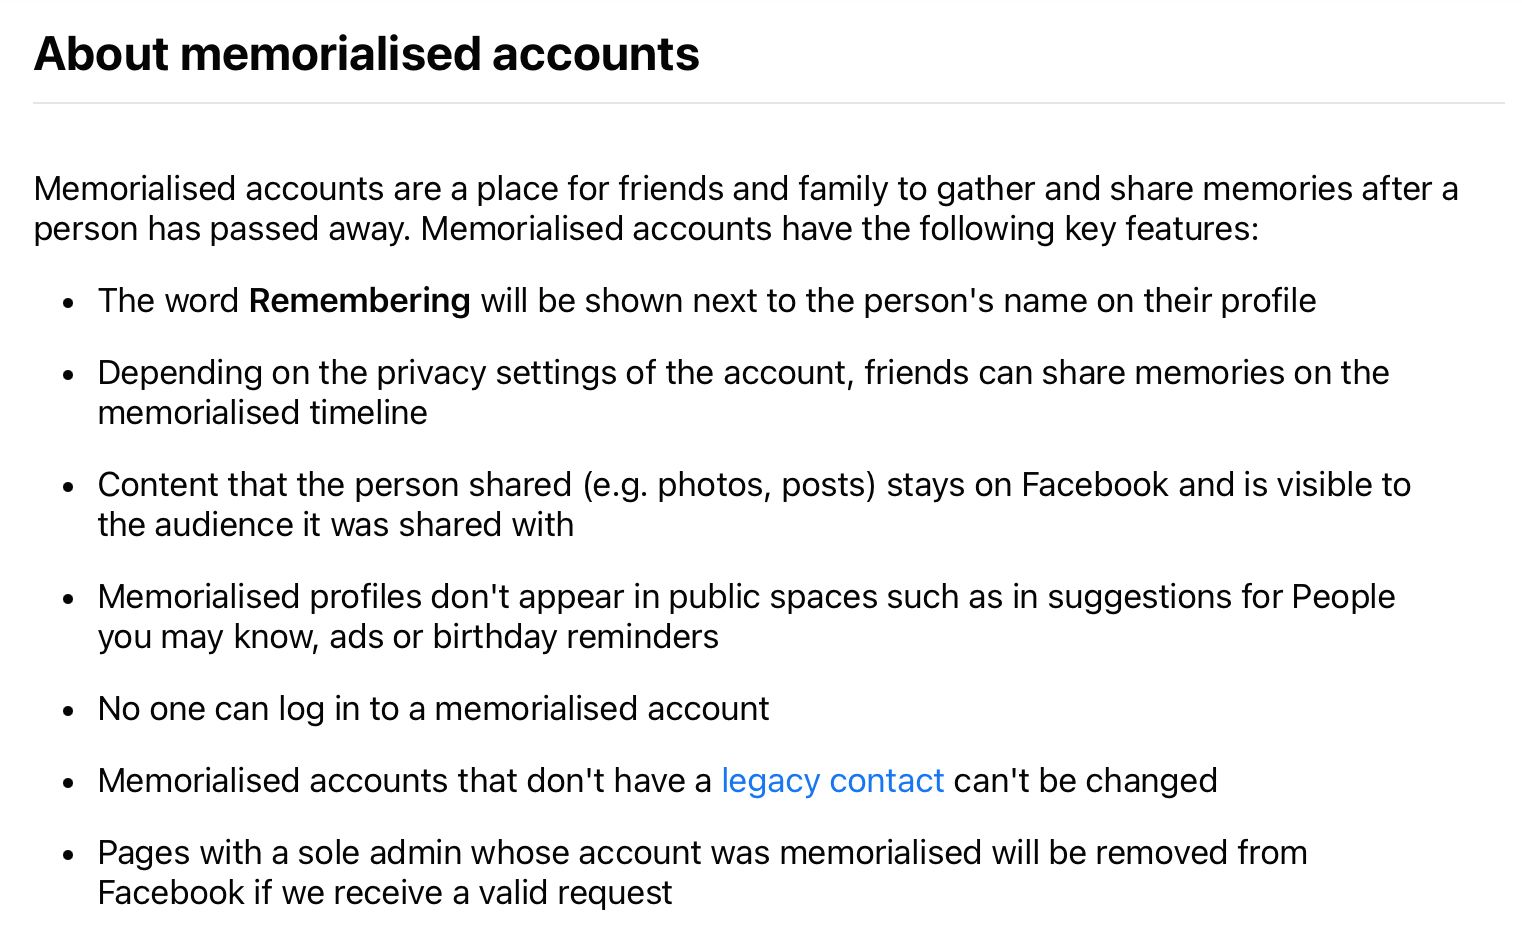
- Distinguish deactivated and memorialised accounts from unlikes.
A deactivated account is an account no longer in use. Sometimes it isn’t completely deleted but it isn’t accessible unless the user decides to reactivate it at a later date.
A memorialised account is a Facebook profile that exists after the passing of the user. The Facebook profile is still viewable by their friends and family and depending on the account’s settings messages, photos and videos may still be able to be shared on the profile for those wanting to remember their loved one.
- Learn more about genuine unlikes.
View the amount of unlikes from the page, posts and news feed. These are genuine dislikes. It’s normal to see some unlikes, especially if your page has a large amount of fans or if it has been around for a long time. Sometimes fans unlike a page without a big reason e.g. they lose interest in a page if it's no longer relevant to them. However, it’s a good idea to take note of this amount so you can know what is normal for your page. If there is a large increase in page unlikes, you can explore why this might be happening and make adjustments accordingly.
If the amount of unlikes from the page, posts or news feed is high to begin with, make sure you’re following best practices, staying true to your values, listening to feedback and providing value. On Minter.io, check out the optimisation graphs for more effective publishing, the mentions section to listen into valuable feedback, and the posts section to find posts that are working best for your brand.
- Understand the quality of your audience through the amount of suspicious accounts removed.
Sometimes you’ll notice that Facebook has removed suspicious accounts from the platform and that can result in a lower like count for your page. Remember that the quality of your audience is far more important that the quantity of page likes. After all, it’s more valuable to a business to have 50 paying customers over 500,000 page likes that don’t convert into genuine customers.
Unlock the Fans Change by Source graph
You can find the Fans Change by Source graph on Minter.io in the Audience section of your Facebook page data.
Here’s how:
- Go to Minter.io.
- Select your Facebook page.
- Choose ‘Audience’ from the panel on the left-hand side of the screen.
- Scroll down to the Fans Change by Source graph.
Use multiple graphs for maximum information
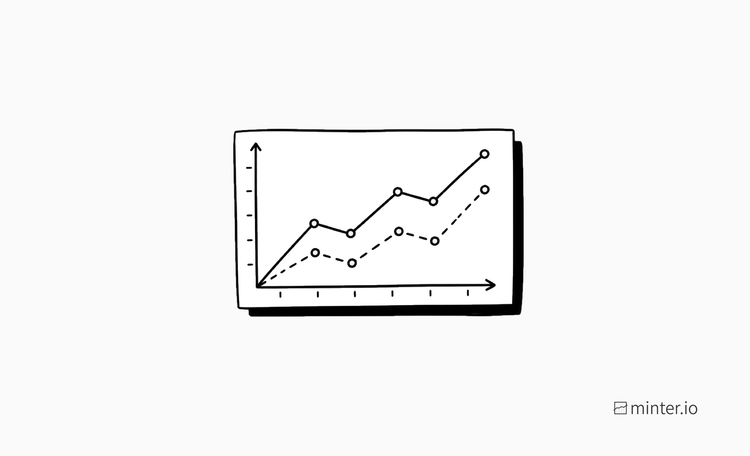
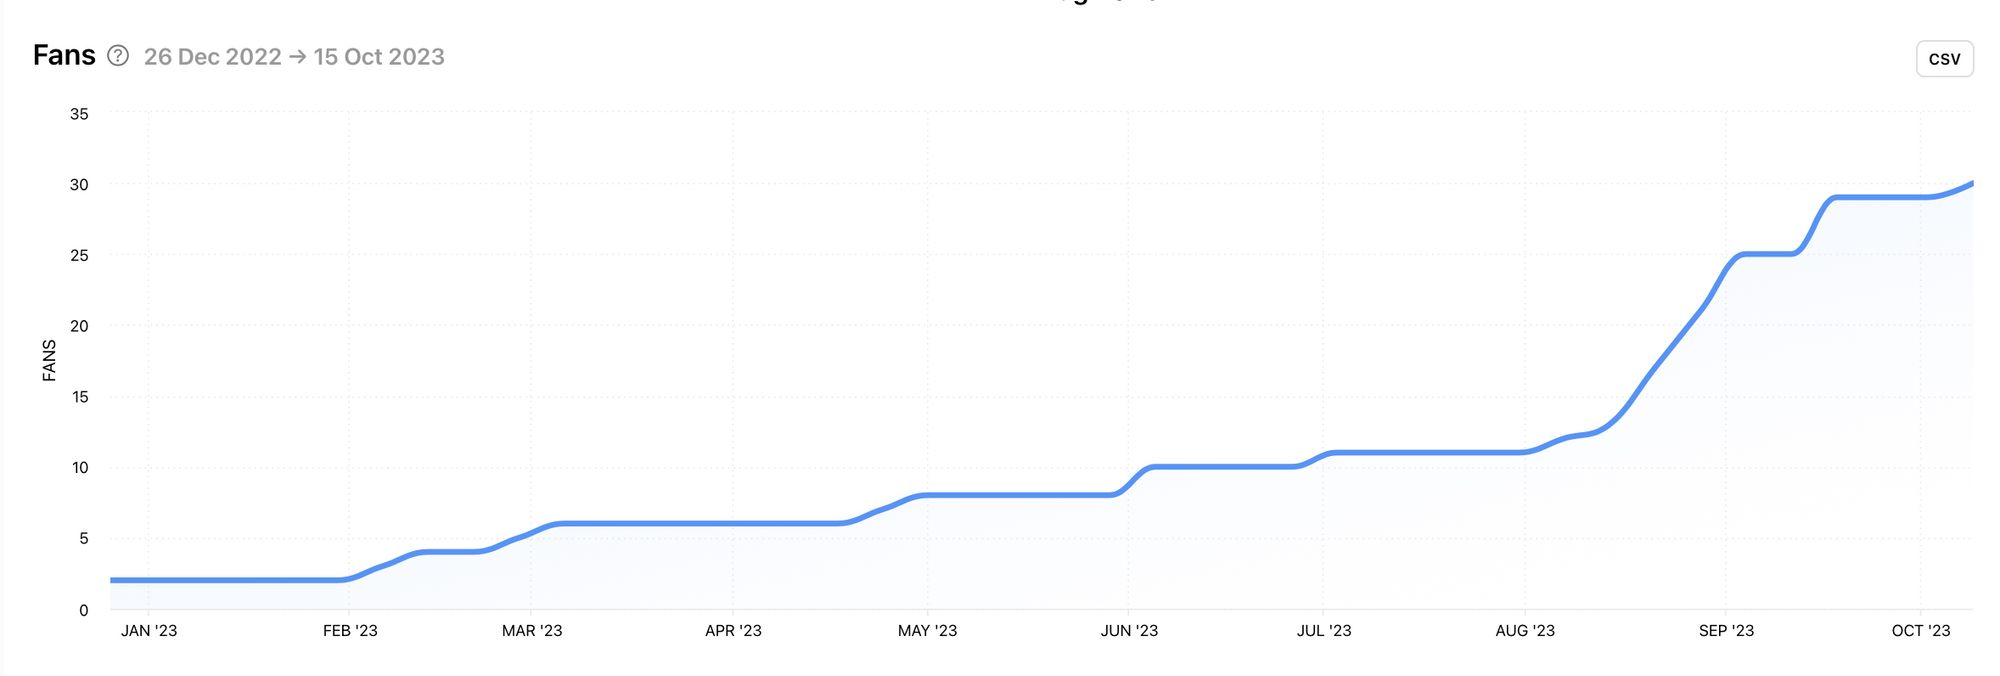
The Fans Change by Source graph is a powerhouse of a graph on it’s own, but everything is better with good friends. Use this graph in conjunction with the Fans Graph and the Fan Change graph for an even more complete picture.
The Fans graph can give you an overall look at trends. Look for spikes, dips and periods of rapid growth or decline. Remember, it’s normal to get some unlikes from time to time; what matters is the general trajectory.
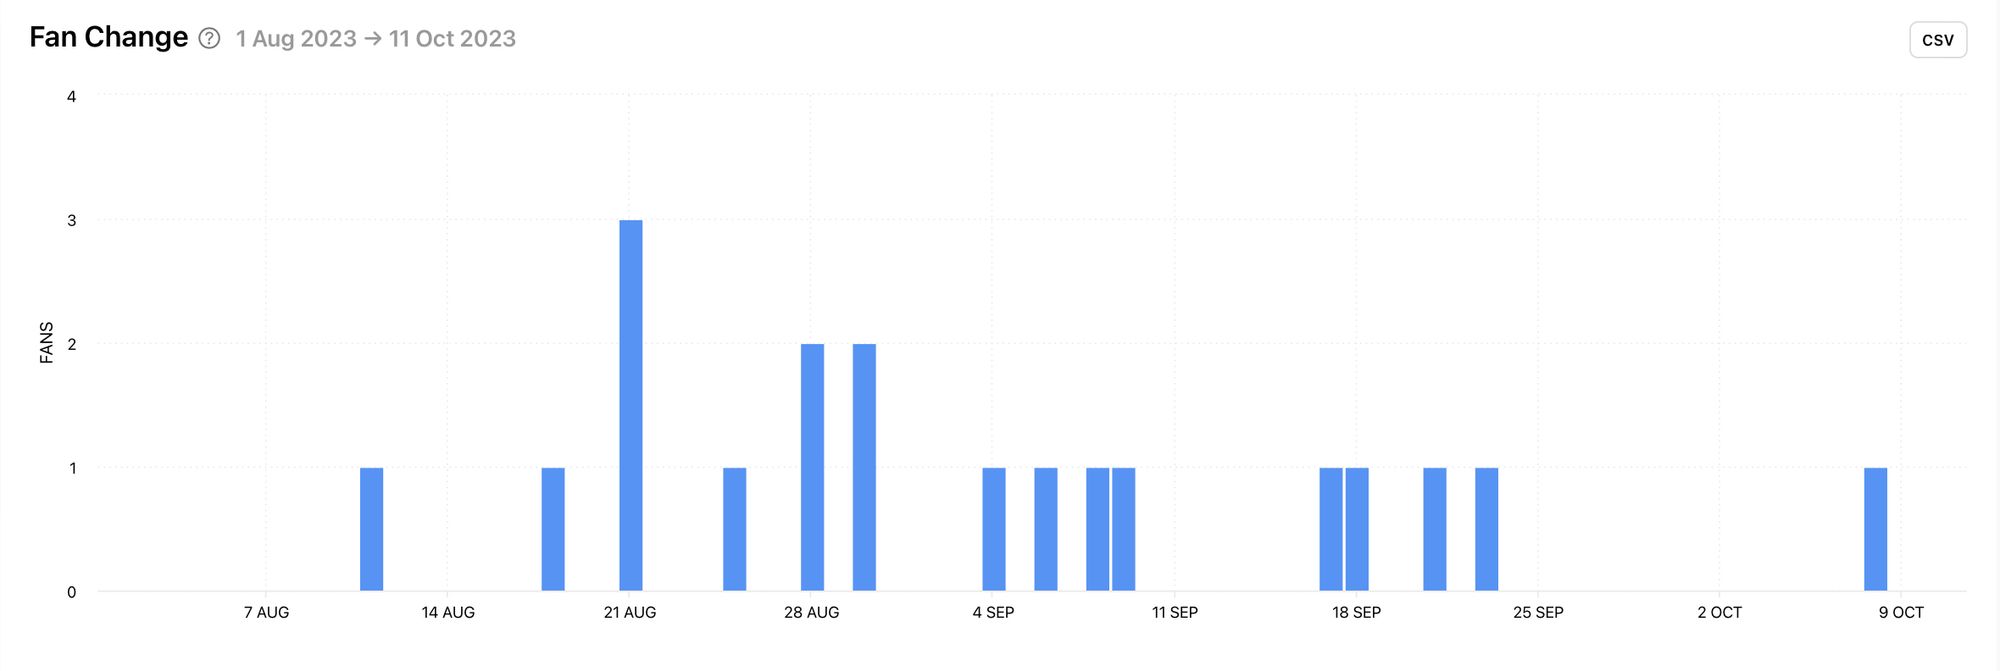
The Fan Change graph can help you pinpoint exact days of specific or significant change. This graph shows you how many fans your Facebook page gained and lost on specific days, weeks or months within the selected time frame. When used in tandem with the Fans Change by Source graph, you can see how actions taken on certain dates may have influenced the fan change based on where page likes and unlikes occurred.
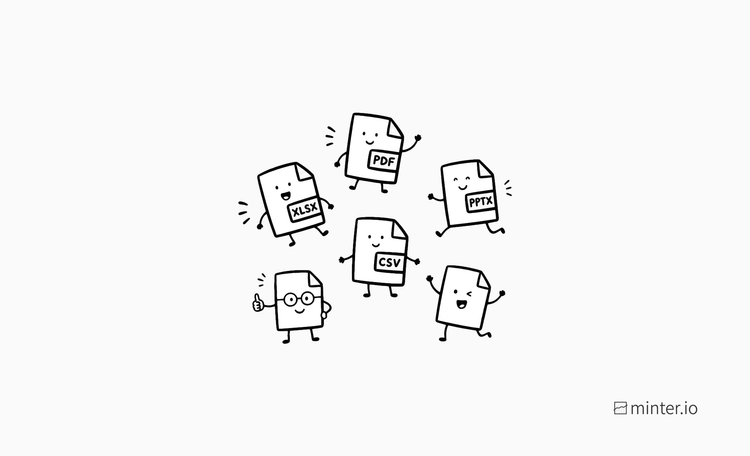
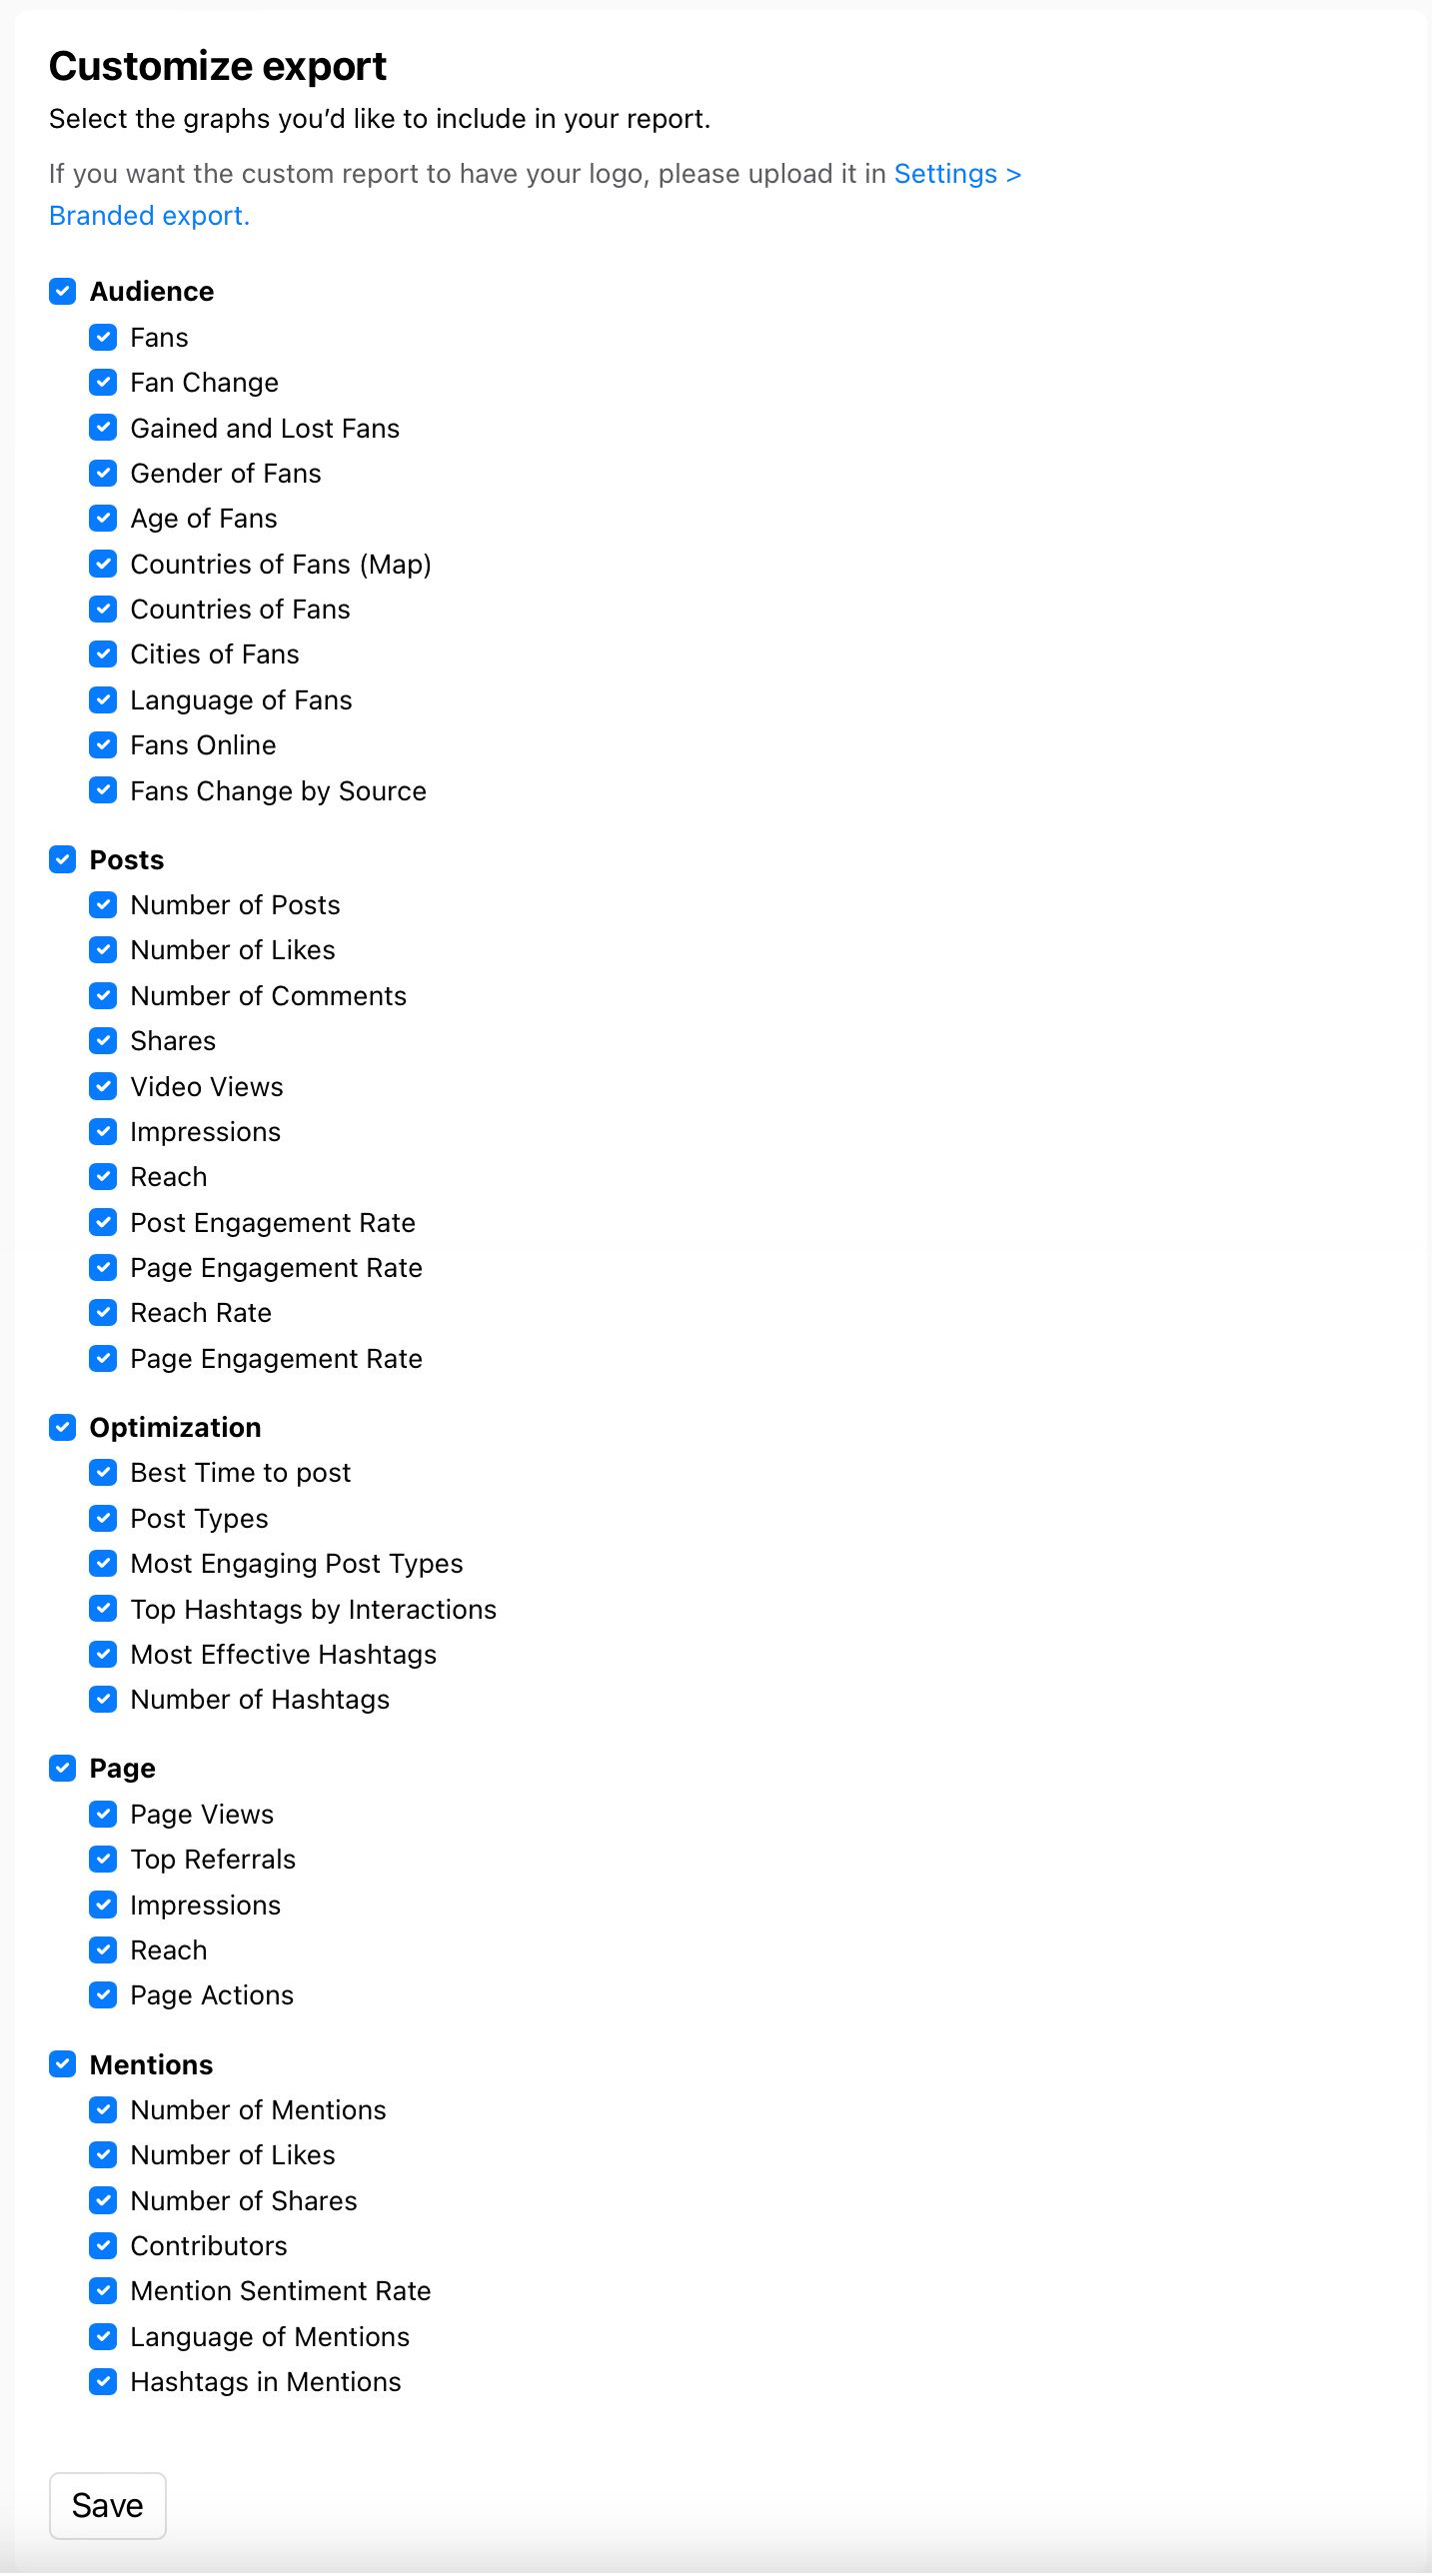
Export data
The Fan Change by Source graph is available to export by itself or as part of a report. You can customise your scheduled export to include or exclude this graph.
Here’s how:
- Go to Minter.io.
- Select your Facebook page.
- Click the export button at the top of the screen.
- Choose ‘Customize export’.
- Toggle the check boxes to include or exclude the desired graphs.
- Click the save button at the bottom of the screen.
Alternatively, to export the graph in a single click, select the CSV button beside the graph.
Explore the Fans Change by Source graph and so much more on Minter.io today. With the latest metrics, you can make powerfully informed decisions to drive business growth through social media. Find out more here.
Start your free trial→