
How to track link clicks on your Instagram Stories

Instagram Stories are a primary driver of link clicks on the platform, and it’s important to master them because the ultimate aim of social media use in business is to get potential customers into a place where they can make purchases. Links are added to Instagram Stories posts as stickers, and they provide direct access to target URLs, making them the ideal option for driving traffic to specific products, services and web pages. The limited lifespan of an Instagram Stories post serves urgency to an audience that is likely to already be warmed up, giving a compelling push of FOMO down to the end of the sales funnel. By tracking, analysing and comparing your link clicks, you can gain vital understanding of their performance and value to your business, making it easier to build successful strategies for getting more sales and building business success.
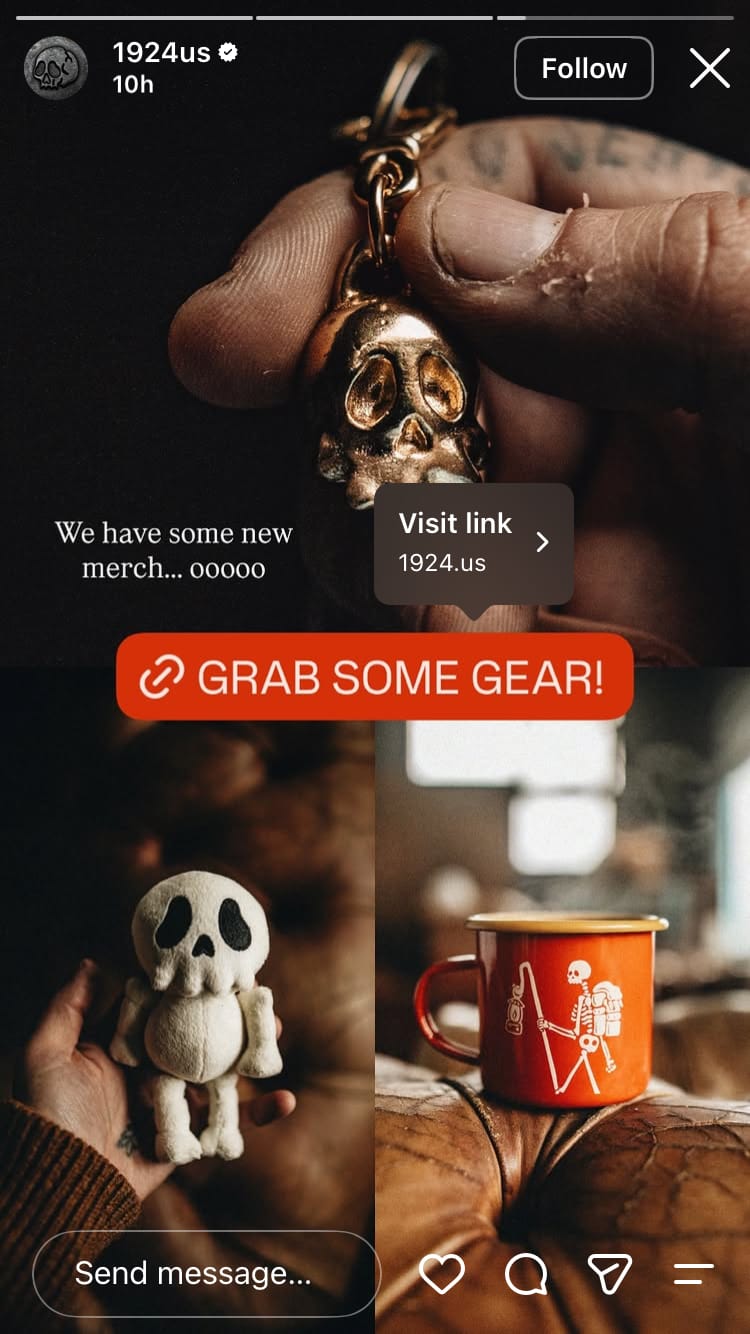
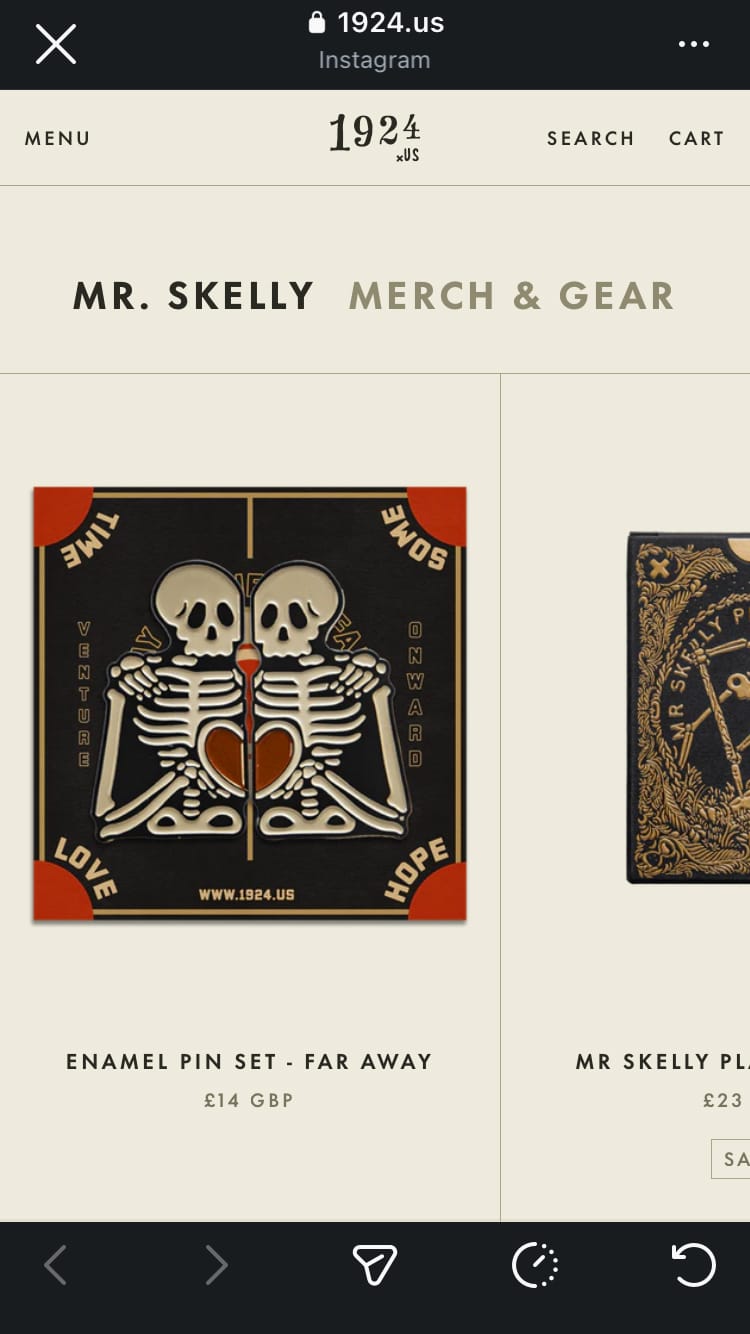
Instagram link stickers drive traffic to target URLs
The trouble is, Instagram’s native insights are fairly limited. While Instagram Stories historical data is technically capped at 2 years, in practice many accounts can only see 7 to 30 days of link click data when viewing insights in the Instagram app. This simply doesn’t provide an effective way to monitor one of the most powerful ways to drive traffic to your business.
You don’t need to be held back by Instagram’s native insights though. Minter.io is an analytics tool that provides advanced insights for many of the top social media platforms including Instagram, TikTok, Facebook, X, Threads and LinkedIn. With Minter.io you can easily track, monitor and sort Instagram Stories content by link clicks.
How to track Link Clicks with Minter.io
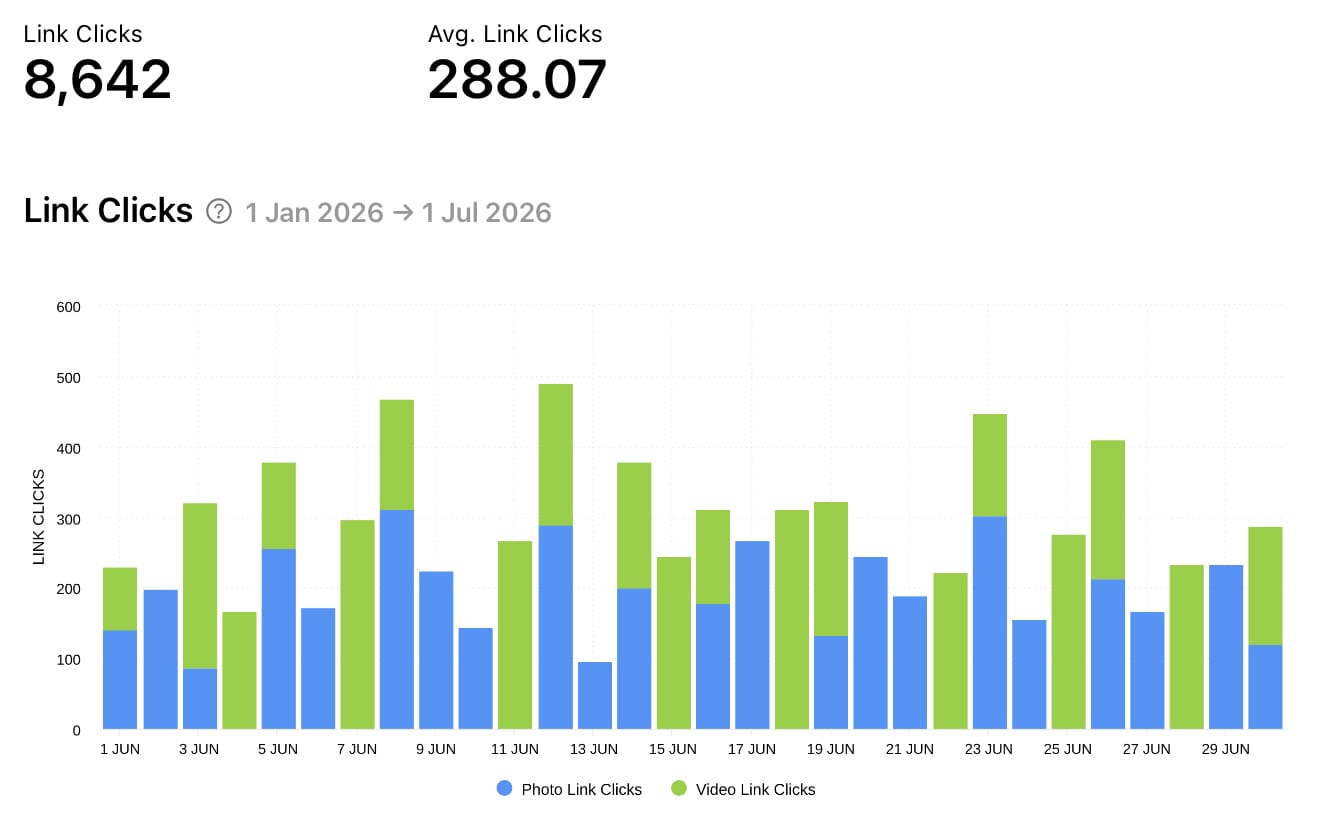
Head to the Stories section of your Minter.io Instagram data and scroll down to find your Link Clicks graph. The Link Clicks graph shows the number of taps on links in Instagram Stories posts during the selected date range. Data is separated into Photo Link Clicks and Video Link Clicks, so you can clearly see which type of Stories posts gained link clicks. Above the graph you can also see the total number of link clicks as well as the average number of link clicks within the selected date range. This means you can track every time someone taps on a link sticker in any of your Instagram Stories posts. With Link Clicks data updating hourly, it’s even possible to see how each individual story performed.
How to filter Instagram Stories by Link Clicks with Minter.io
Scroll down to the bottom of the Stories section of your Minter.io Instagram data, or choose ‘All Stories’ from the navigation panel on the left-hand side of the screen, to see all your Instagram Stories posts that were published within the selected date range. From here you can filter your Instagram Stories content by Link Clicks by choosing from the options in the drop-down menu.
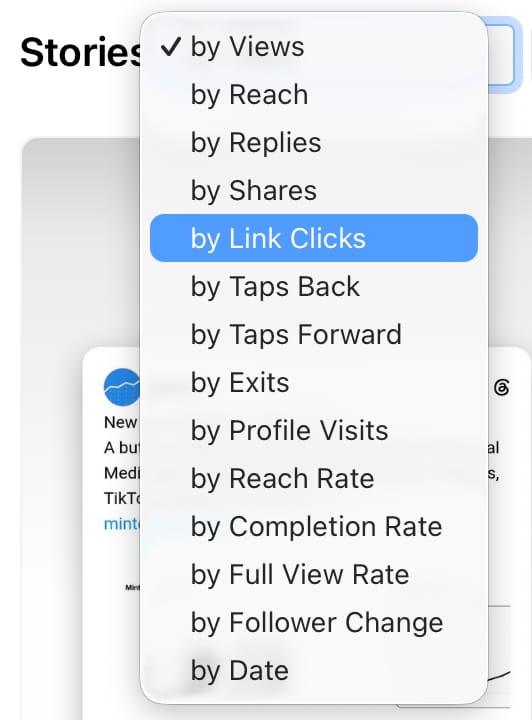
Now your Instagram Stories will be ordered from the post with the highest amount of link clicks to the lowest. Look at the stats below each post to see the exact number of link clicks the post gained.
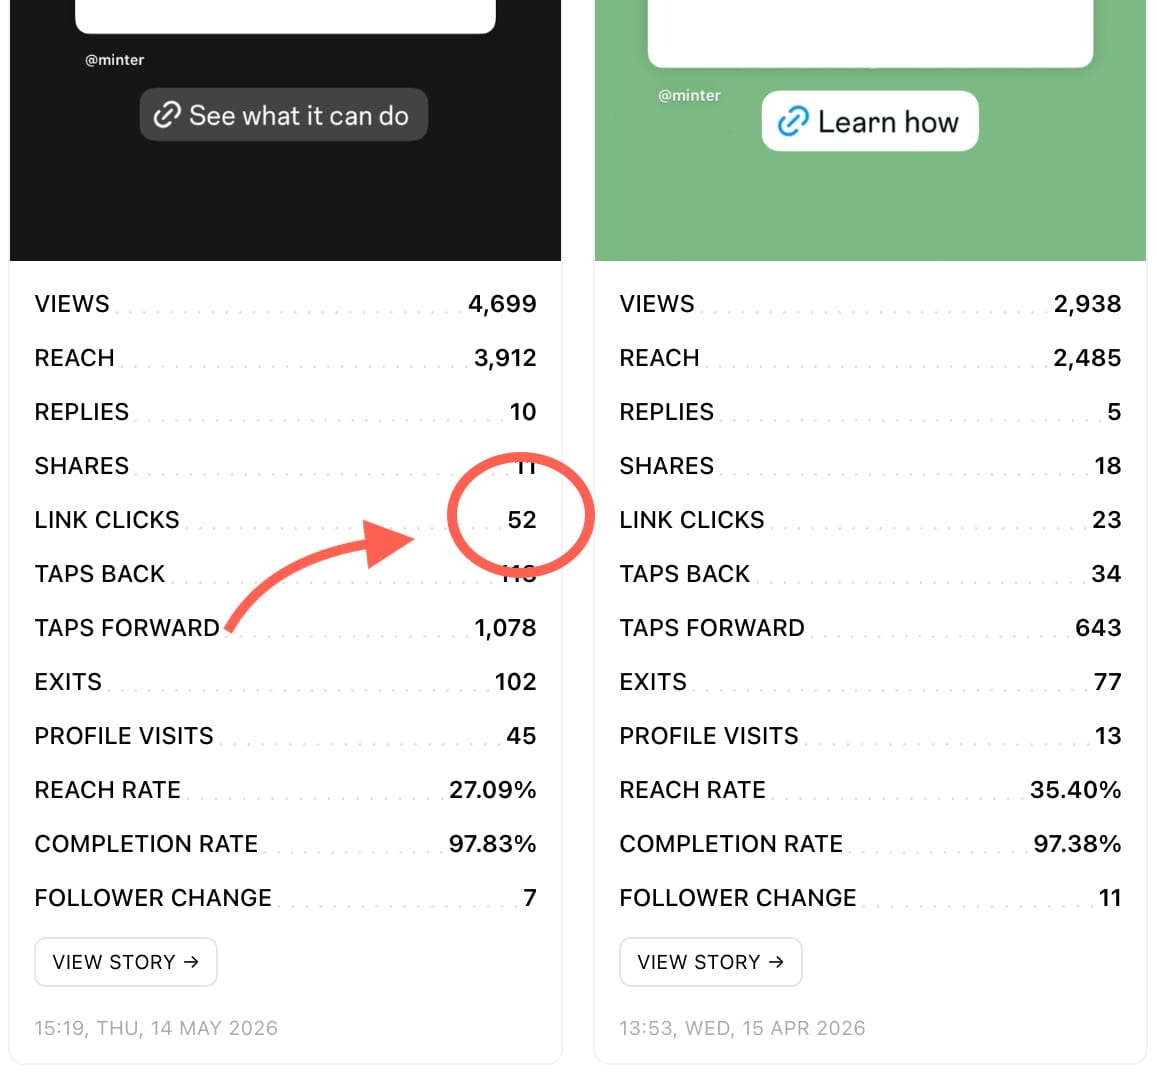
By sorting all your Instagram Stories by the number of link clicks, you can quickly and easily see which posts ranked highest when it comes to link clicks. Look at your highest-performing posts to determine what gets people clicking on your links. Perhaps there was a particular content style, call to action, colour scheme or product that caught the eye and gained clicks. Consider the size, placement and style of the link sticker, whether it features custom text and, if so, what that text is. Also look for commonalities between the top-performing posts. By spotting patterns that repeatedly get your audience clicking, you can devise effective strategies and content plans for getting more link clicks.
How to see 24h data for Link Clicks with Minter.io
Click on a specific Instagram story to reveal metric graphs which detail hourly breakdowns. With the Link Clicks 24h graph you can see the distribution of link clicks the story received in the first 24 hours by the hour. This graph details exactly when a specific piece of content gained link clicks within the lifecycle of an Instagram Stories post, giving you greater insight into audience behaviour and timing. Use this graph in conjunction with other 24 hour graphs, such as the Reach 24h graph, to see how the algorithm played a role in your content getting seen and interacted with.
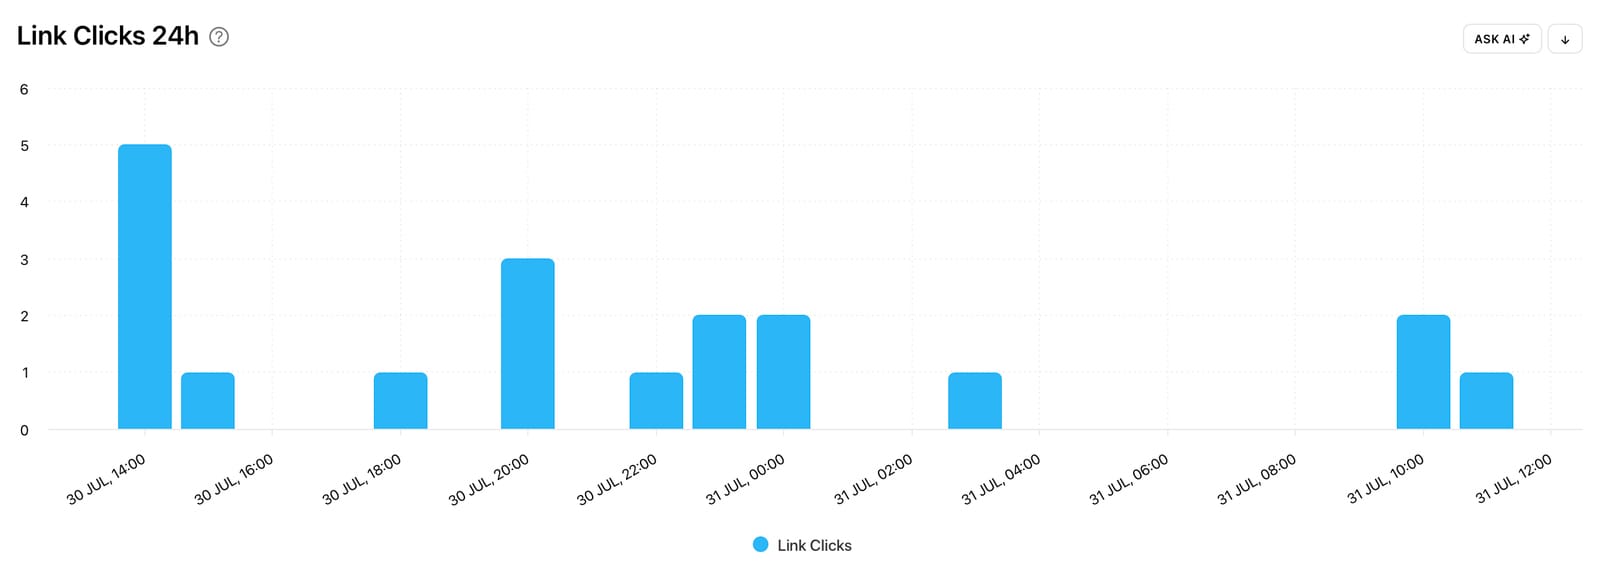
Link Clicks data is available on posts published from July 1st 2026, and there is no cap on how long the data remains available to you, meaning you can keep hold of all your Instagram Stories link click data to view, analyse and compare in perpetuity. Instagram accounts must be connected to Minter.io via Facebook login to access link click data.
Get access to your Link Click data by joining Minter.io now! Your unique data graphs are waiting for you…