Get more shares on Instagram with Minter.io

Let’s face it, we all want more shares. When someone sees our Instagram content, we want them to instantly think of someone who would love it and share it with them immediately, because there’s nothing quite as powerful as getting a recommendation from someone you trust. But in 2026 we no longer gather around a water cooler to gossip - we do it in the DMs. Social media has given sharing the muscle of a juiced-up gym bro, and we’re here to help you put some weight behind the potential and get some tangible gains.
Minter.io is a social media analytics tool built to give you all the knowledge you need to grow big online. Did you know that there are multiple shares graphs that you should be tracking to make the most of your content on Instagram? In this article, we’re going to enlighten you on the graphs and features provided by Minter.io that make it easier to increase the amount of shares you get on your Instagram content.
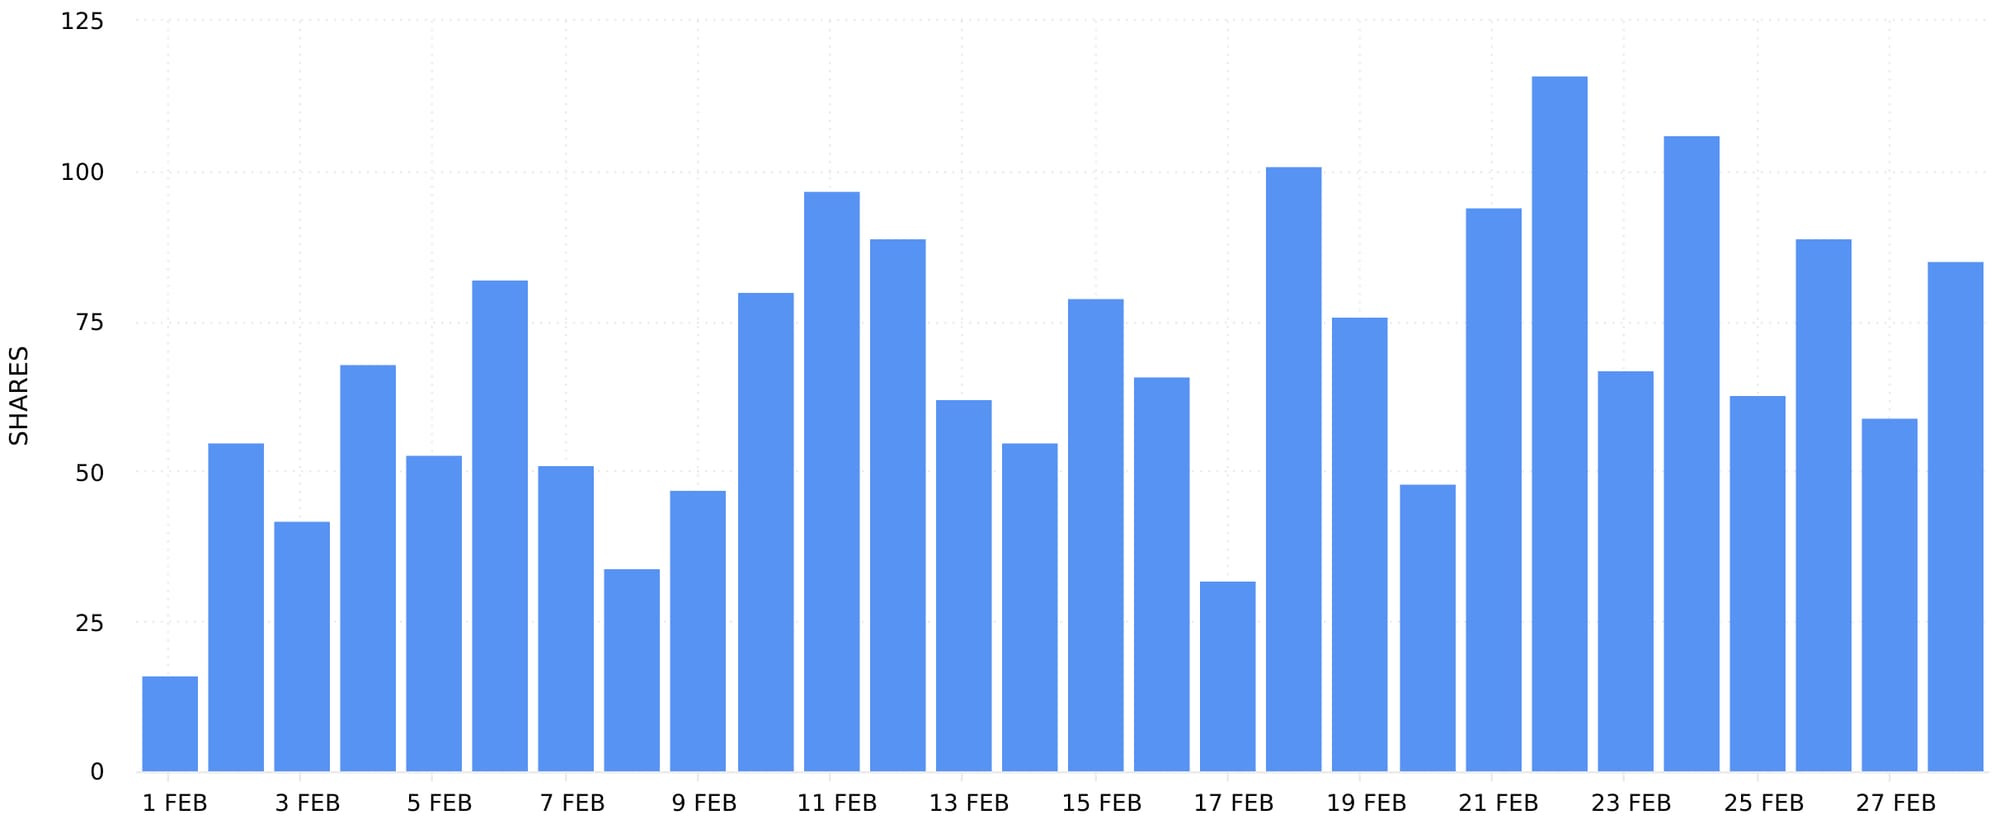
Post Shares
The Post Shares graph shows the number of times posts were shared during the selected date range. Head to the Posts section of your Instagram data on Minter.io to find it. This graph is split into content types to help you understand which content types are gaining you shares.
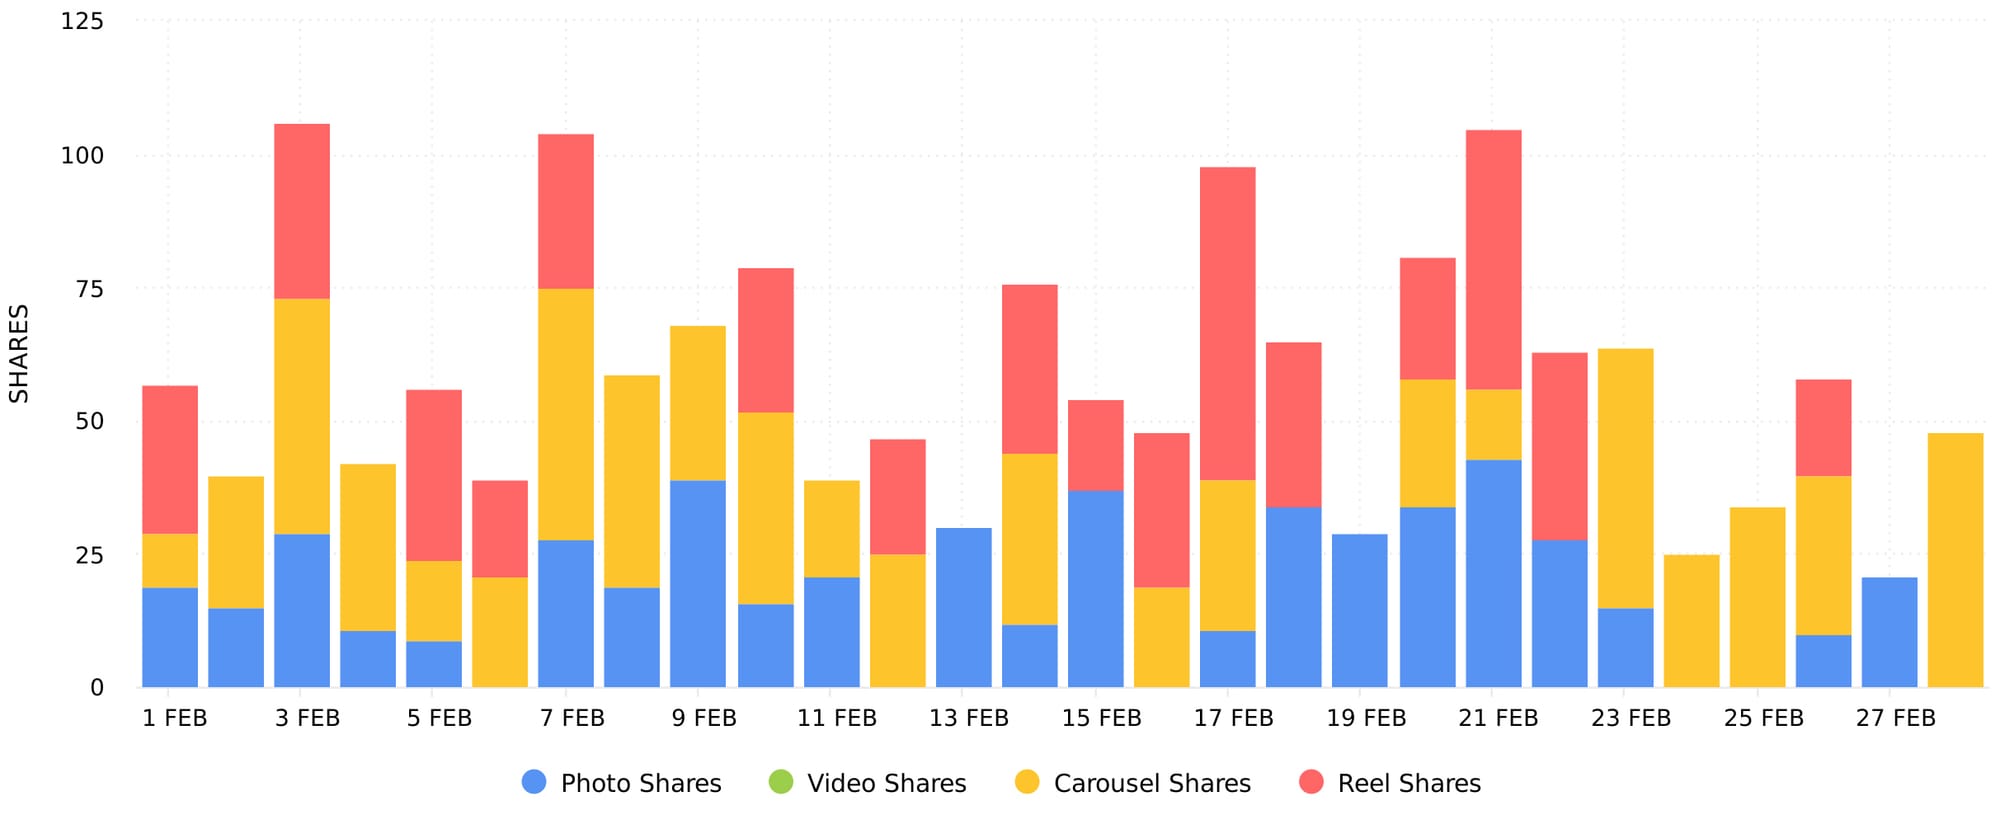
Use this graph to determine when you gained shares and which content types gained you the most shares. If one content type continually and significantly outperforms the others, you may wish to focus on creating more of that type of content. Take note of any spikes and dips in the data and explore what may have caused these. Look into whether actions you’ve taken (such as posting frequently, maintaining content quality or trendjacking) or external factors (such as holidays, events or appearing in media) have influenced the amount of shares you’ve gained. For example, you could use this graph in conjunction with the Number of Posts graph to determine whether shares increased when the number of posts published increased. This can provide further insight as to how to replicate ideal conditions for increased shares.
Stories Shares
The Stories Shares graph shows the number of times stories were shared during the selected date range. Head to the Stories section of your Instagram data on Minter.io to find it.
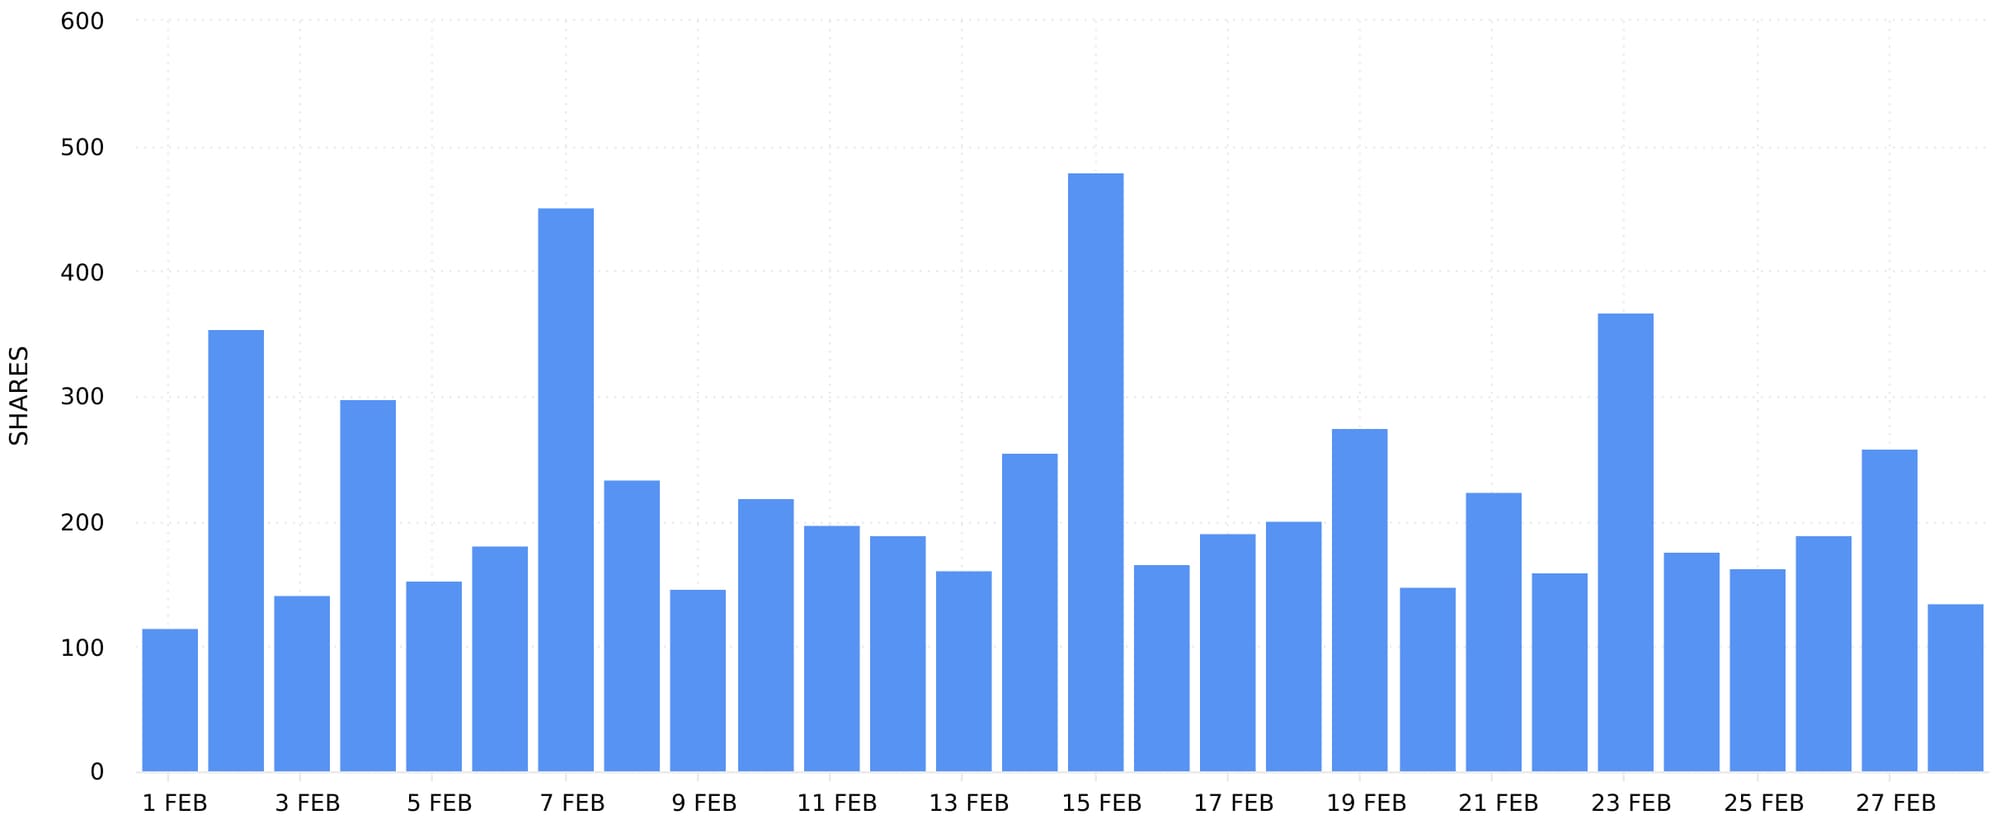
Use this graph to determine when you gained shares on Instagram Stories content. This can help you understand how your use of Instagram Stories influences the amount of shares you gain on this type of content. Take note of any spikes and dips in the data. Was the posting frequency, topic, location or style of the content noticeably different around changes in data? Did you use specific engagement techniques, stickers or call to actions? Analysing the stories published when shares increased can help you replicate standout content with ease.
Ad Shares
The Ad Shares graph shows the number of times ads were shared during the selected date range. Head to the Ads section of your Instagram data on Minter.io to find it.
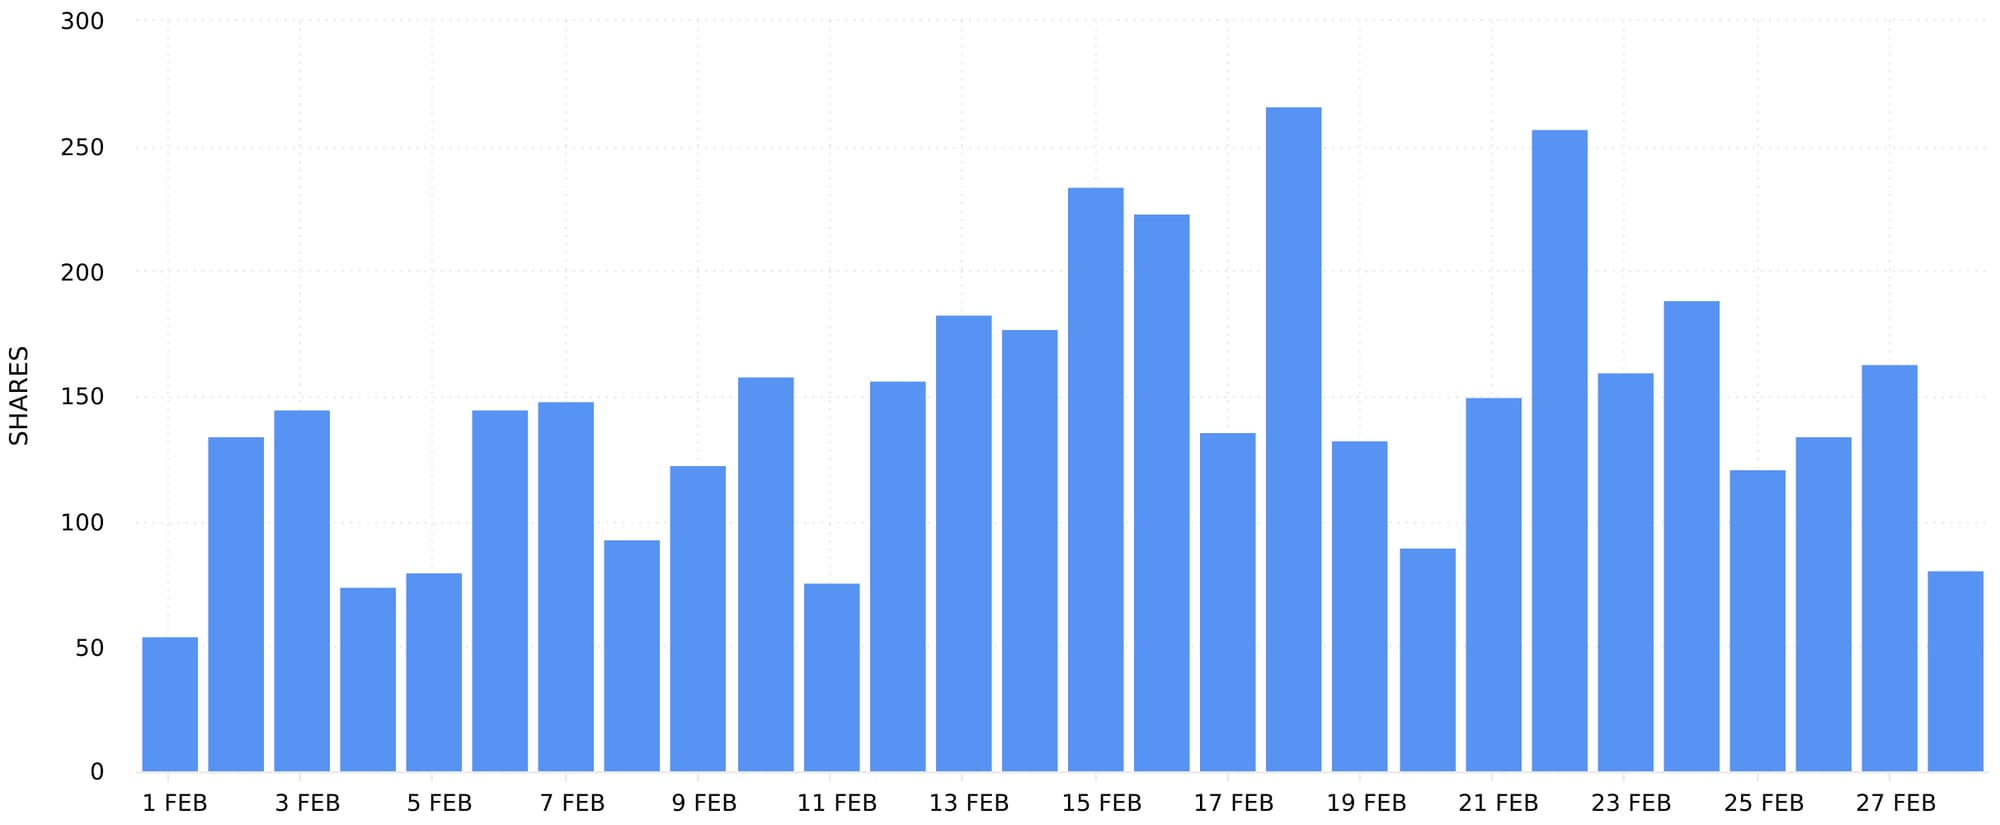
Use this graph to determine which ads, campaigns and paid efforts gained the most shares. Take note of spikes and dips in data. Were additional funds poured into advertising when shares spiked or was a particular creative involved in the additional engagement? With a little exploration, finding out which efforts resulted in the most shares could pivot you into saving time, effort and money, all while encouraging the audience to push your brand to even more people.
Profile Shares
The Profile Shares graph shows the number of times all content (including older posts, stories and ads) were shared during the selected date range. This is different to the previous graphs which show the amount of shares gained by content published within the selected date range. Head to the Profile section of your Instagram data on Minter.io to find it.
This is the ultimate graph for viewing overall trends in the amount of shares your content gained. Take note of peaks and dips across all your content as well as whether the amount of shares is on a steady or sharp incline or decline, or whether it’s hit a plateau. Use this graph in conjunction with any (or all) of the graphs above to determine whether your chorus of content is working in harmony or whether a section is hitting all the bum notes.
Sort all Posts, Stories or Ads by Shares
Head to the All Posts, All Stories or All Ads section of your Instagram data on Minter.io to find all your posts, stories or ads from the selected date range in one place. From here you can sort your content by shares. This nifty little feature is the shortcut to finding the best-performing content in the metric of your choice.
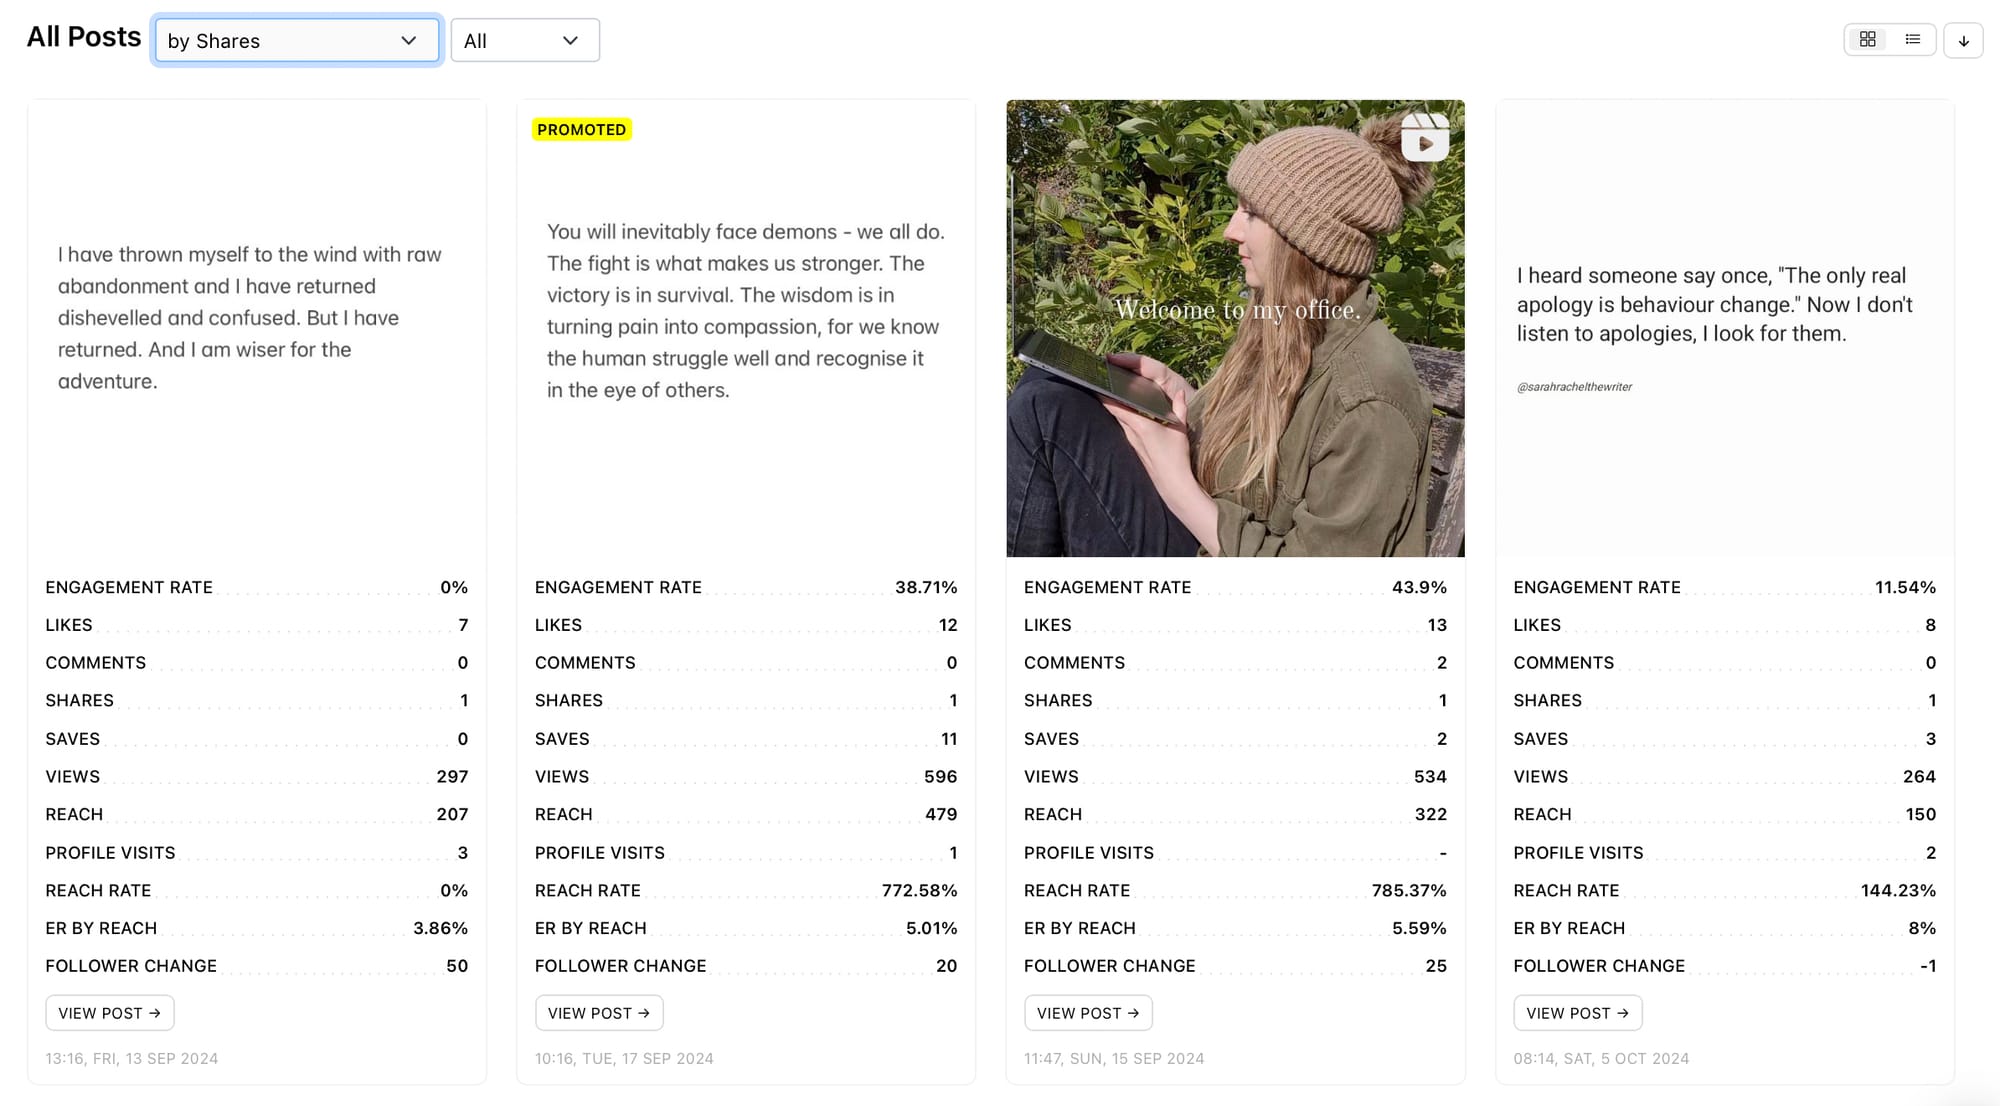
When your content is sorted by shares, the content with the highest amount of shares is placed at the top. Unravel the techniques used in your most-shared content to craft more new content that is likely to also gain a high amount of shares. What was different about your most-shared content? What was the editing style, the theme or topic and the media type? Did you include a call to action, text overlays or a voiceover? Was your description long or short? Did it include emojis, a prompt or hashtags? Every element included in your most-shared content can help inform new creatives with can encourage increased shares.
72 Hour Shares
Select a post and scroll down to find the 72 Hour Shares graph. This graph shows the distribution of shares the post received in the first 72 hours by hour.
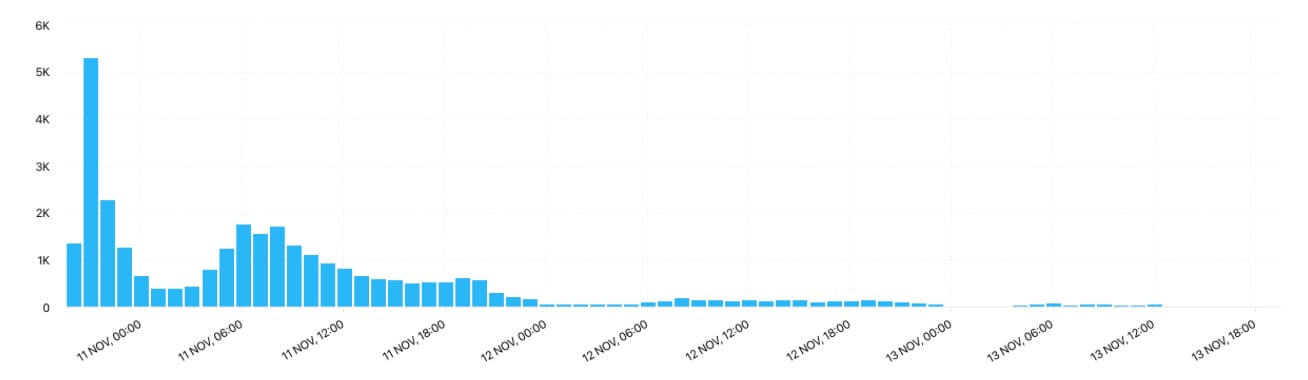
Learning about how content performed early after publication can help you understand how the earliest viewers interacted with it and how the algorithm responded and placed it. Spikes and inclines in shares signal algorithm activation, whereas dips and declines nod to interest tapering off. Understanding the amount of shares your top-performing content gained early after publication can provide clues as to whether a new piece of content is likely to take off. Use this graph in conjunction with other 72 hour graphs to get a clearer picture of engagement overall.
AI Analyst
If you like a little AI spice in your life, look no further than the Minter.io AI Analyst. This pocket rocket of a powerhouse makes getting more shares so easy it almost feels like cheating. Simply type in the box or choose a prompt and let the AI Analyst work its magic. Strategic recommendations are at your fingertips in seconds, and it knows exactly how you tick because it’s totally tailored around your unique profile. This is one artificial intelligence tool that will keep you coming back for more.
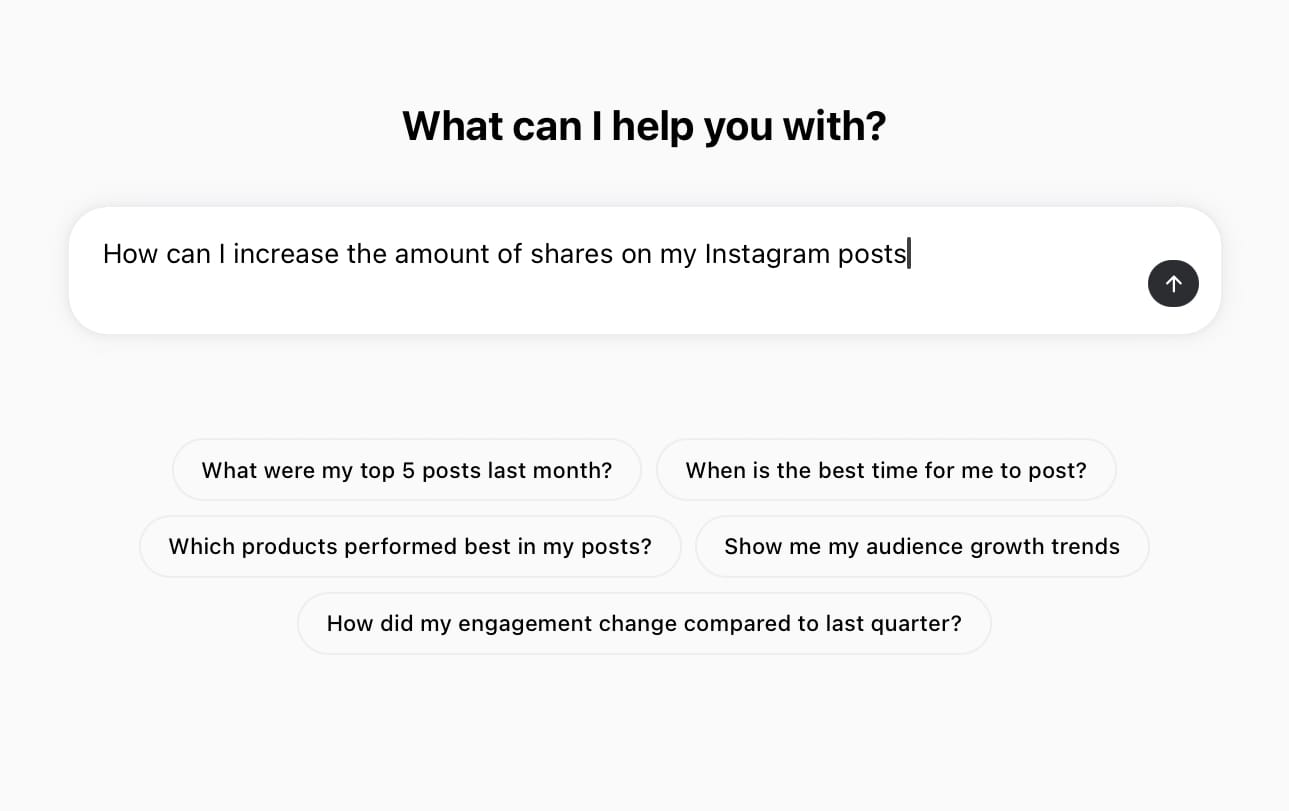
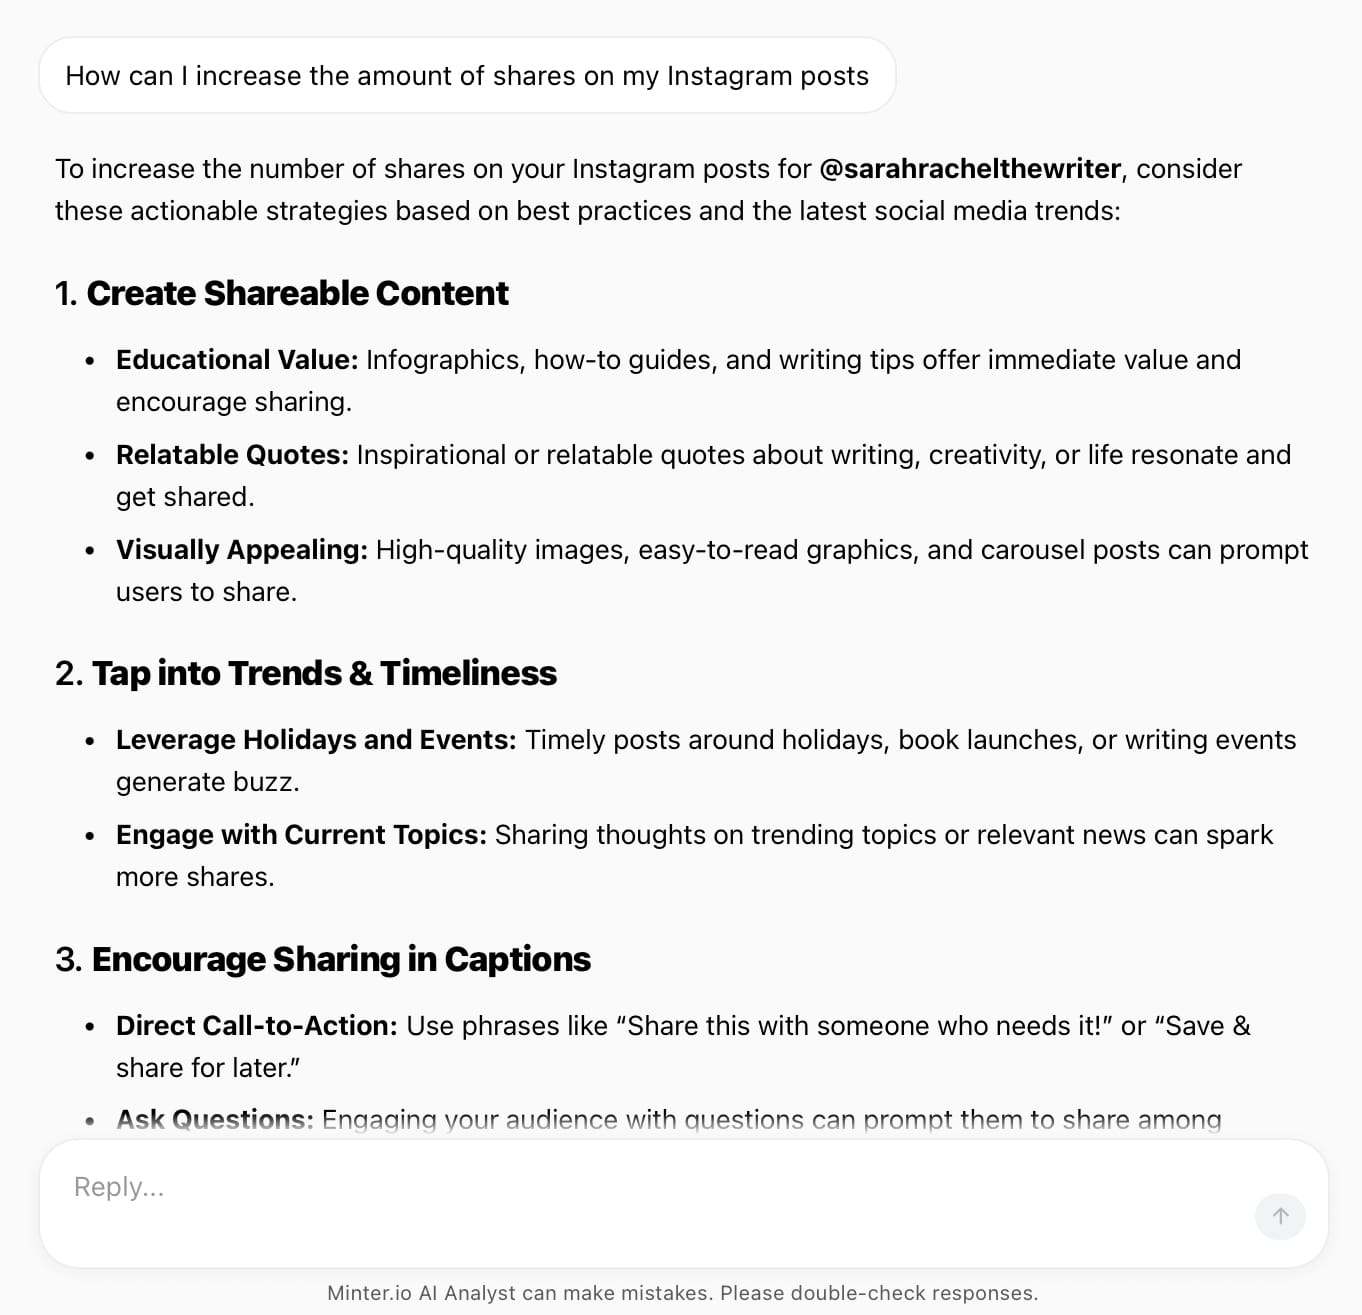
AI Analyst by Minter.io
Export Data
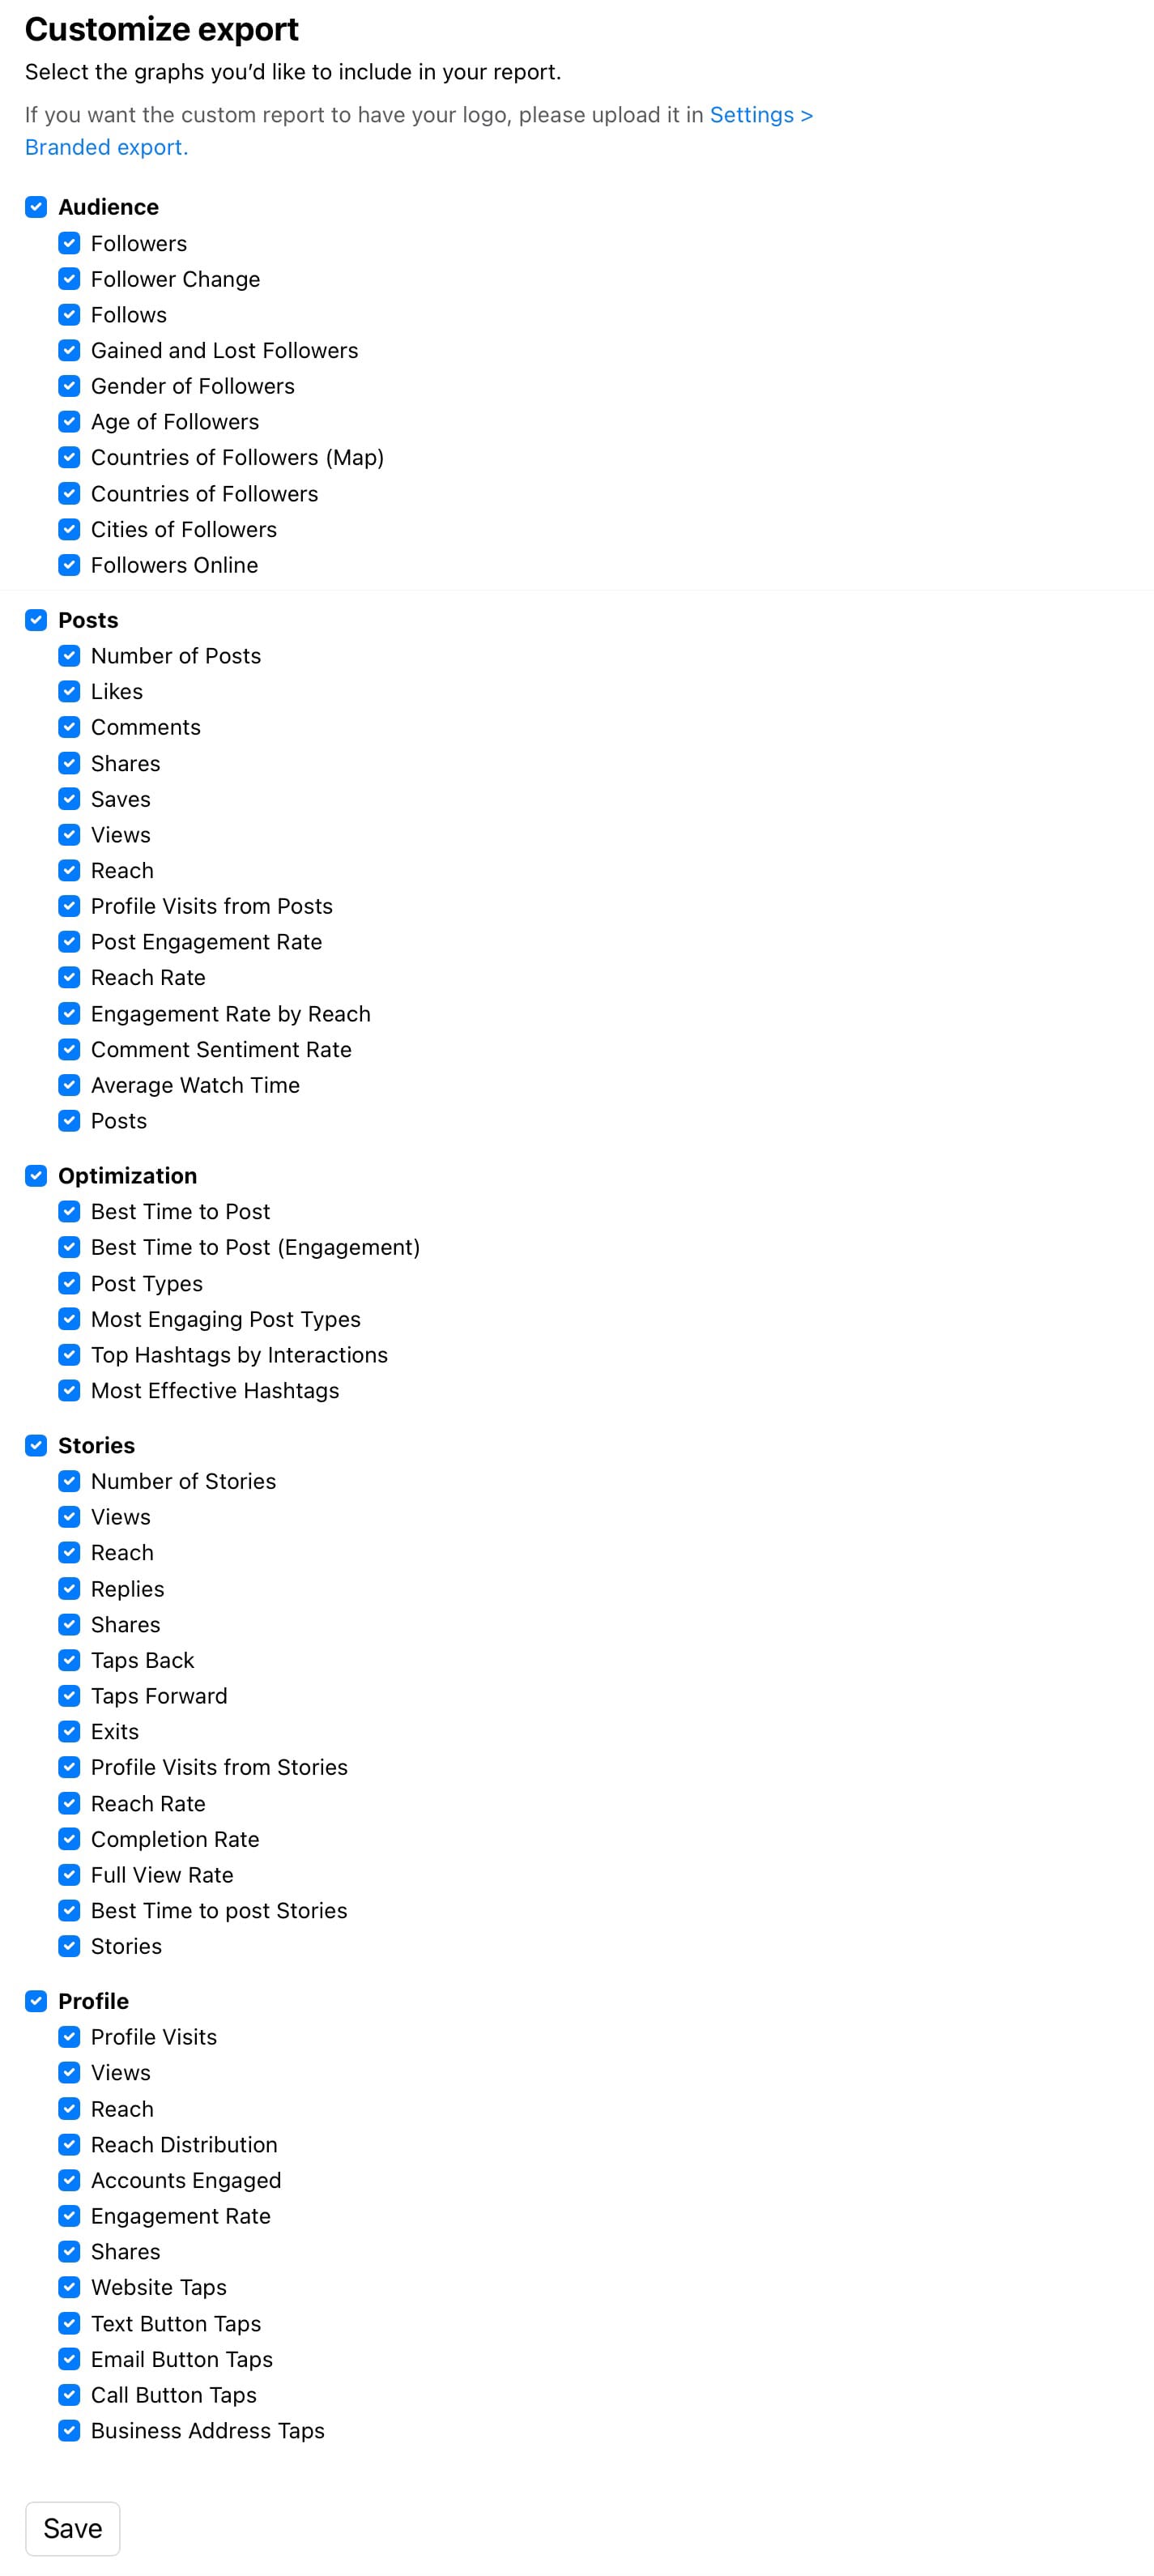
When you’ve had your fun and it's time to show your triumph to your team, export your Instagram analytics data to XLS, CSV or as a presentation-ready PDF or PPTX report. You can also schedule reports to be automatically emailed to you, your boss or another person who might need them (even your mum if you want a pat on the back).
Now that you’ve seen how to get more shares on Instagram, it’s time for us to share your graphs with you! Head to Minter.io now for your free trial and see how we could be the little secret that you can’t wait to share with everyone you want to see succeed on social media.
Create your best content ever with analytics