How to optimise Instagram content with Minter.io
There’s nothing more heartbreaking than spending hours on content creation, only for your best ideas to flop. Luckily, there’s a way to avoid disappointment - by optimising your Instagram content to give it the best chance of performing well.
In this article, you'll learn:
- When to post content to give it the best chance of gaining the most interaction
- Which types of posts gain the highest engagement for your profile
- Which hashtags are effective at growing your brand
With this important optimisation information to hand, you can look forward to better results from the content you publish.
Minter.io and optimisation
At Minter.io we transform your unique data into helpful graphs to support your brand in succeeding on social media. We offer a wide range of graphs which can assist you in learning about your audience, your content, your profile and your growth. Optimisation is a key component of brand growth online, so we’ve dedicated an entire section of Instagram metrics to optimisation graphs, which can help you easily identify how best to connect with your target audience in an effective way. Your graphs are unique to your profile and they continually update as you publish new content. The more you publish on Instagram, the more information you’ll have to work with, so you can adapt and adjust your approach as you grow.
Choose a time frame
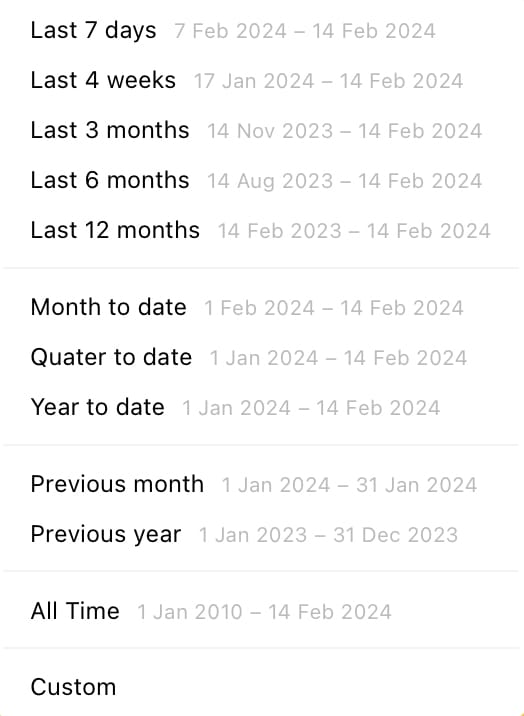
In the top right-hand corner of your Minter.io metrics page is the date picker. It allows you to customise your graphs by any time frame. You can fully customise the date range or pick a preset that suits you. Whether you want to view recent data, data from all time or what worked well during a specific quarter or Instagram campaign, the date picker is the place to start.
Best Time to post
The Best Time to post graph shows the number of interactions on Instagram posts published at specific times and on specific days of the week within the selected date range. The darker the colour, the higher the number of interactions on posts published within that time window. The number written over each tile represents the number of interactions. For example, in the graph below, Instagram posts published on Sunday at 9pm gained 982 interactions.
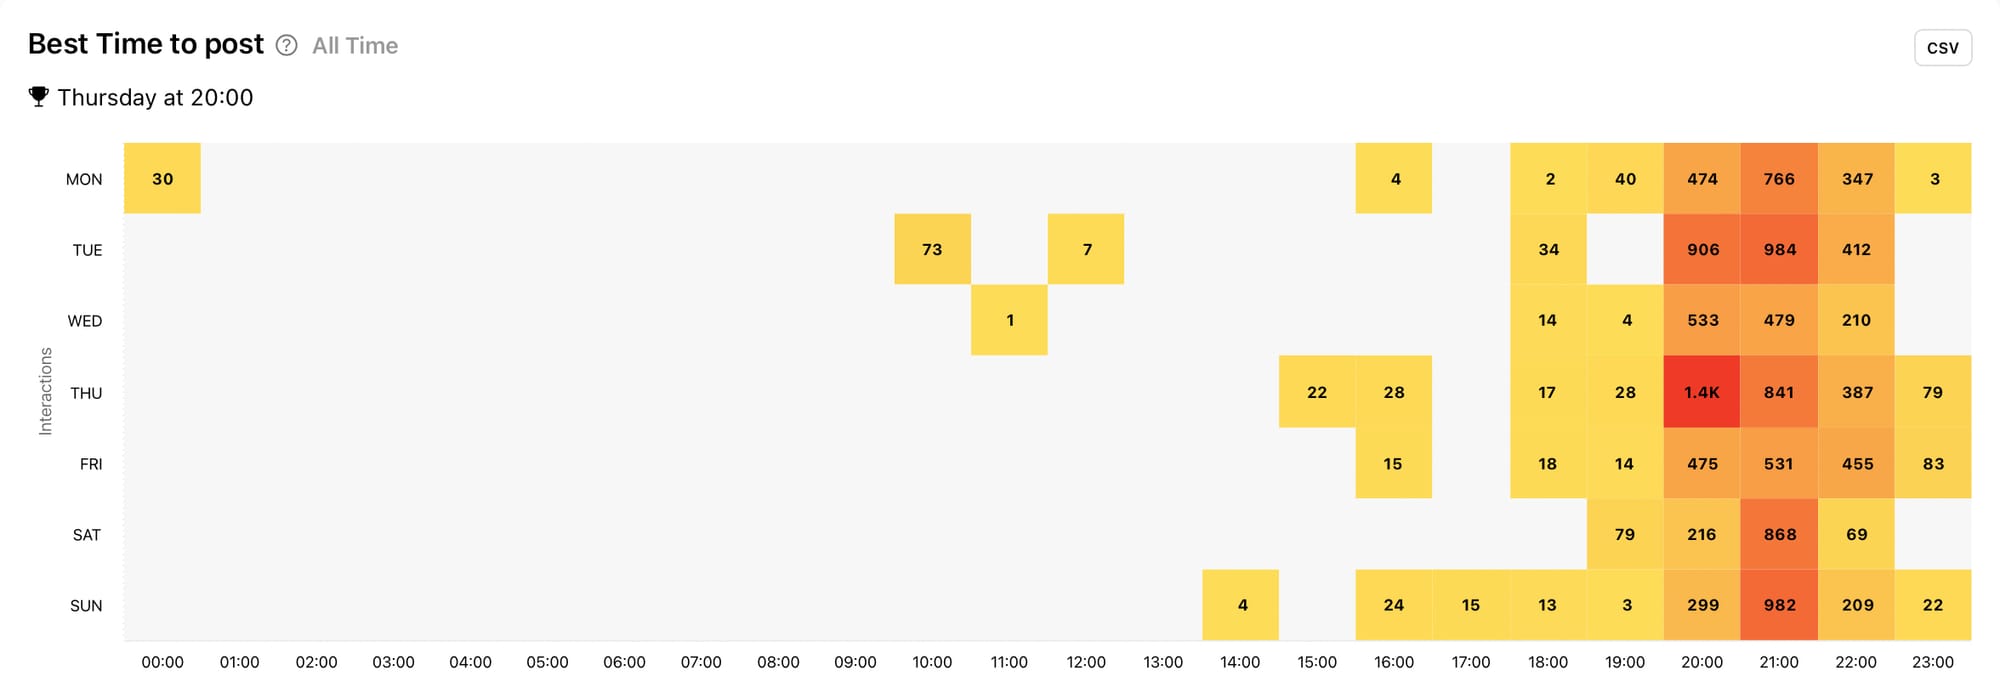
In the left-hand corner, above the graph, is the day of the week and time of the day that gained the highest number of interactions. This makes it easy for you to find the best time to post at a glance. In the example above, Thursday at 8pm is the best time to post for this profile. You can use the rest of the graph to get an idea of good times to post on other days, as well as times and days to avoid.
Best Time to post, Engagement
The Best Time to post, Engagement graph shows the average engagement rate of Instagram posts published at specific times and on specific days of the week within the selected date range. The darker the colour, the higher the average engagement rate of content published within that time window. The number written over each tile represents the average engagement rate percentage. For example, in the graph below, Instagram posts published on Monday at midnight totalled an average engagement rate of 6.82%.
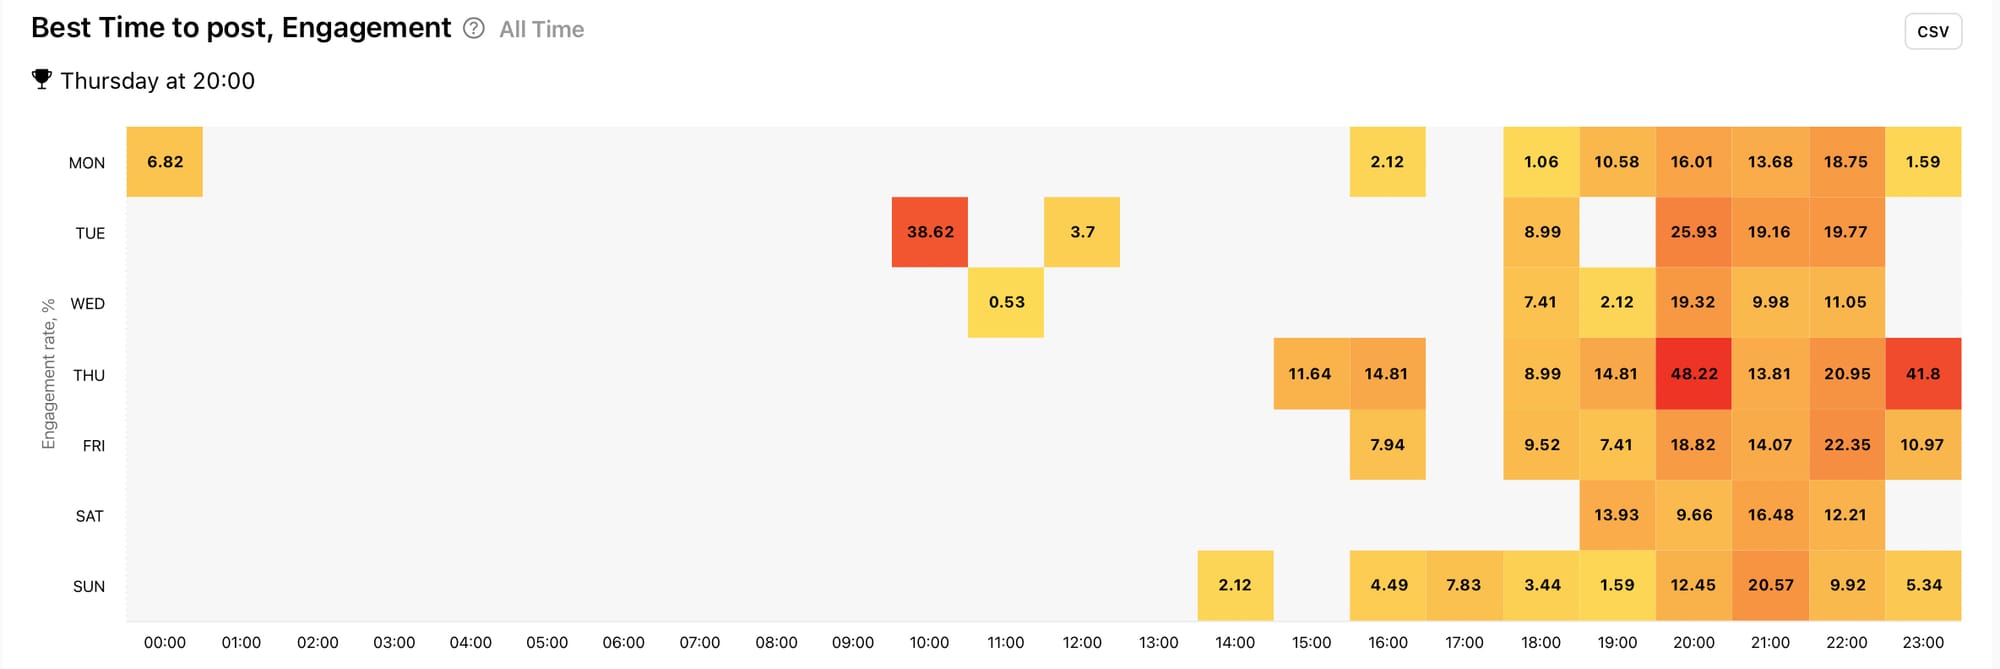
In the left-hand corner, above the graph, is the day of the week and time of the day that gained the highest average engagement rate. In the example above, Thursday at 8pm is the best time to post for engagement for this profile. This lines up nicely with the previous graph, confirming that this is the best time overall for this profile to publish Instagram content.
Post Types & Most Engaging Post Types
The Post Types graph shows the types of posts published within the selected date range. Post types include photo, video, carousel and reel posts. Each post type is represented by a different colour to make the content split clear. This graph can give you an idea of whether you’re favouring a particular post type.
The Most Engaging Post Types graph shows the distribution of post types sorted by the number of interactions on each post type, within the selected date range. This graph can help you see which post type is getting the most engagement.
These graphs are displayed side by side so you can easily compare what you are posting with which content type is performing the best for your profile in terms of engagement.
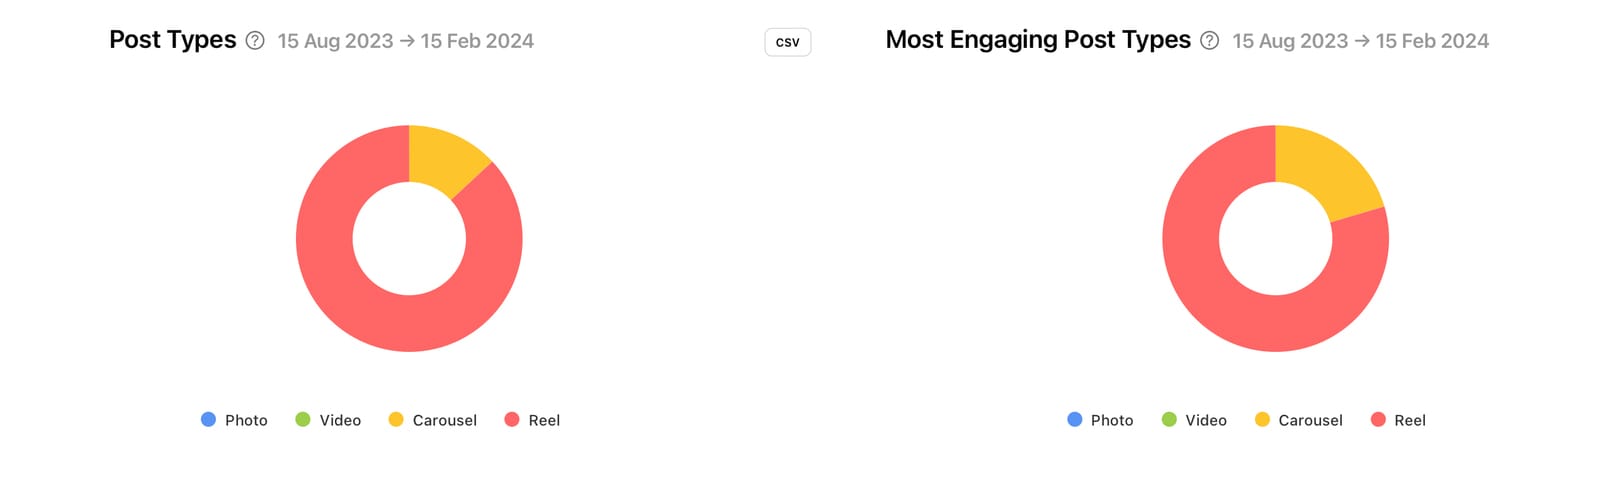
In the example above, the profile posted reels and carousel posts within the selected date range. Carousels made up 13% of the posts but gained 21% of the engagement! This suggests that including more carousel posts in upcoming content could boost content engagement overall.
Are your graphs consistent or is one content type gaining significantly more interactions than other content types? Leaning into what your audience is responding well to is a simple way to boost engagement across your content. If you’re only posting one or two post types, consider experimenting with other content types to gain more data and find out what your audience responds best to.
Top Hashtags by Interactions
The Top Hashtags by Interactions graph shows the top hashtags within the selected time frame sorted by the total number of interactions. Interactions include likes and comments. This graph shows the hashtags you have already used on published Instagram posts, so it’s easy to learn which hashtags are currently working best for your brand as well as hashtags that could be replaced.
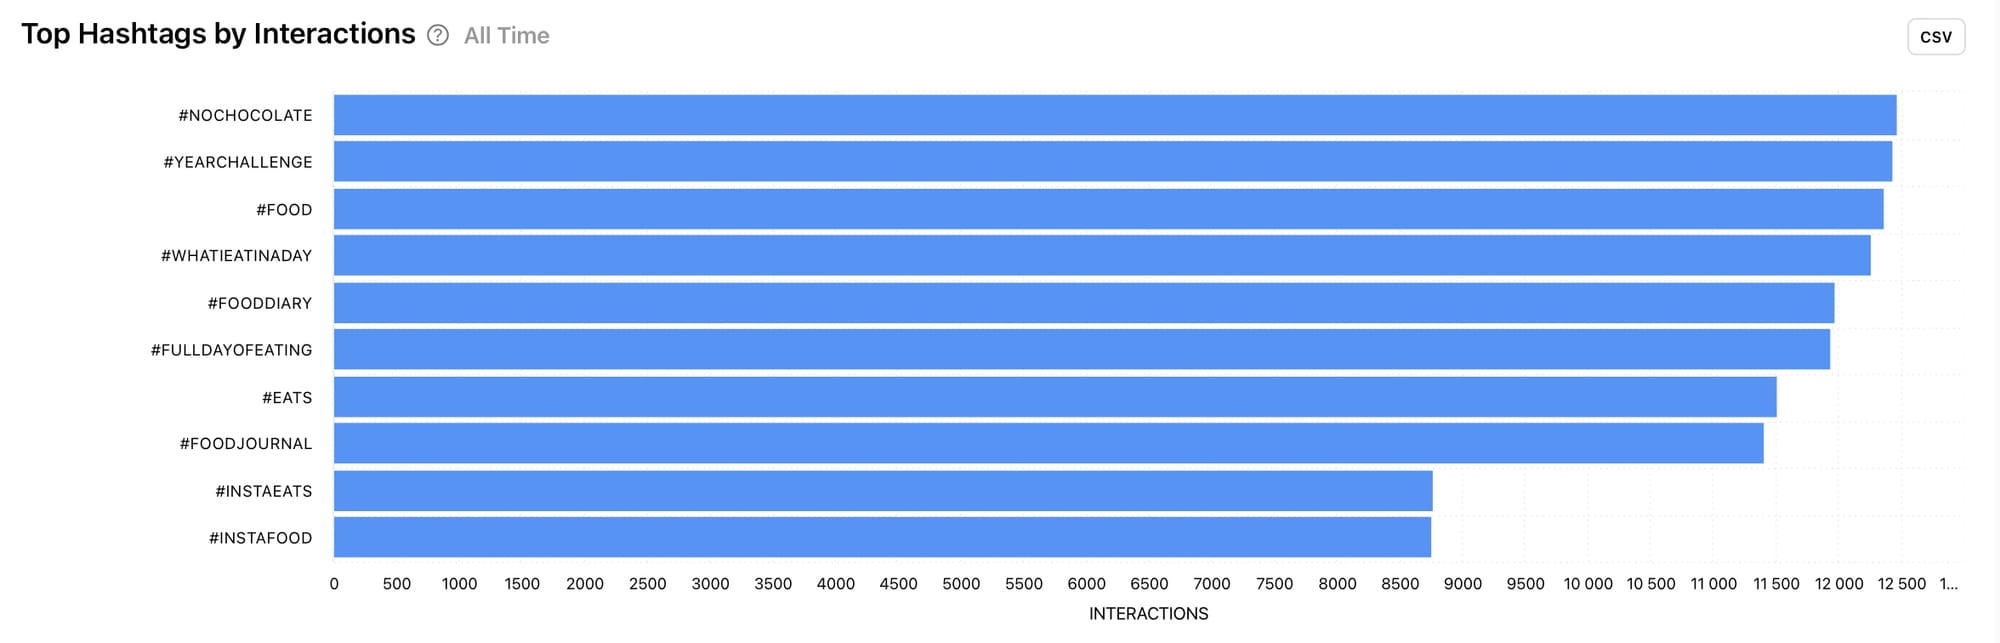
Are you regularly using your top hashtags? Are there hashtags you are using that aren’t doing much for your visibility? The more you experiment with hashtags, the more useful this graph becomes, so research hashtags for your niche and use this graph to see which ones connect best with your followers.
Most Effective Hashtags
The Most Effective Hashtags graph shows the top hashtags within the selected time frame sorted by the average number of interactions. Interactions include likes and comments. Finding a combination of hashtags that are effective for your brand on Instagram is made easy when you use this graph in tandem with the previous graph.
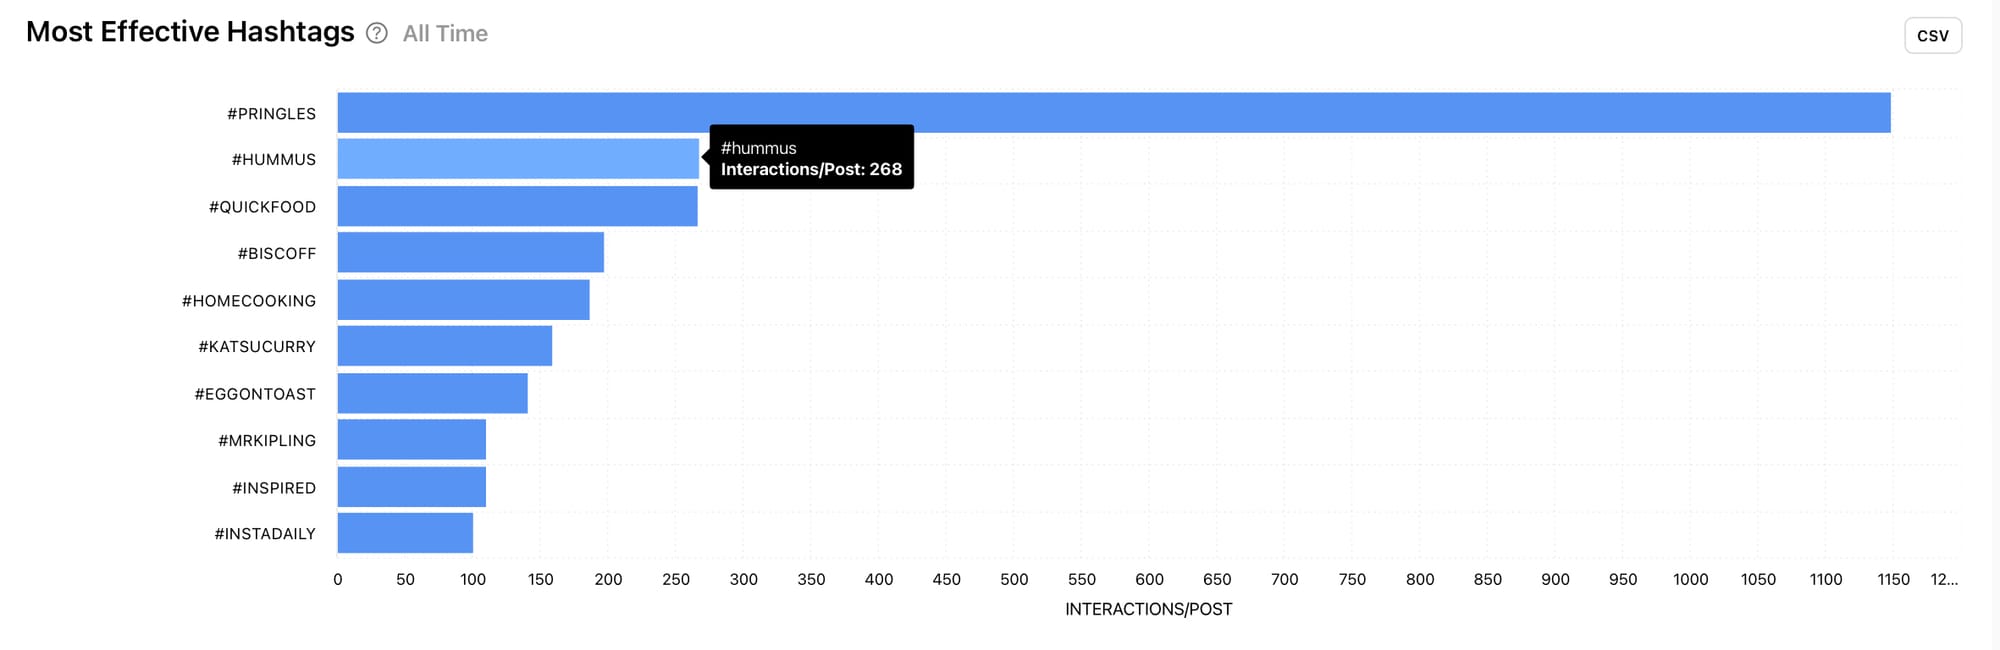
In this graph and the previous graph, hover over a bar to view more information about the interactions gained by a specific hashtag. This will give you a clearer picture of how your hashtags are working for your brand on Instagram.
A final note
Remember, the more you post, the more data there is to apply to your optimisation efforts. These graphs adapt and grow with your brand, helping you to continually stay up-to-date with what is working for you and your audience.
If you’re just starting out, here are some things you can try to get you started:
- Research best practices
- Look at what is working for other brands in your niche
- Experiment to gain data fast
- Track competitor brands with Minter.io to see how they’re optimising on Instagram
If you’ve enjoyed learning how to optimise your brand on Instagram, you might also find value in optimising your brand on TikTok. Check out our article which walks you through the steps. To sign up to Minter.io and unlock your own optimisation graphs, click here.
Start your free trial now→