
How to check my Instagram engagement rate

Instagram's in-app insights provide a brief overview of your content performance, but look there for your engagement rate and you won’t find it. An engagement rate is an important key performance indicator that brands, businesses and collaborators often require to secure sponsorships, business opportunities and set rates. It also provides vital context for your content performance beyond the number of likes or comments it gains. If you want to accept sponsorship deals or paid content opportunities, alongside tracking a metric which will give you a well-rounded approach to content performance, knowing your Instagram engagement rate information is a must.
What exactly is an engagement rate?
An engagement rate measures the amount of engagement a social media account or its posts get relative to its audience. Engagement rates typically take into account likes, comments, saves and shares in relation to the amount of followers an account has or the amount of reach a post gets. It is the percentage of the audience that chose to interact with posts. The higher the percentage the better.
Why your engagement rate is vital to track
Tracking your engagement rate information can help you understand your post and profile performance in a balanced way. It allows you to look beyond the number of likes or the amount of followers on your Instagram account and understand the total interactions in relation with your audience on Instagram.
Sponsors and brands often require engagement rate information to determine how engaged an audience is with an account and its posts. This helps determine the value of working with your brand and the amount of money they are willing to pay to have access to your audience.
How to find your engagement rate
Did you know: there are several different engagement rate calculations. Your post engagement rate, profile engagement rate and engagement rate by reach all have slightly different calculations. Depending on your needs and the opportunities you have available to you, you may need a specific engagement rate metric or several pieces of engagement rate information. Having access to multiple engagement rate metrics also helps you understand your social media performance in various different ways and gives you a more complete picture of your marketing efforts.
Instagram currently doesn’t include engagement rate data as part of the in-app insights, but the great news is that you don’t have to whip out a calculator or do any complicated sums to get hold of your engagement rate data. By using a third-party app such as Minter.io you can access your engagement rate information in a few clicks.
Instagram engagement rate graphs available with Minter.io
Minter.io enables you to view multiple engagement rate graphs that can help you confidently embrace sponsorship opportunities, set your rates, understand the value your social media presence brings collaborators and track your performance over time.
Let’s explore the engagement rate graphs in the Posts section of your Minter.io Instagram data…
Post Engagement Rate
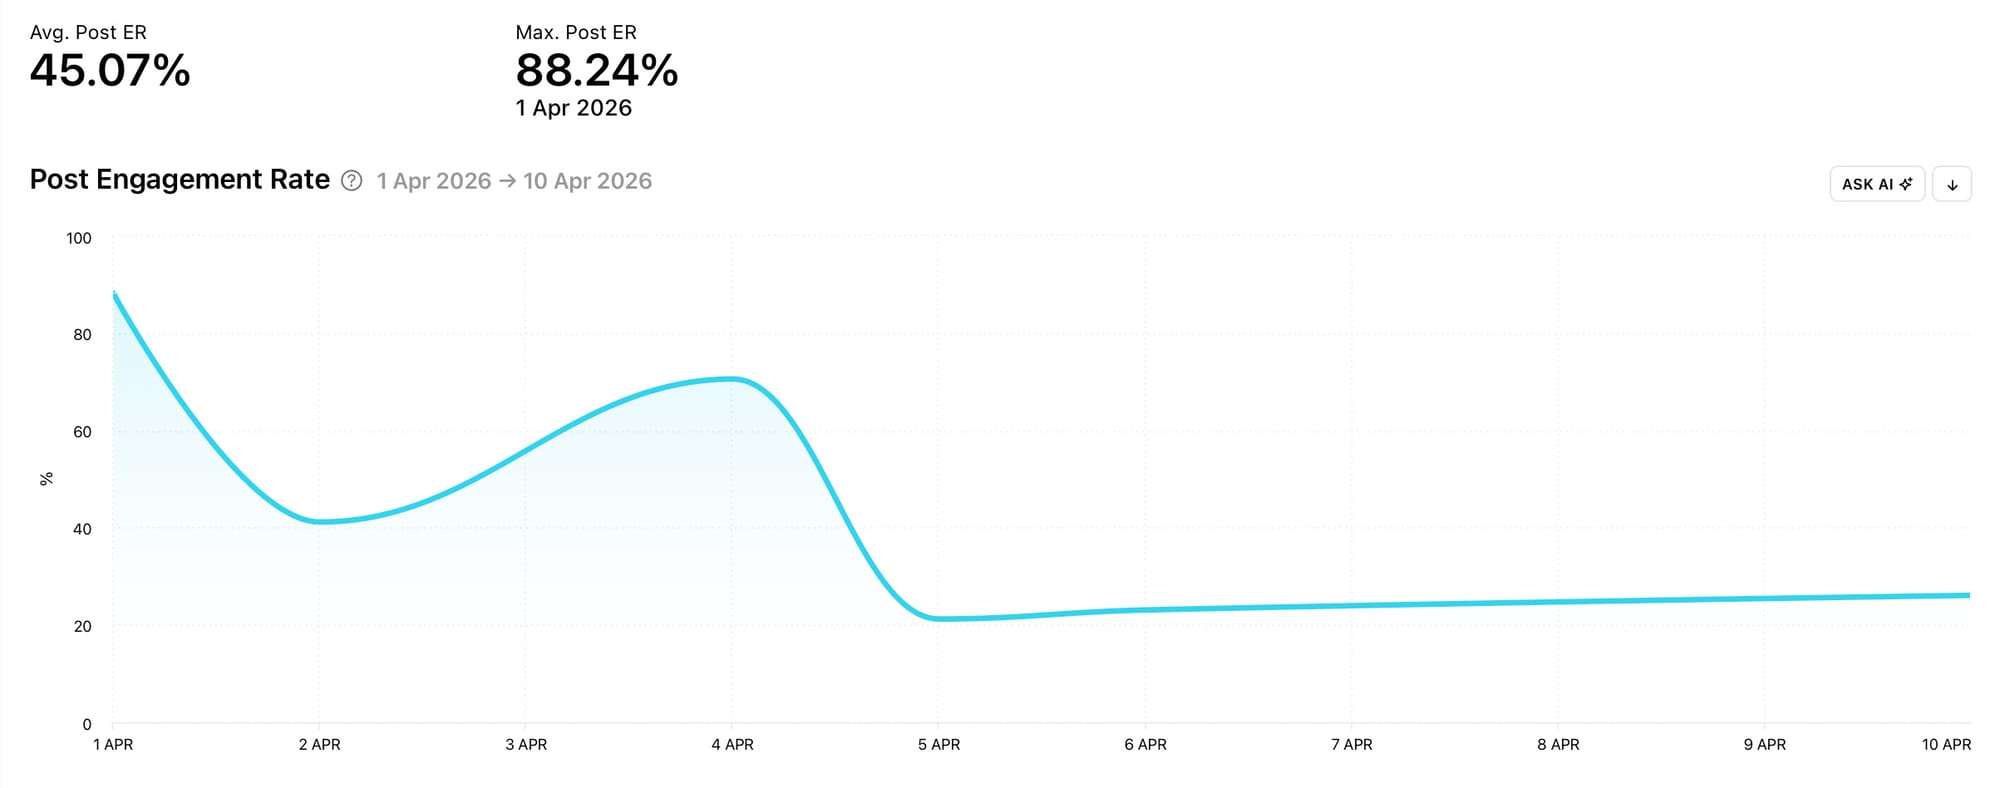
The Post Engagement Rate graph shows the percentage of followers that interacted with posts. It is the sum of all engagement (likes, comments, shares and saves) divided by the number of posts and by the number of followers on a given day during the selected date range. Above the graph is the average post engagement rate percentage and the maximum post engagement rate percentage. This helps you pick out useful information for your own needs or to send as required.
Post Engagement Rate by Reach
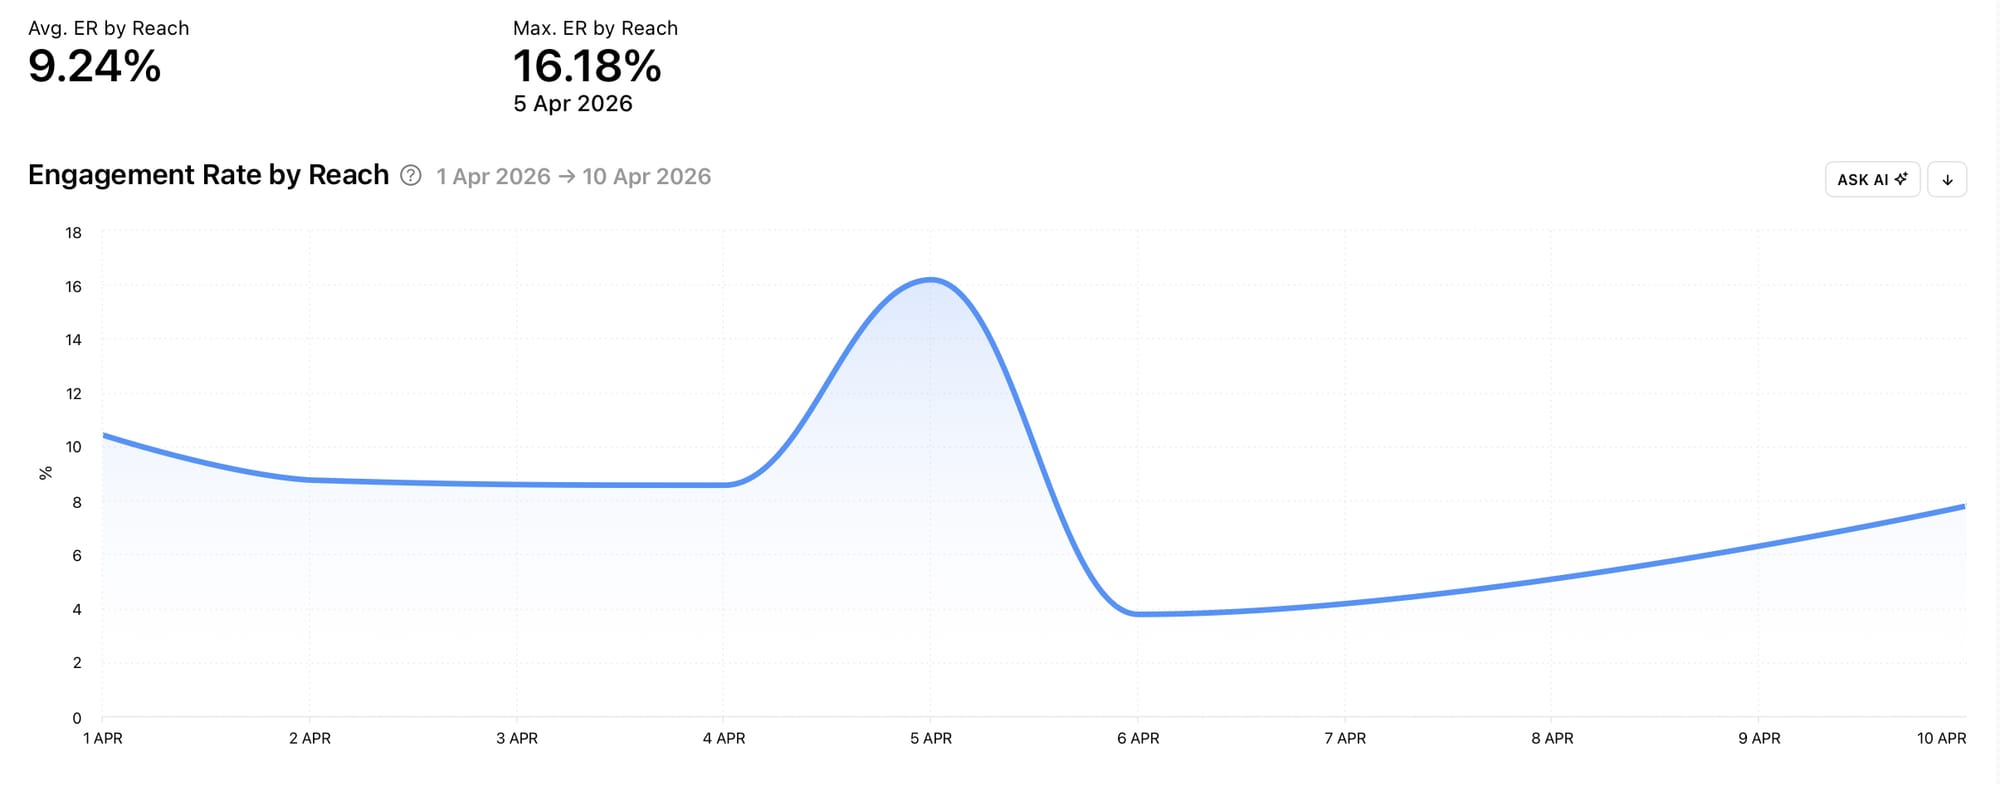
The Post Engagement Rate by Reach graph shows the percentage of unique accounts reached that interacted with posts. It is the sum of all engagement (likes, comments, shares and saves) divided by reach and by the number of posts on a given day during the selected date range. Above the graph is the average engagement rate by reach percentage and the maximum engagement rate by reach percentage.
Sort posts by Engagement Rate
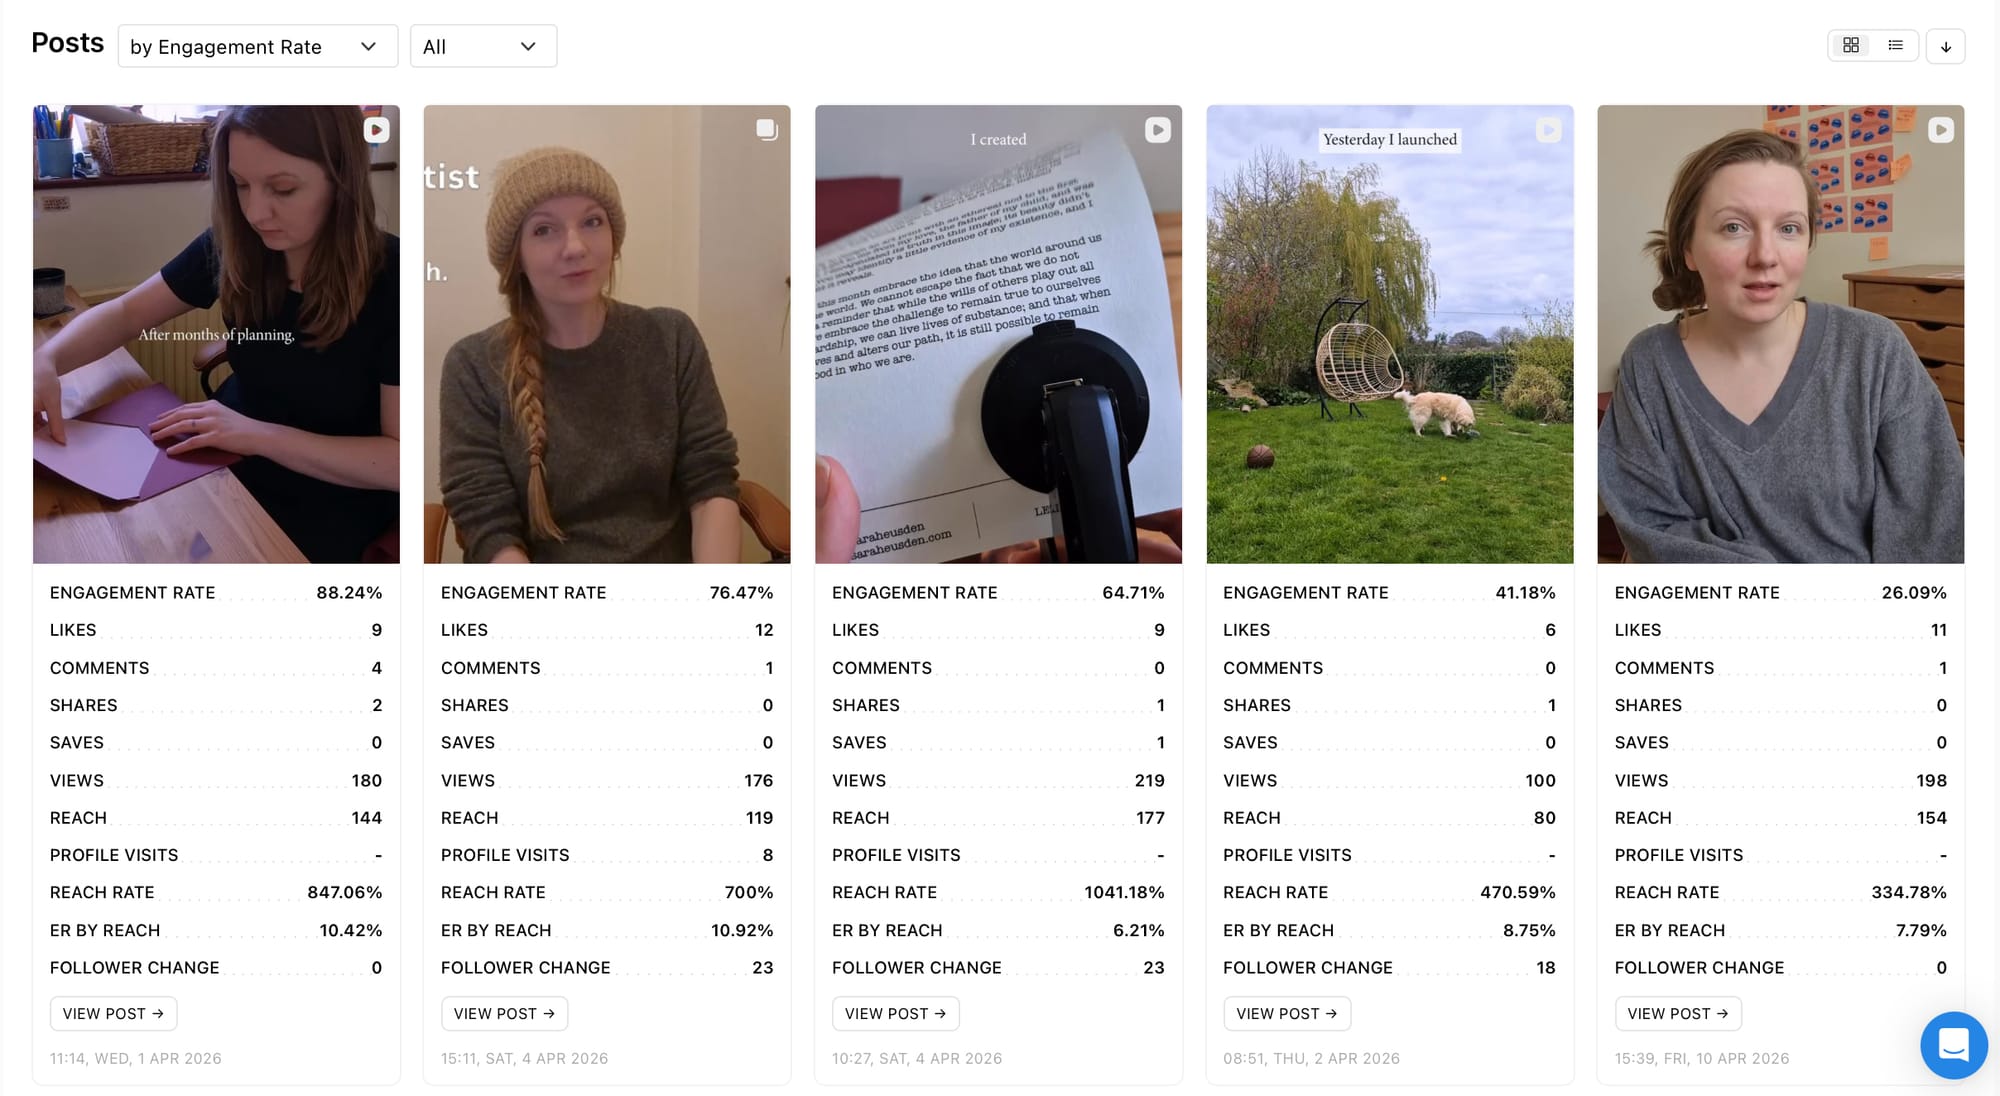
Sort your Instagram posts by engagement rate, engagement rate by reach or engagement rate by views. View all your post types or choose to view all images, carousels, reels, collabs or archived content. Choose a date range to view posts from or select ‘All Time’ using the date picker to view all your Instagram content.
Let’s explore the engagement rate graphs in the Ads section of your Minter.io Instagram data…
Ads Engagement Rate by Reach
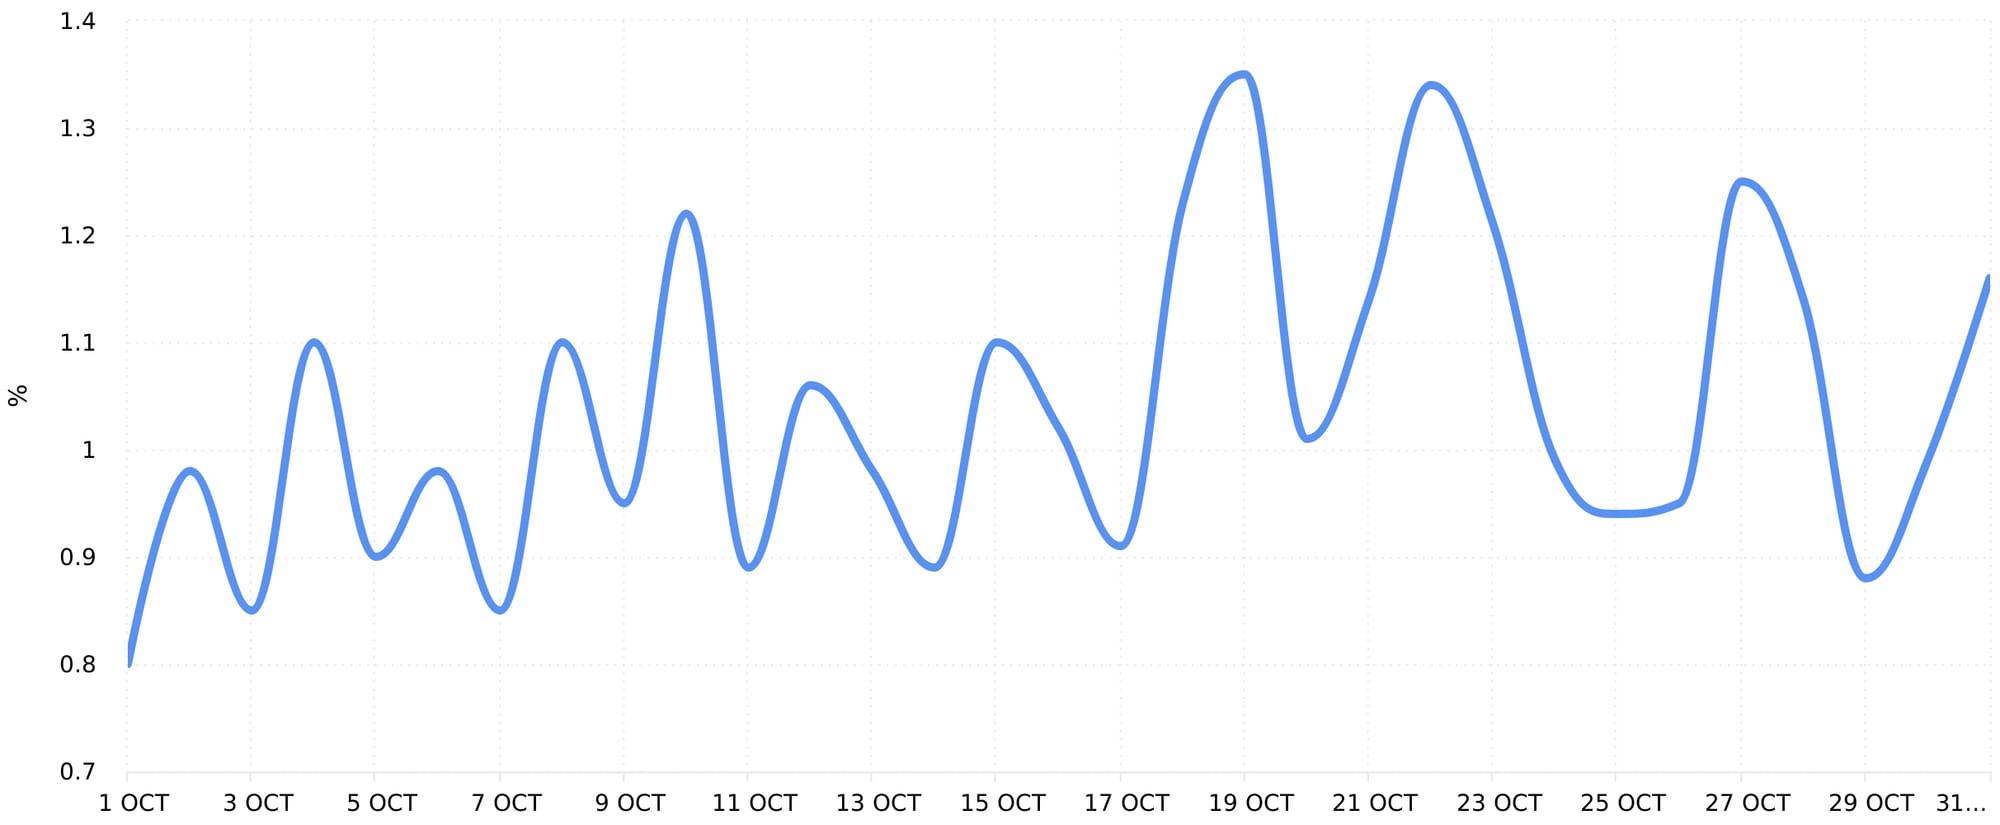
The Ads Engagement Rate by Reach graph shows the percentage of unique accounts reached that interacted with ads. It is the sum of all likes and comments divided by reach and by the number of ads on a given day during the selected date range.
Sort ads by Engagement Rate
Sort your Instagram ads by engagement rate or engagement rate by reach. View all ads or choose to view only image posts or reels.
Let’s explore the engagement rate graph in the Profile section of your Minter.io Instagram data…
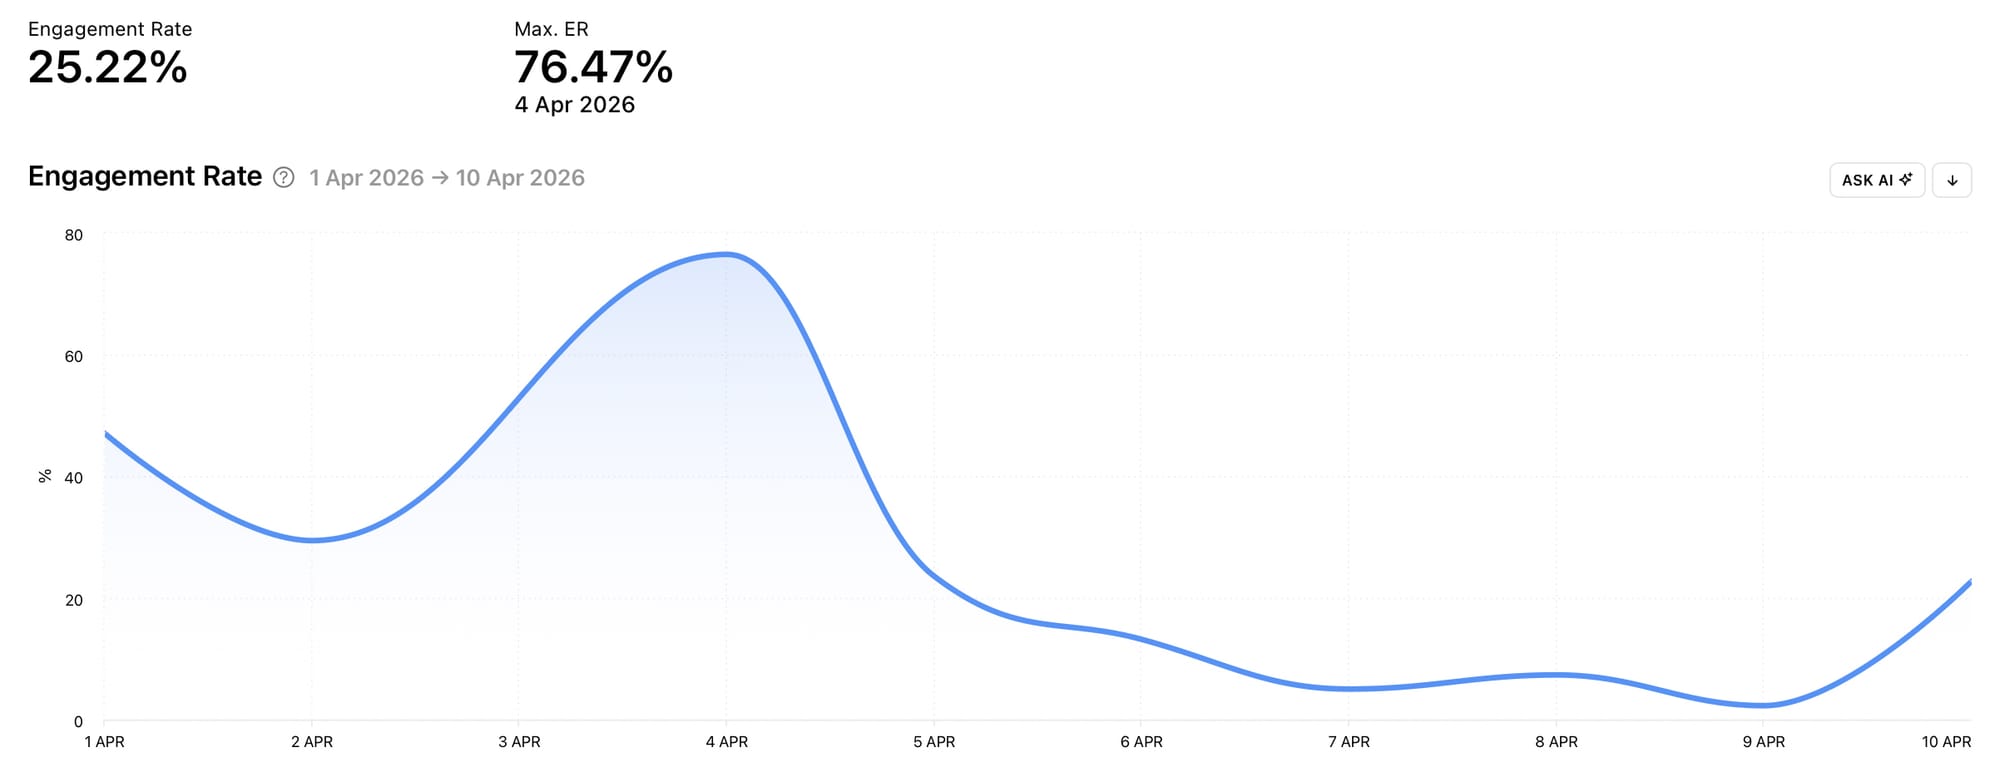
Profile Engagement Rate
The Profile Engagement Rate graph shows the percentage of followers that interacted with posts, stories or ads during the selected date range. Above the graph is the average engagement rate percentage and the maximum engagement rate percentage. This graph differs from the graph in the Posts section as it includes stories and ads.
Let’s explore the engagement rate graph in the Benchmarks section of your Minter.io Instagram data…
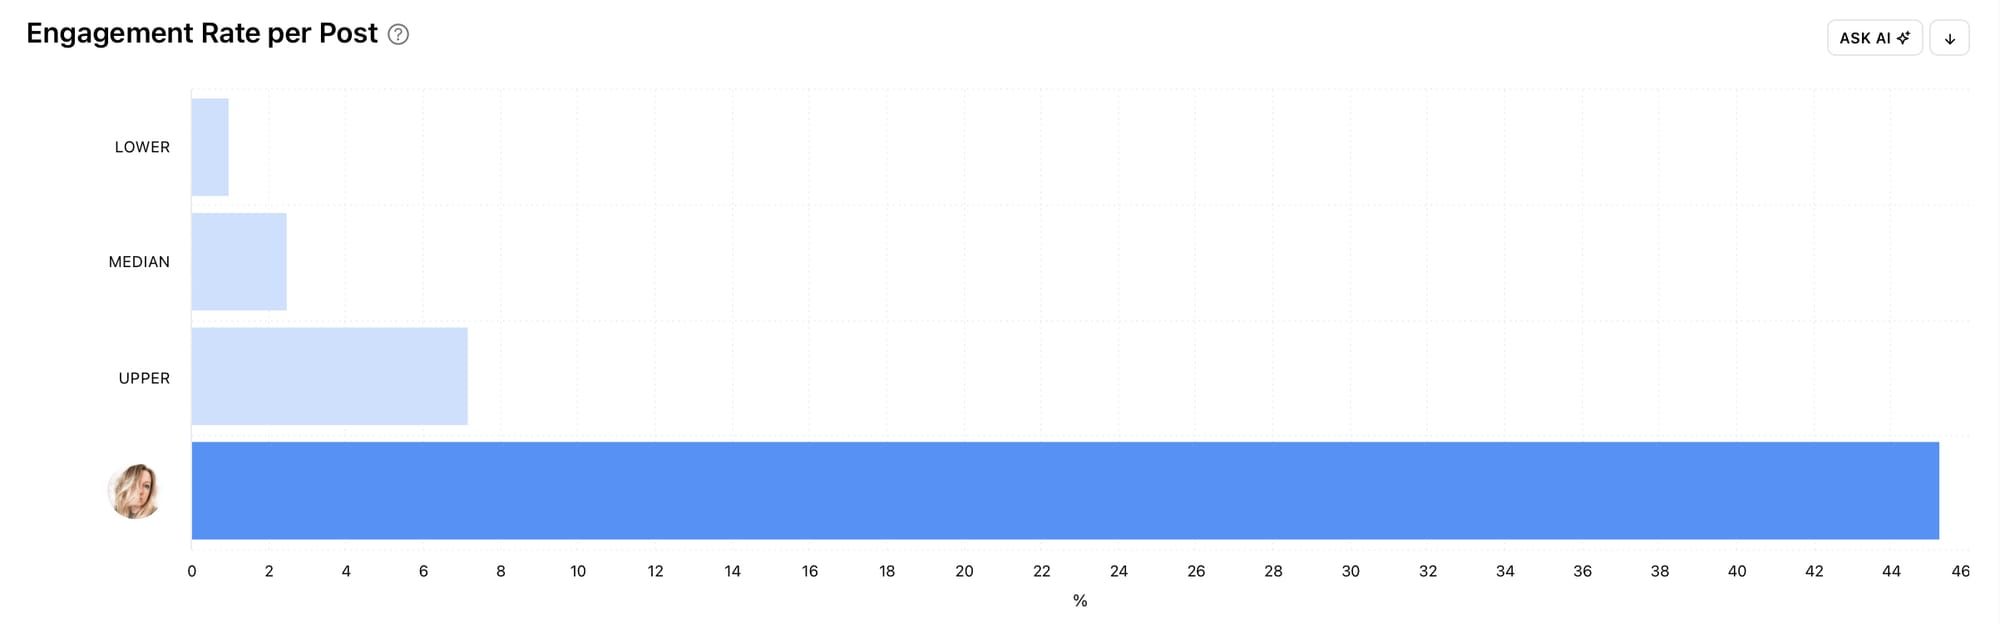
Benchmarks Engagement Rate per Post
The Benchmarks Engagement Rate per Post graph shows the average engagement rate per post compared with other Instagram accounts in its cohort. Use this graph to compare your post engagement rate with accounts of a similar size.
Engagement rate graphs are vital to track for any business that is serious about growing a thriving brand using social media. Unlock your engagement rate graphs at Minter.io and discover the analytics you’ve been missing.