How to consistently gain followers on Instagram using Minter.io
We all want more followers on Instagram and with additional data at your fingertips, consistent follower growth is no longer out of reach. With Minter.io - the social media analytics tool every business should use to build an online presence - you can track the right graphs to steadily and sustainably grow your brand on Instagram. In this article, we’ll show you the best graphs to track for consistent follower growth and give you key information to help you understand each graph fully, so you can apply the tips to your unique brand.
You’re only 6 steps away from success…
Step 1: Check your current follower growth
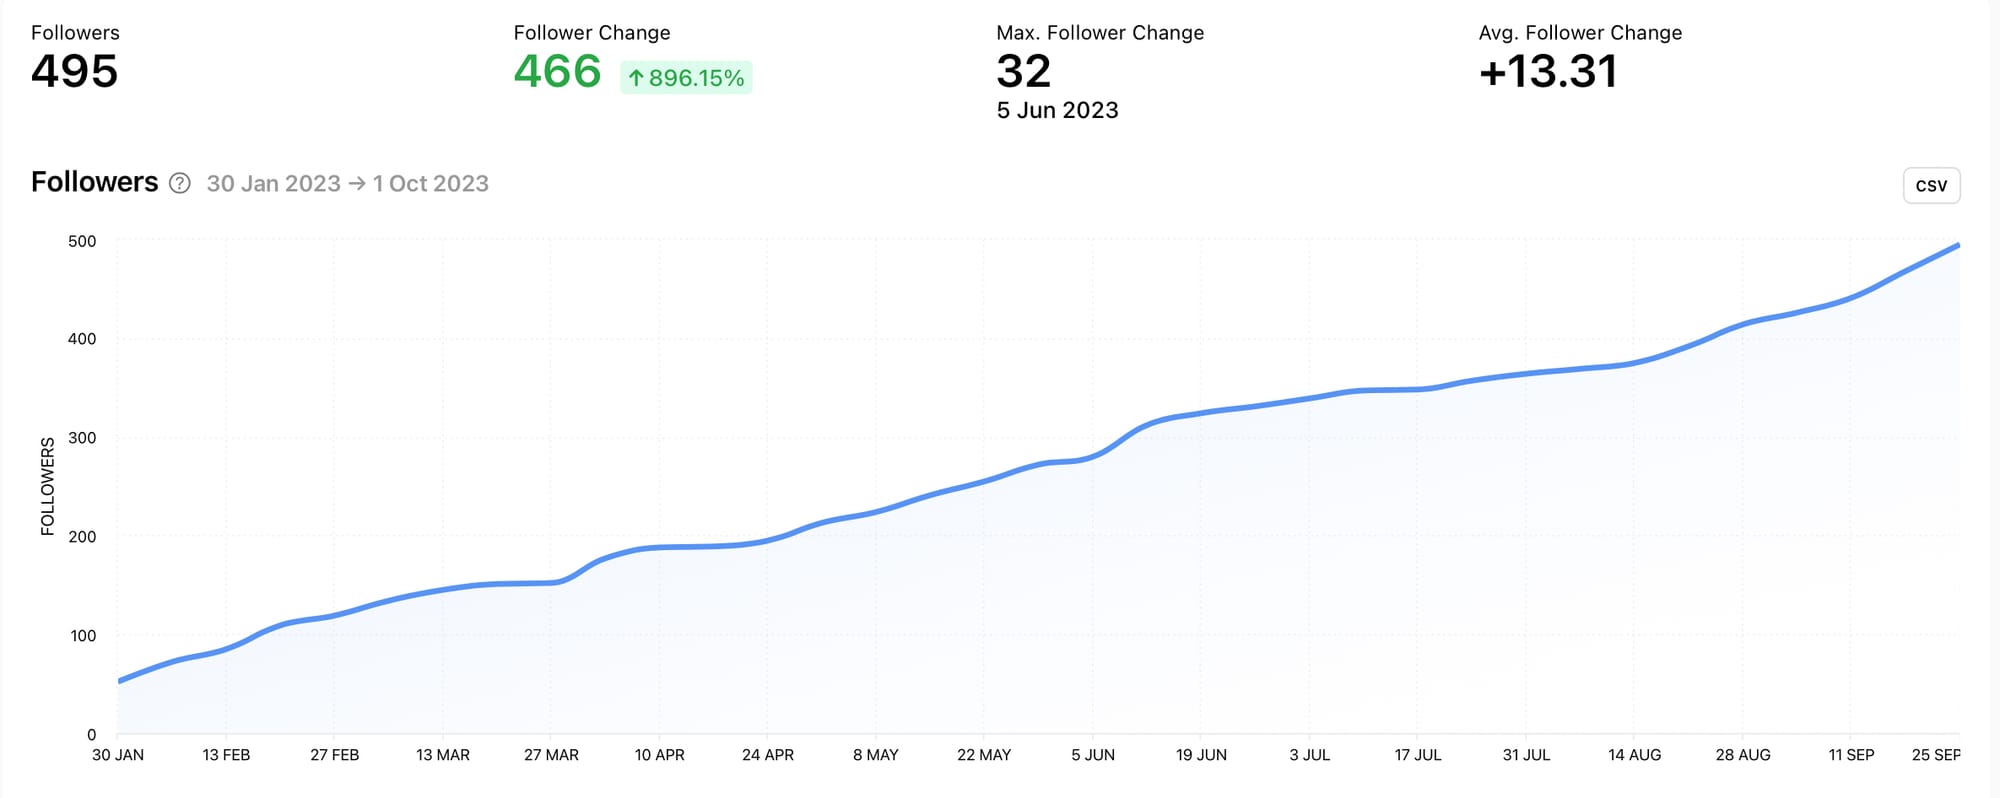
The first graph to look at is the Followers graph, which is located in the Audience section of your Instagram metrics on Minter.io. This will give you an idea of how steadily your following is growing or declining. A profile with consistent follower growth will have a graph that looks like the one below, with a steady gain in followers over time.
Look at your Followers graph and ask yourself:
- Is my following increasing or declining?
- Is growth sporadic or steady?
- Are there spikes or dips in the graph and what actions could have caused them?
It doesn’t matter where you start - what’s important is that you know what’s currently happening with your Instagram following by observing accurate, up-to-date data. Without looking at this graph, your idea of your follower growth may be very different from the reality. By getting very clear about the rate at which your following is growing or declining, you can take decisive action to effectively increase your following in a realistic and consistent way.
Step 2: Focus on your current following
The next step is to look after the audience that has already signed up for your content. It can be easy to get fixated on growing a metric or number, but behind every number in your follower count is a person who has chosen to hit the follow button. It’s time to cherish those people who have already voted to be in your audience. Get to know who they are, what they enjoy and what is likely to keep them around. If your following is in decline, this should help to curb that trend and give you a solid foundation to build upon.
In the Audience section of your Minter.io Instagram data, look at the following graphs:
- Gender of Followers
- Age of Followers
- Countries of Followers
- Cities of Followers
- Language of Followers
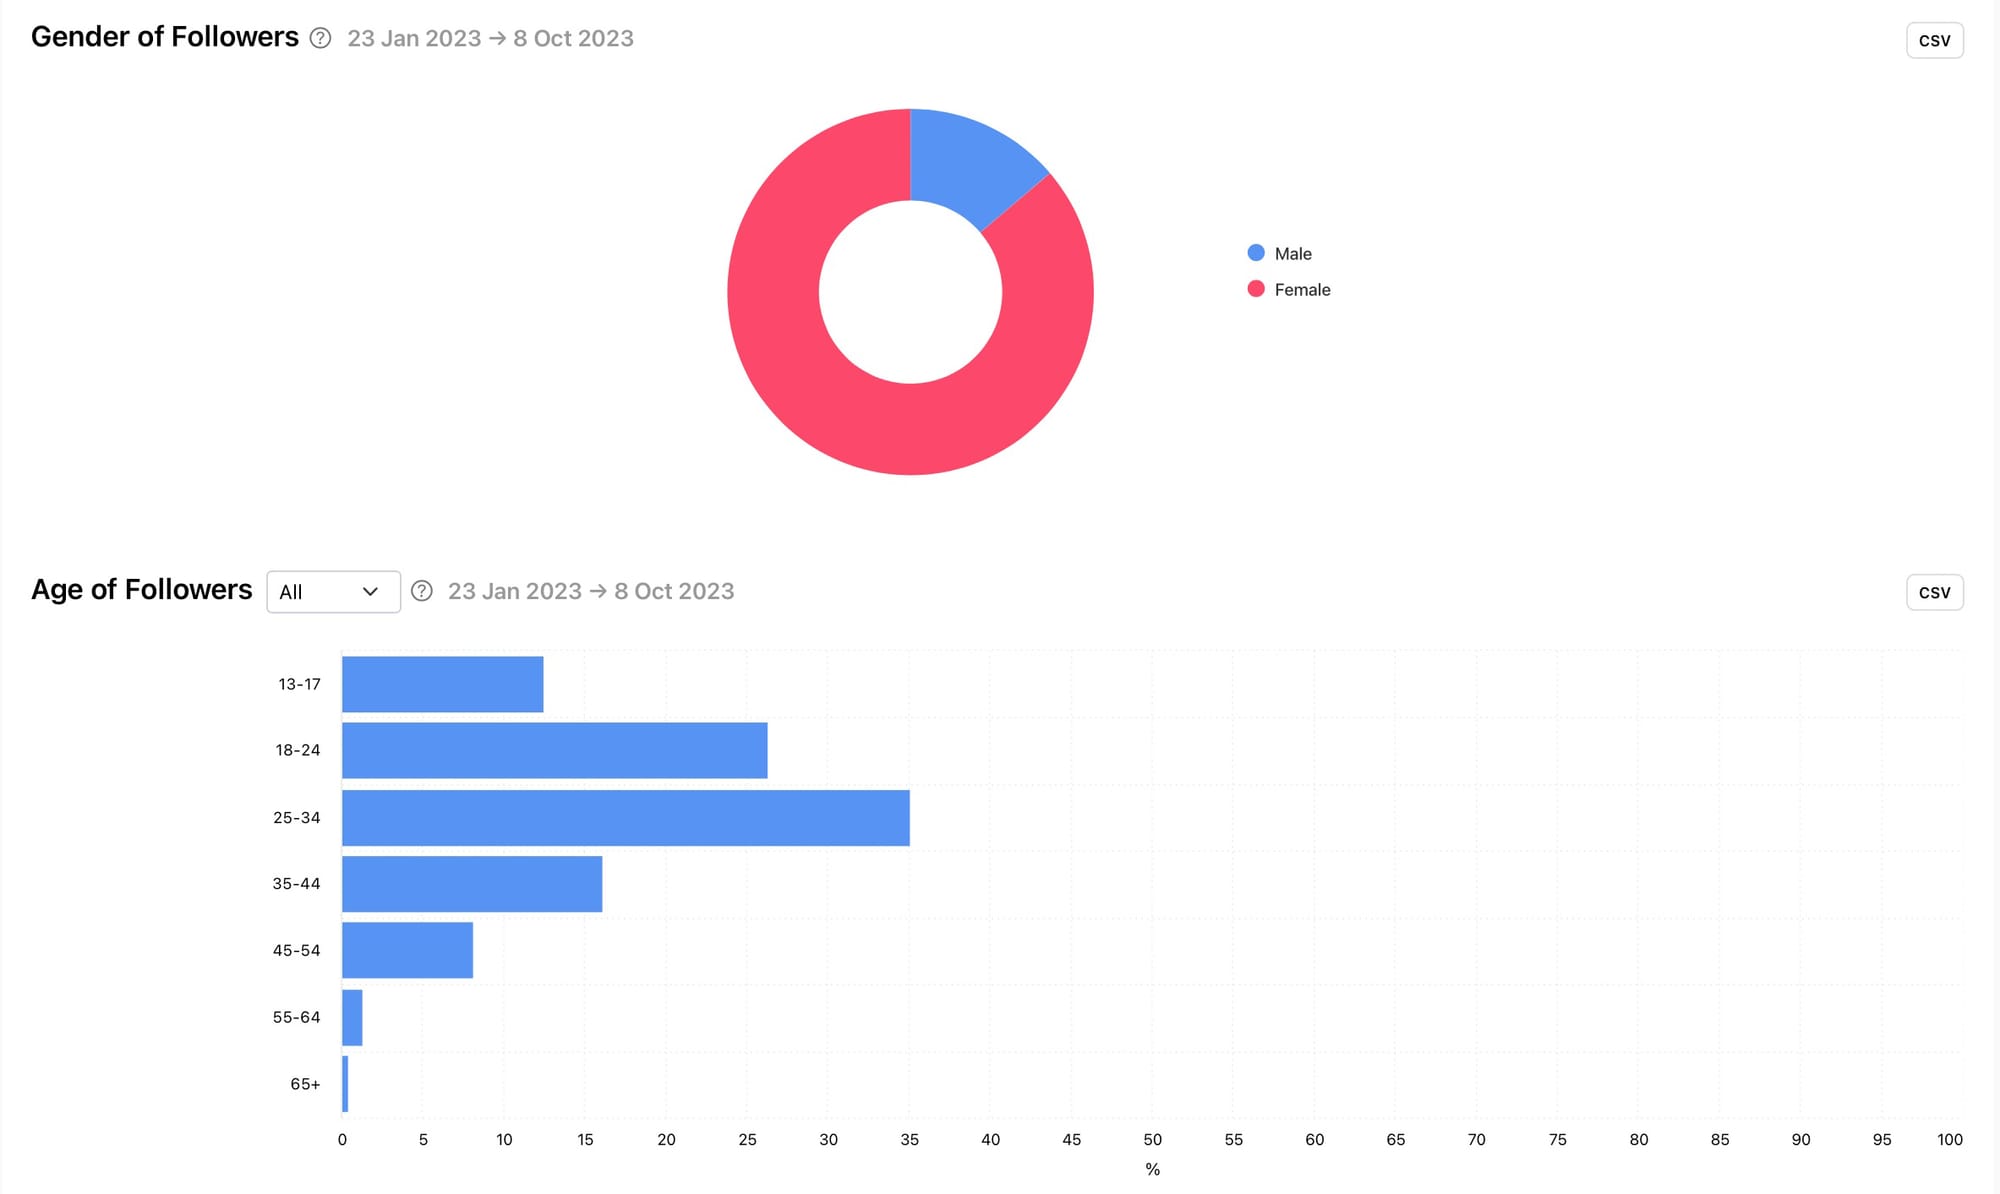
Your audience data should heavily influence the content you create. It is in knowing your audience that you can connect with them in a relevant way. Furthermore, by focusing on your current audience you are likely to attract even more people who are similar to your current audience, as the content will be relevant to similar audiences as well.
Once you have an idea of the kinds of people you are catering to, be sure to optimise your content based on what is working for your current audience. Head to the Optimization section of your Minter.io Instagram data to find graphs that could enhance your efforts. Below is the Best Time to post graph, which shows the number of interactions on posts published at different times and on different days of the week.
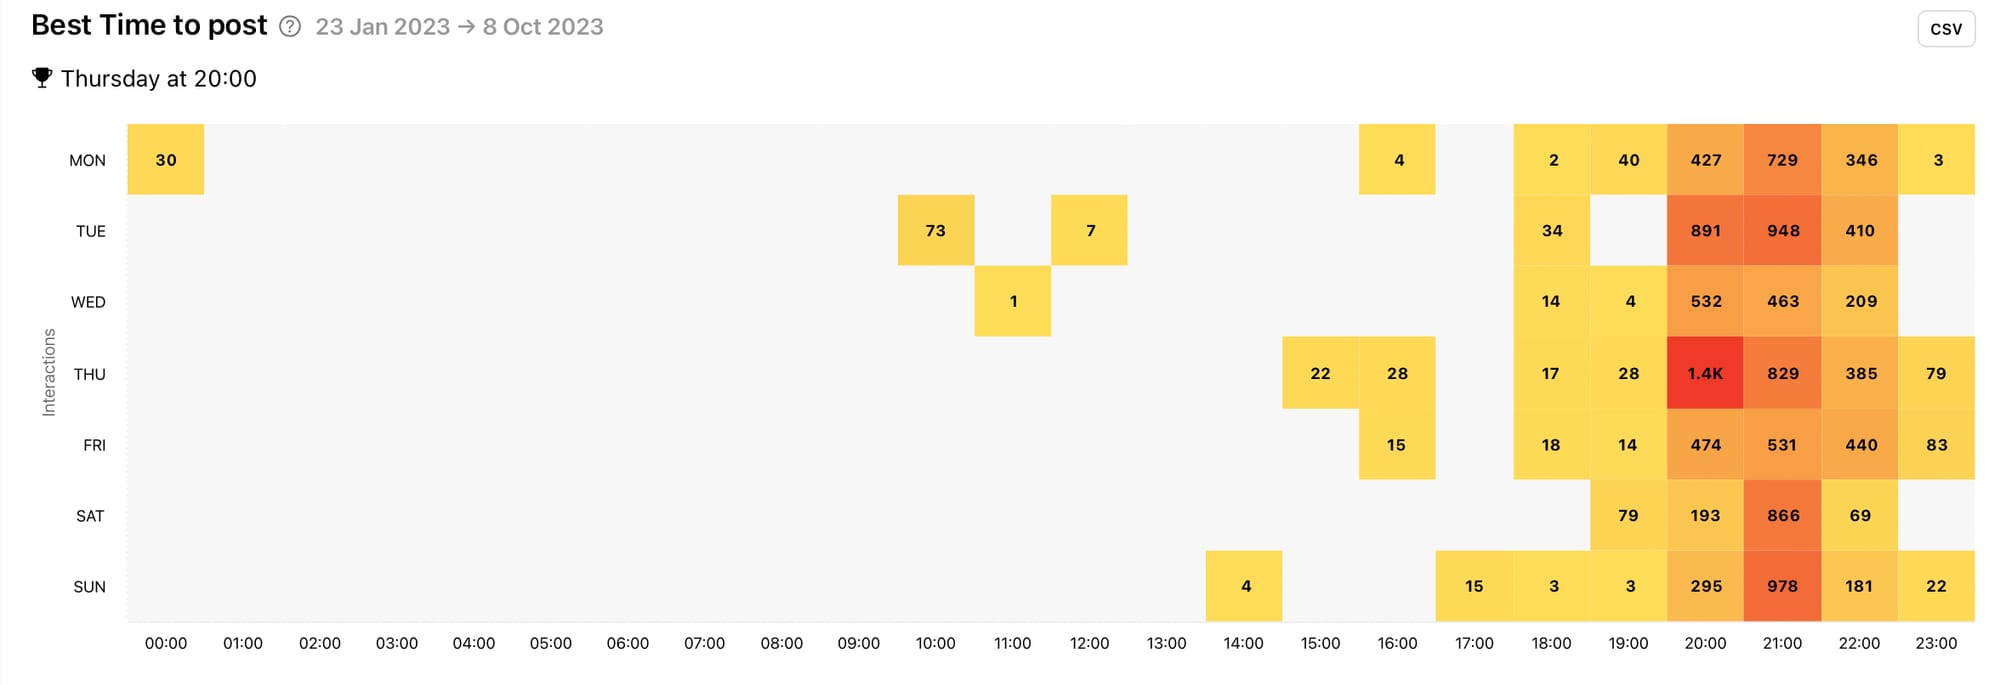
Optimising for your current Instagram audience makes the experience better for your current following, but it can also get the algorithm working in your favour. The more interaction a post gets soon after publishing, the more likely it is that the Instagram algorithm will push the content to more people. Use this to your advantage when looking to grow your following.
Step 3: Publish posts consistently
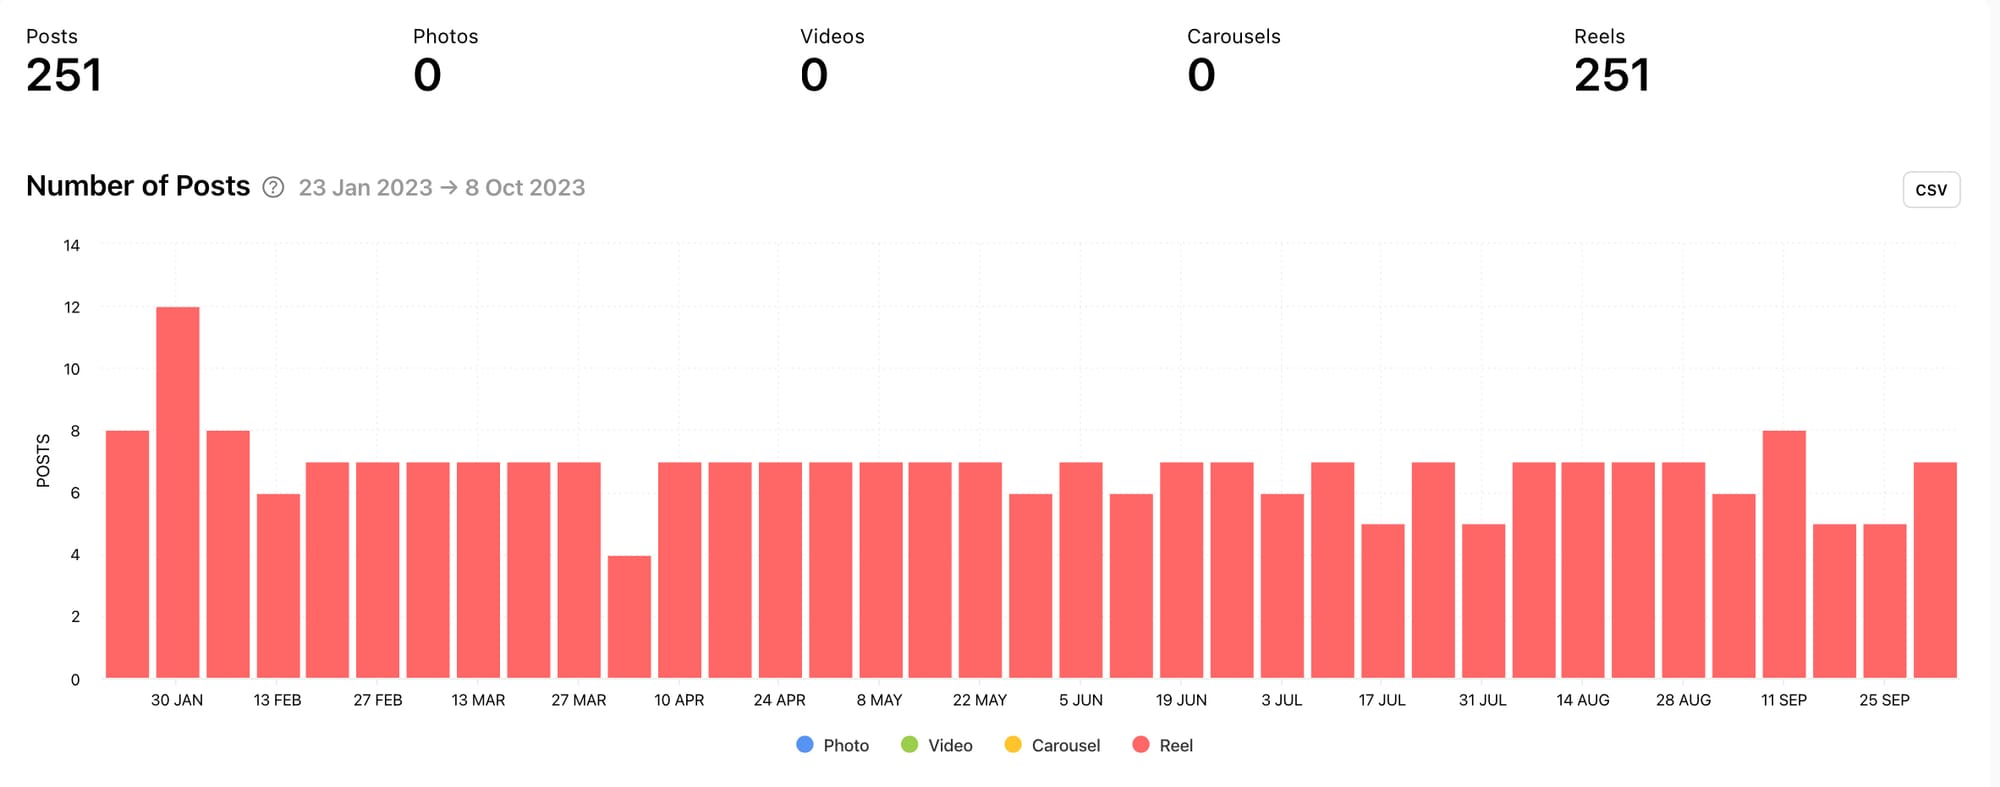
Are you posting content consistently on your Instagram profile? If not, is it really reasonable to expect people to stick around? You have to give people a reason to follow your Instagram profile and to stay for the ride. If your publishing schedule is drier than the Sahara desert, it’s likely your following will dry up too. Start by looking at the Number of Posts graph in the Posts section of your Minter.io account, as the posts on your profile make up the content that a new viewer will see first when checking out your profile. A profile that publishes content regularly may have a graph that looks similar to the one below, although it may be made up of different or multiple post types.
Look at your Number of Posts graph and ask yourself:
- Do I publish content regularly or sporadically?
- Are there spikes or dips in the data and what caused these?
- Is there anything preventing me from publishing regular content and how could I overcome that?
One of the best ways to help with regular, consistent content publishing is to plan and stick to a content schedule. Content can be made in advance and scheduled directly in-app on Instagram, ready to be published at the perfect time for your audience. You can always add in additional content if anything pops up, if you fancy joining a trend or if you get a great idea on the fly. But by having a plan in advance and getting content prepared early, you’ll never be left scratching your head wondering what you can upload in the middle of an inspiration drought.
Step 4: Take note of positive interaction
You’ve got to know your audience and you’re confidently publishing regular content. It’s time to determine whether your audience is connecting with your content in a positive way. Positive engagement gives pointers as to the kinds of content that keeps people following and engaging with your content. When you’re looking to build your following, it’s important to know what people like about the content you create so you can serve up more of it and encourage more people to hop on board.
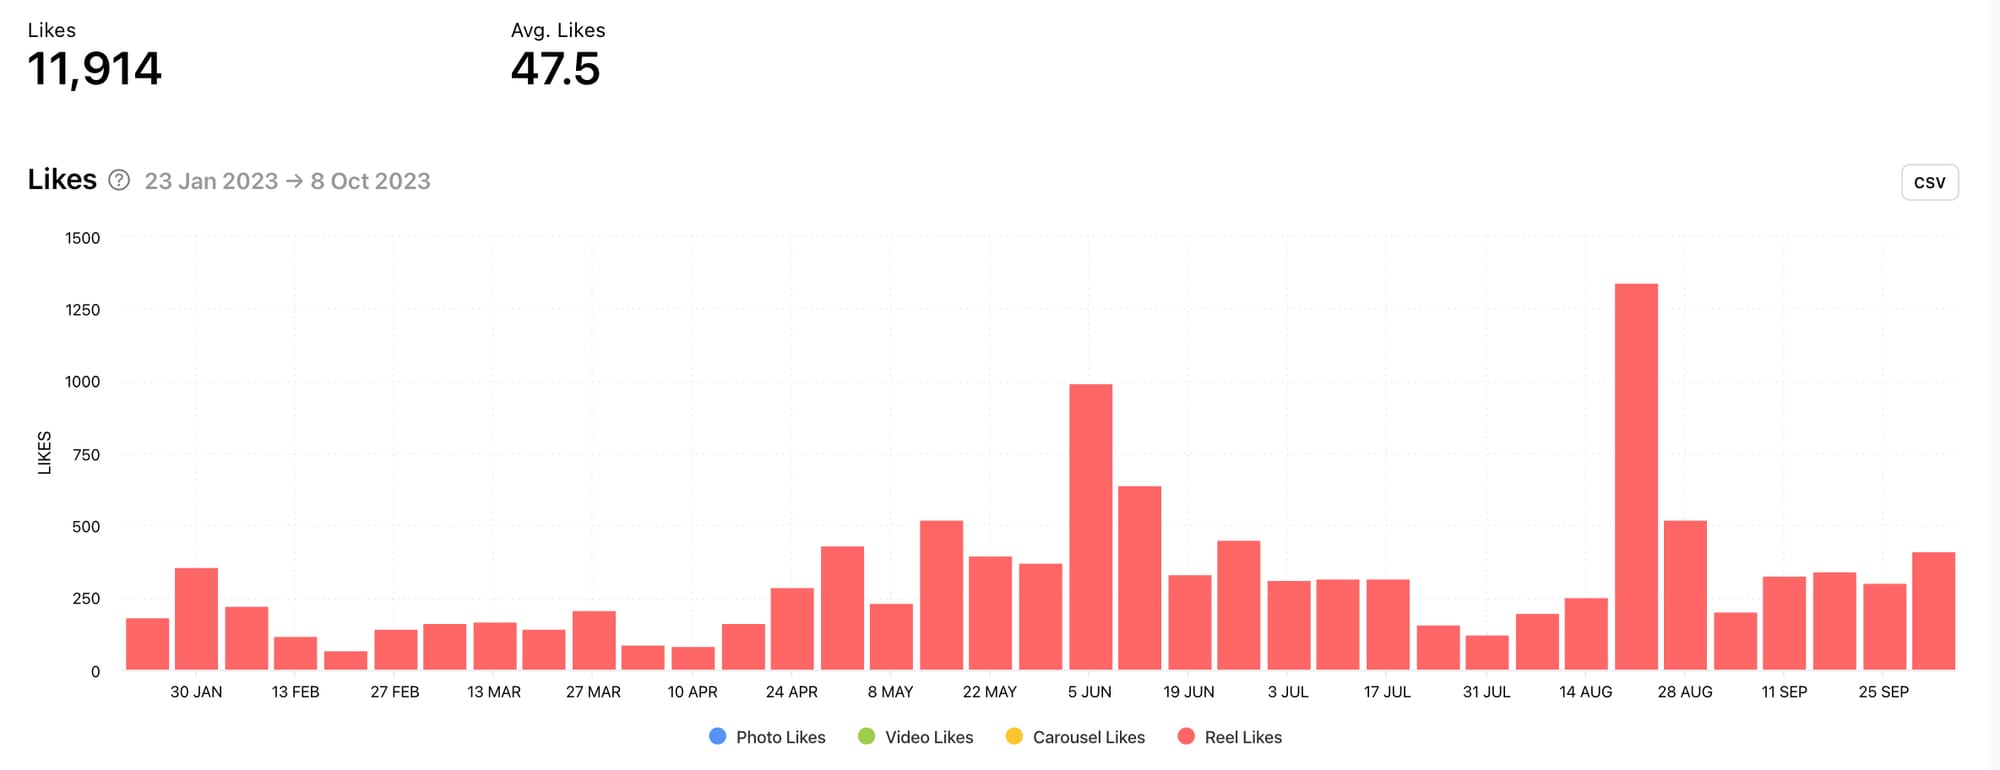
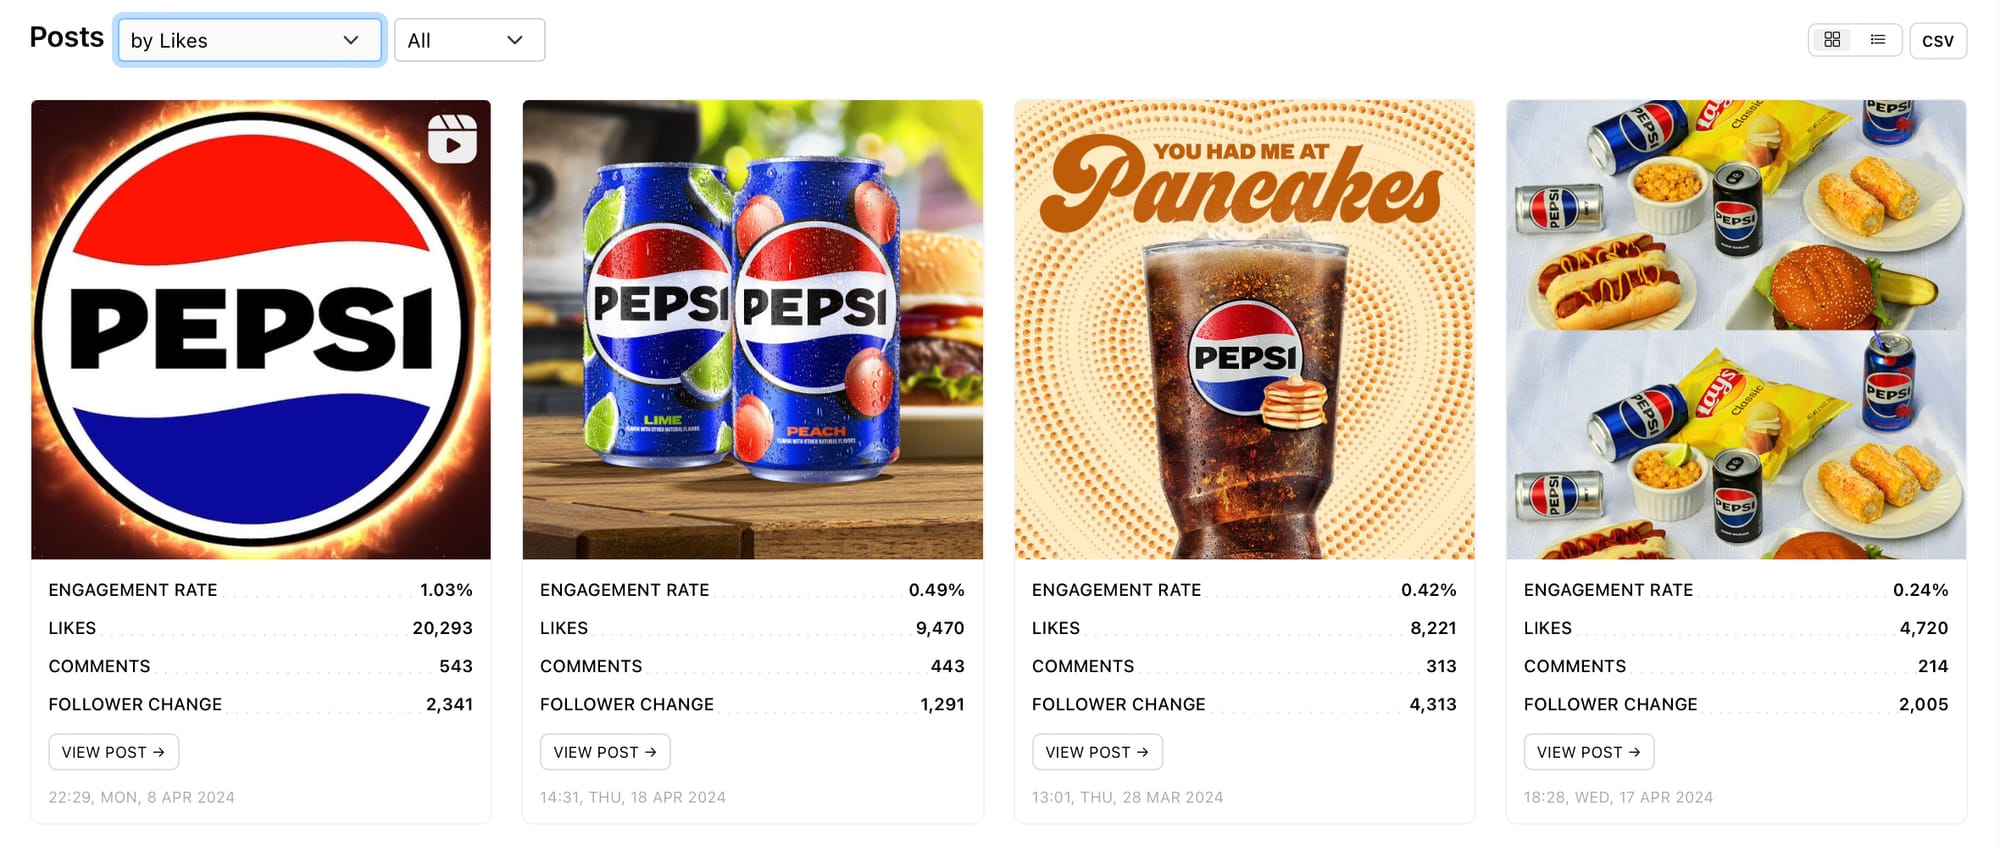
The easiest graph to turn to for positive engagement pointers is the Likes graph in the Posts section of your Minter.io Instagram data. This is because other engagement metrics, such as comments and shares, don’t necessarily equate to positive engagement. People comment on content because it sparks a reaction - positive or negative. By focusing on the Likes graph, you can get a snapshot of positive engagement in an instant.
Look at your Likes graph and ask yourself:
- What days got the highest amount of likes?
- What caused spikes in likes e.g. was more content posted that day or did one piece of content perform particularly well?
- What content was posted on the days with the highest amount of likes and how did this content differ from other content?
- How can I replicate content with high like counts to produce similar positive results?
Notice days when the number of likes spiked and check out the content you published on these days. Replicate and repeat similar content ideas for a happy and flourishing audience.
You can also scroll to the bottom of the Posts section of your Minter.io Instagram data and view your content in the selected date range by the number of likes. This is a fast way to find your content with the highest number of likes, making it easy to replicate the kinds of content your audience positively engaged with.
Step 5: Learn from actions that gained or lost you followers
The Gained and Lost Followers graph by Minter.io can show you exactly when your Instagram profile got an increase in new followers as well as spikes in audience members unfollowing your Instagram profile. The blue bars show followers gained while the pink bars show followers lost. This is one of the key graphs to study when looking to grow your following as it can give you clues as to the actions you’ve taken that may have influenced positive and negative change.
Use this graph in conjunction with the Followers graph (the first graph we looked at) to note the general trend and keep the data in perspective. It’s not unusual to lose some followers along the way - sometimes due to account deletions/deactivations among other various reasons. What is important to note with this graph is major spikes and anomalies that should be looked into further.
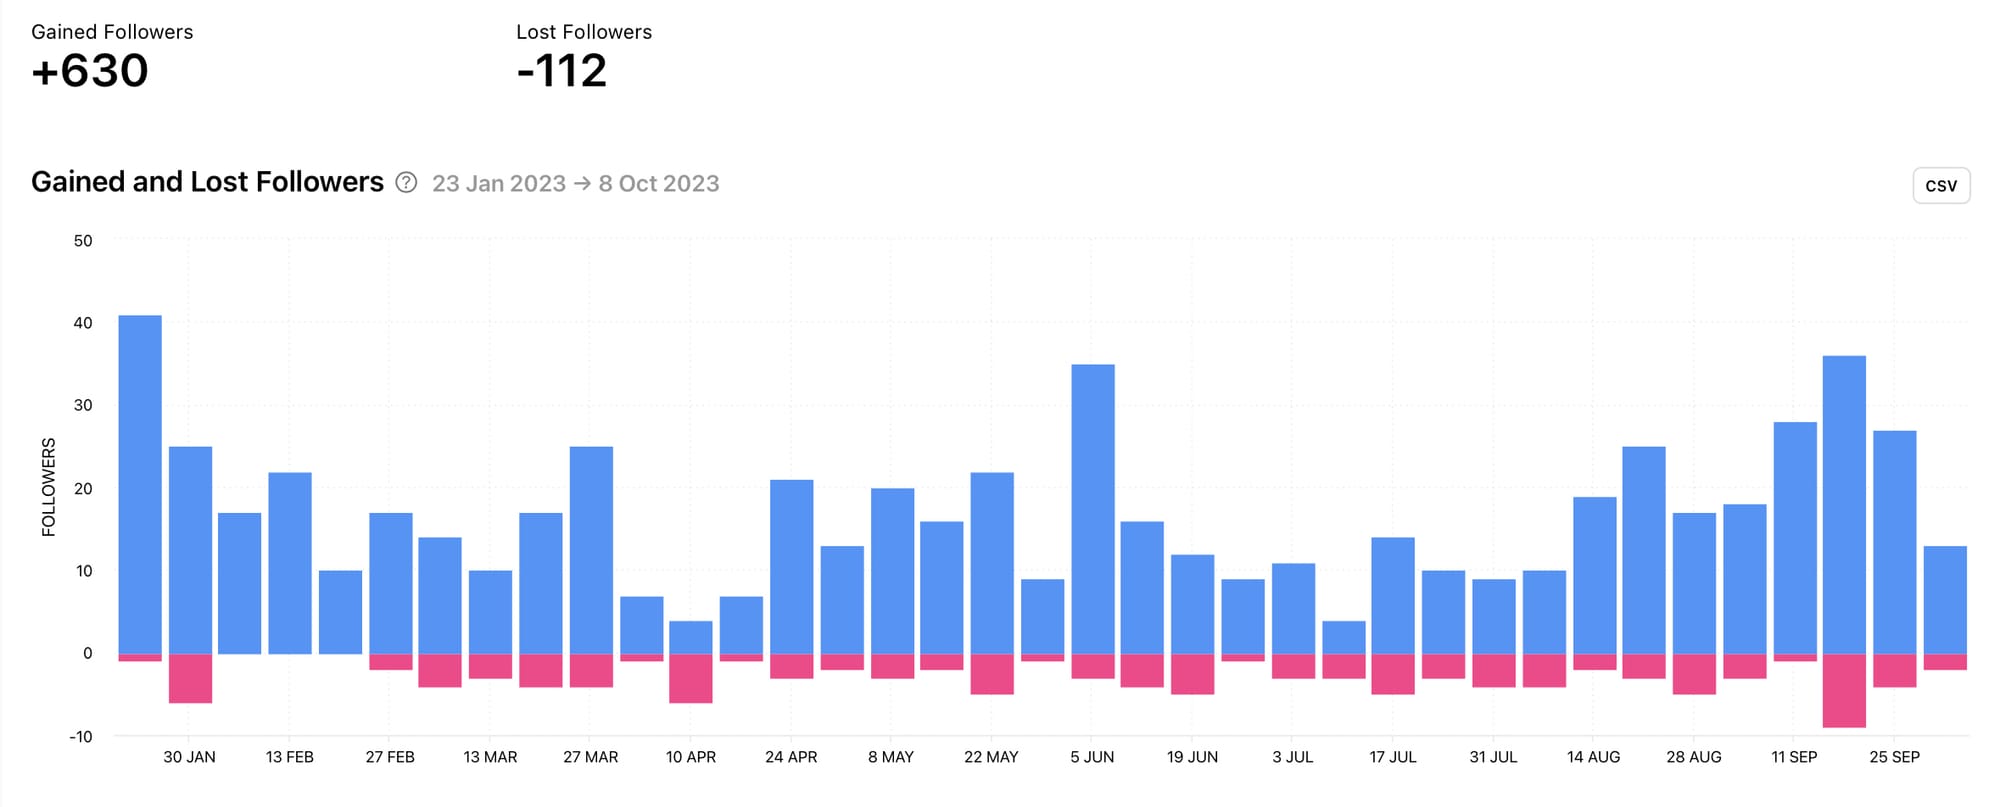
Look at your Gained and Lost Followers graph and ask yourself:
- On which days were there spikes in followers gained?
- On which days were there spikes in followers lost?
- Was content published on those specific days? Could that have influenced a spike in follower change?
- Was my Instagram profile tagged in a review or mentioned by another profile and could this have influenced a surge in new followers or a loss of followers?
- Was something happening outside of social media (e.g. a news article publication or an event) that could have influenced this data?
By looking at actions that took place on specific days that spiked follower growth or decline, you can get an idea of what to replicate, remove or respond to in the future. Sometimes this will be directly linked to the content you publish; other times it could be related to something outside of your control.
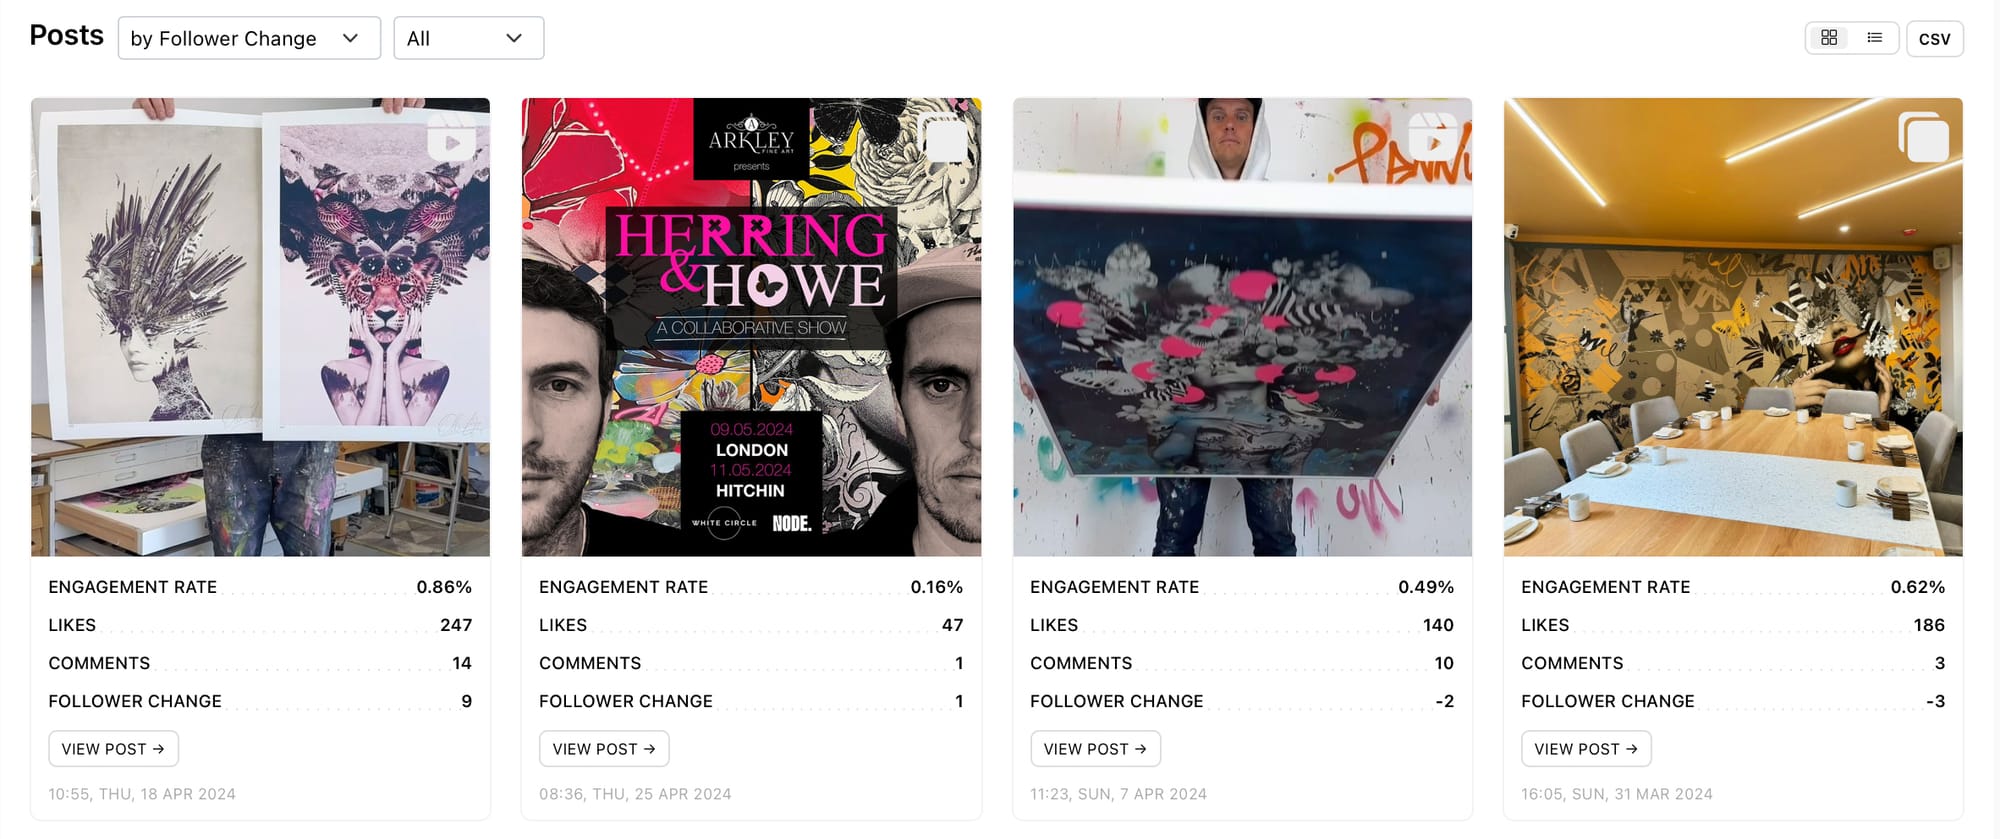
You can view your Posts by Follower Change at the bottom of the Posts section of your Minter.io Instagram data. This can help you replicate content that boosted your following while swerving away from replicating content that contributed to a large loss in followers.
Step 6: Boost your reach
The last key metric that will support your follower growth is reach. If you aren’t getting in front of new eyeballs, how can you expect your following to grow? Reach tracks the number of times your posts were viewed by unique accounts within the selected date range. With Minter.io, you can view data on the reach of your posts, stories, profile and ads.
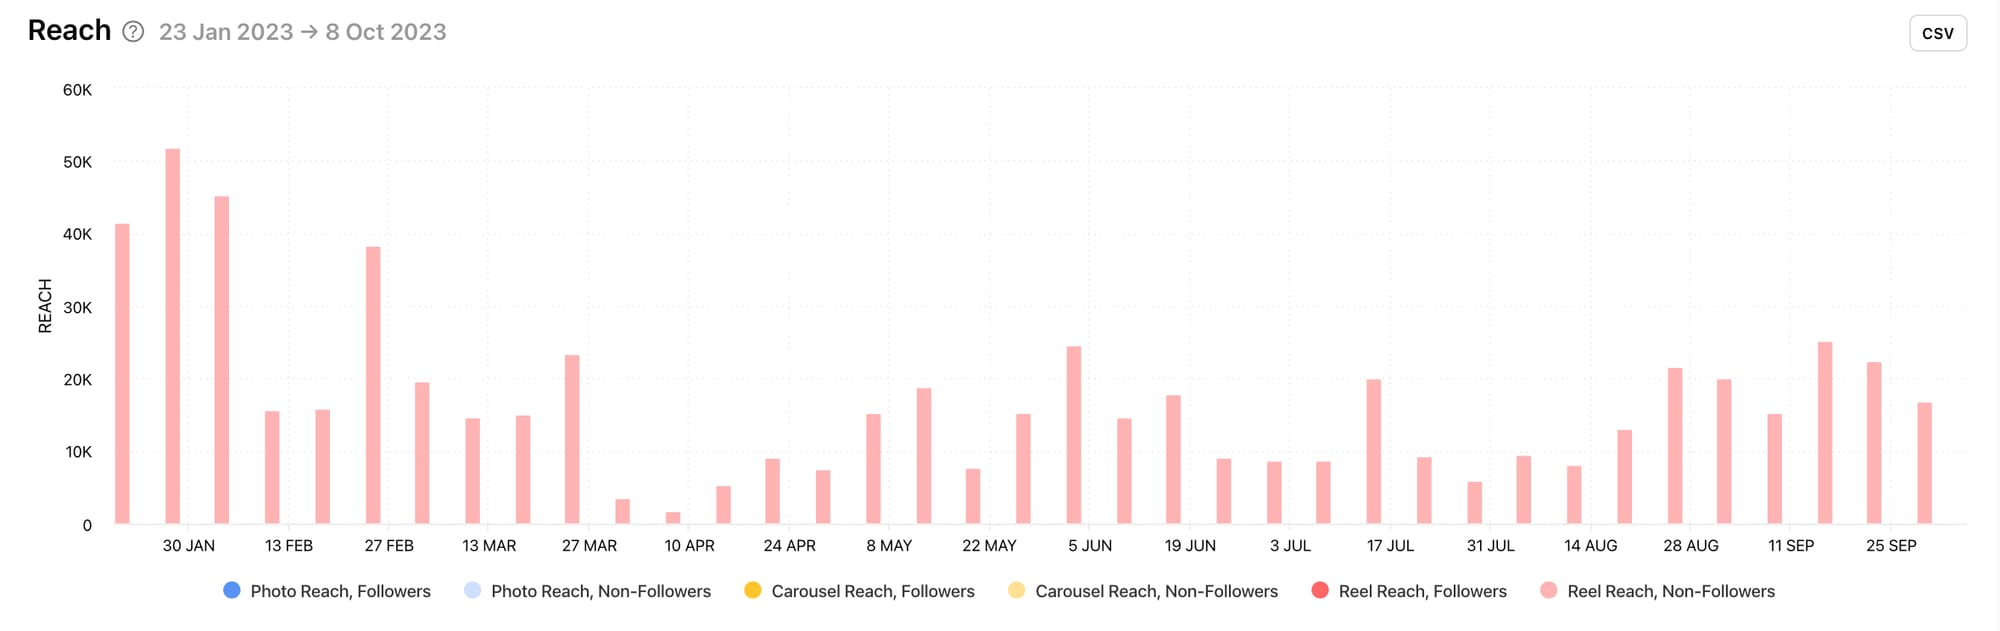
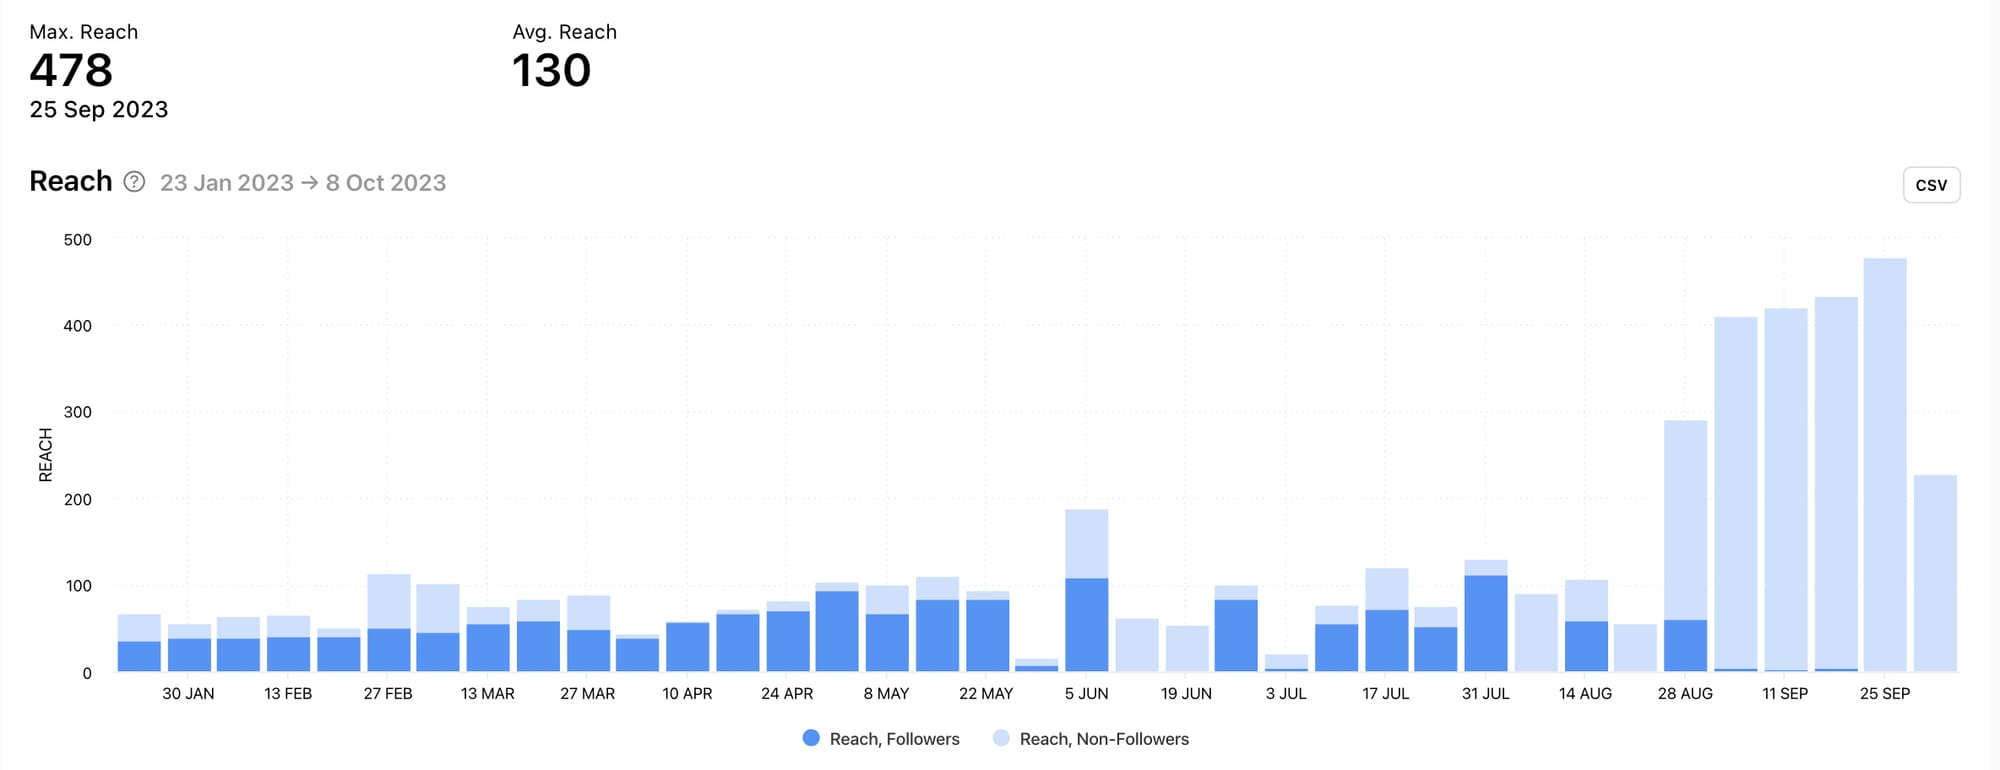
Post Reach (left) and Stories Reach (right) graphs by Minter.io
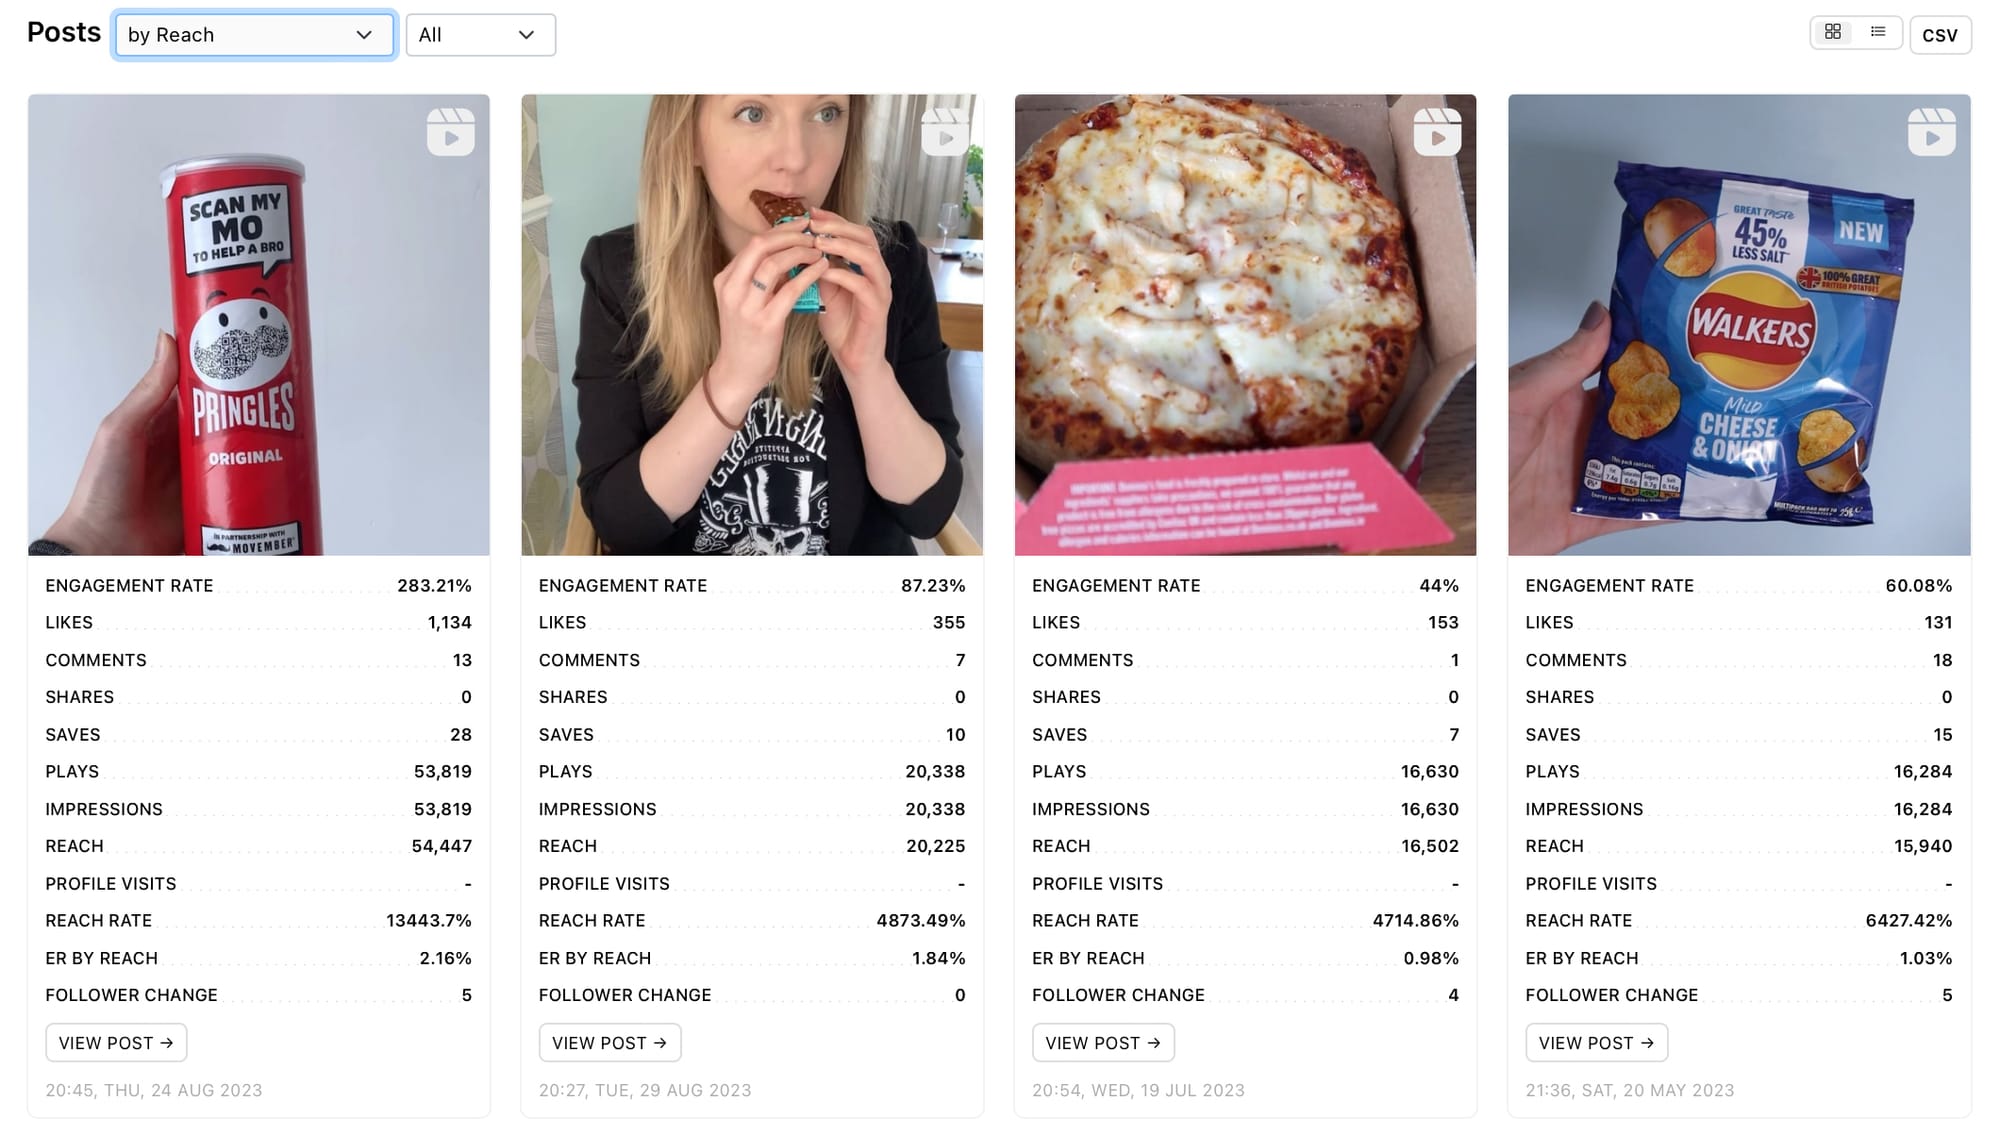
Similarly to the previous steps, an important part of navigating these graphs is to identify spikes in the desired metric and replicate the actions that may have triggered the positive increase within the data. You can sort your posts, stories and ads by reach in the associated section of your Minter.io Instagram data to help you find your content with the highest reach counts quickly.
When looking to replicate posts with the highest reach counts, ask yourself:
- What content types gained the highest amounts of reach on my profile?
- What hashtags were used in post descriptions?
- What stickers were used in Stories posts?
- Did posts also get additional engagement such as increased shares and comments?
- Did additional ad spend result in a higher reach count?
- Did I add locations to the posts?
- Did I tag in other accounts?
- What themes resulted in the highest reach counts?
- Did I use any different stylisation techniques such as specific colour combinations, cover photos, voiceovers and text overlays?
- Was I joining in with trending content?
By pinpointing the connectivity tools, post types and creative structures in the posts with the highest reach counts, you can confidently leverage these elements for boosted reach in upcoming content. Higher reach means more people seeing your content. This grants the opportunity for your profile to be discovered by new people and puts you in a good position to grow your following.
Followers are more than just a vanity metric - they are the people that make up your community on Instagram. With a strong community, you can leverage your audience for business success. Make sure you have all the metrics you need at your fingertips with Minter.io - the social media analytics tool every business needs at their side. Try it free today to unlock access to all the graphs in this article.
Start using Minter.io now!→