
How to compare your social media performance across different date ranges
Comparing the performance of your social media metrics from different time periods is one of the best ways to measure the effectiveness of your social media marketing strategies, but it is almost impossible to do on many social media apps using their native insights. With no direct way to compare different date ranges from most of the top social media apps, users are forced to export data manually (which is often complicated and difficult to do) or use a third-party tool. Luckily with new additions to Minter.io, such as the comparison feature added to the date picker and AI Analyst, our artificial intelligence companion, comparing the performance of your social media accounts and content across different date ranges has never been easier.
Let’s explore the different ways you can compare data from different date ranges with Minter.io…
Compare social media data with the date picker
The fully flexible Minter.io date picker has recently been upgraded to allow you to compare data from two different date ranges. With this new feature, you can view and compare data from two different time periods side by side in your analytics graphs. Choose a set time frame (such as previous period or previous year) or go with a custom date range for full flexibility.
Here’s how to use it:
- Select the date picker in the top right-hand corner of your social media data on Minter.io.
- Toggle the 'Compare' button to turn it on.
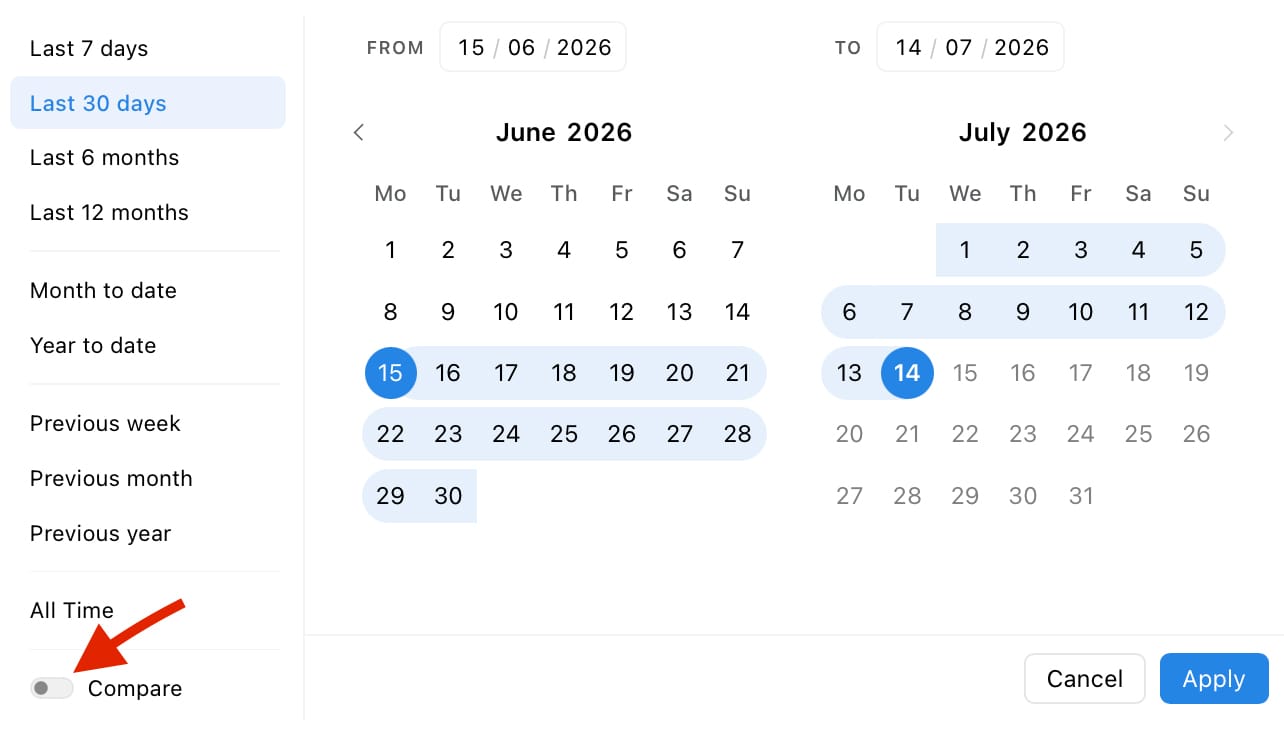
- Choose a time frame under the 'Compare' button or select ‘Custom’ to input any date range.
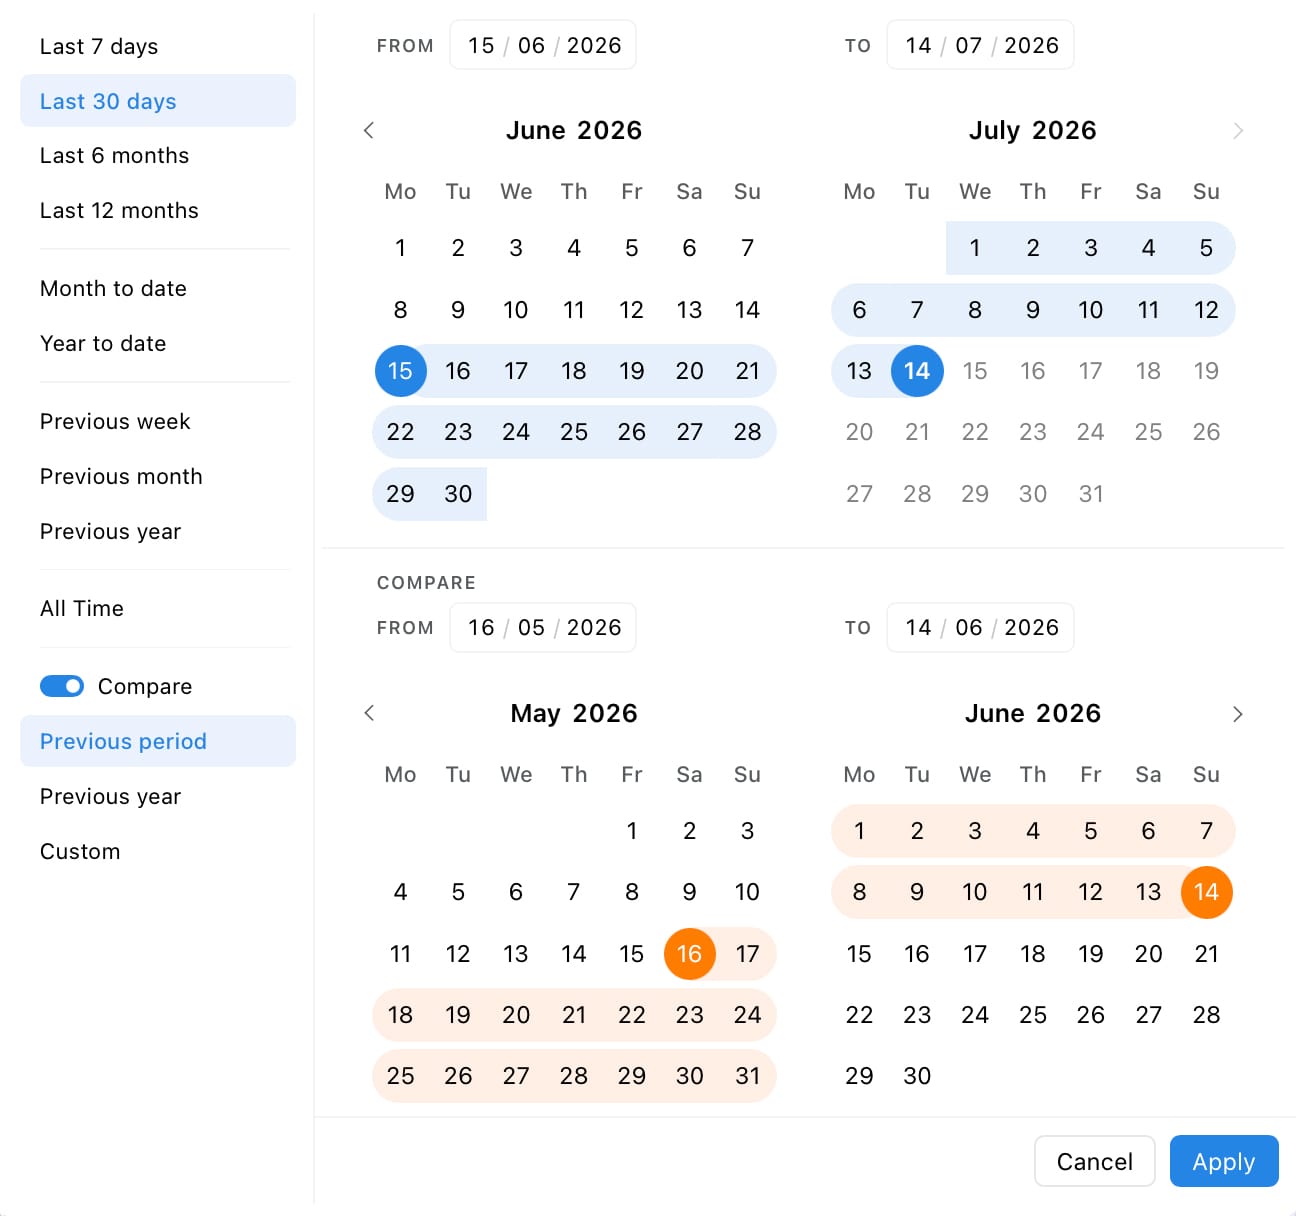
The analytics graphs will now show the performance of both time periods simultaneously. The grey lines and bars represent the earliest time period, whereas the coloured bars show the most recent dates selected.
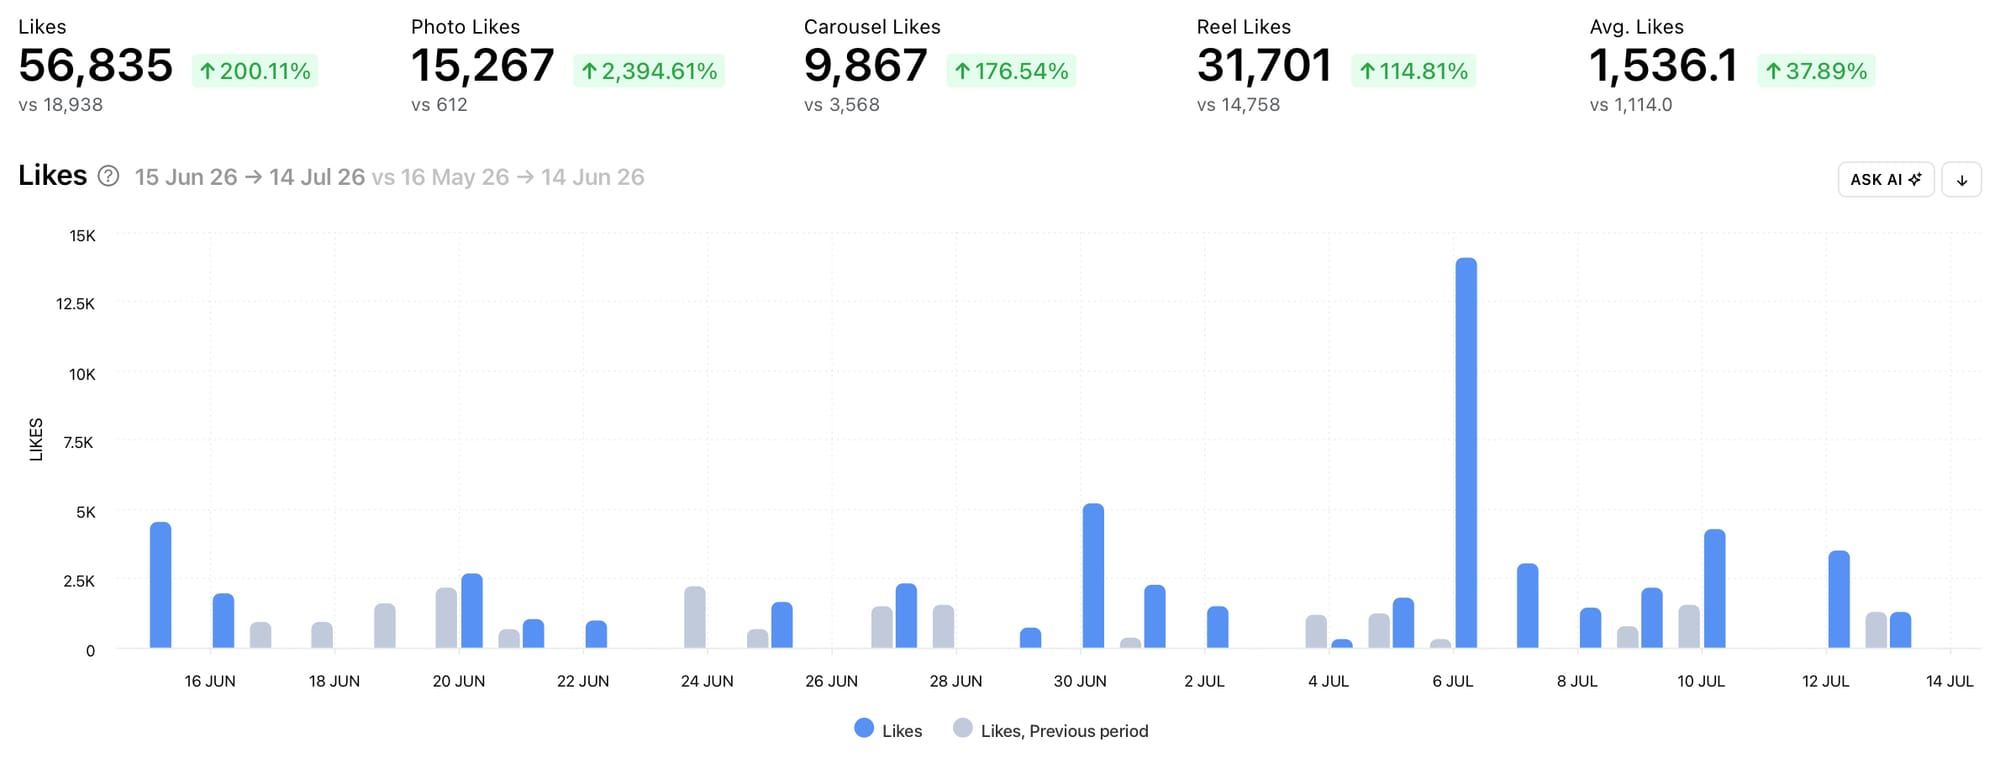
Use the date picker to view graphs with data from two date ranges at the same time. This can help you understand the performance of your social media content and profile over time, give pointers to the effectiveness of different social media marketing strategies, and provide information about the growth and trajectory of your social media presence.
Consider using the new compare feature on the date picker to compare:
- Different marketing campaigns
- Time periods where you tested different approaches
- Monthly, quarterly or annual performance
- Seasonal changes
- The impact of events against average performance
Export and compare social media data from different date ranges
If you need to work with the raw data, you can export any two date ranges and compare them side by side in a spreadsheet or another reporting tool you usually use. Custom exports are available in any date range and a number of formats, including XLS and CSV, so you can combine Minter.io data with other sources or build a fully custom report. You can even schedule weekly or monthly reports ready for you to compare data weekly or month to month. This provides an ideal way to compare data period over period and create a social media comparison report for your team or clients.
To export data ready to compare its performance with another date range:
- Choose a date range using the date picker.
2. Select the ‘Export’ button to download the data in PDF, XLS or PPTX format. You can also customise the content of your report from the export menu too.
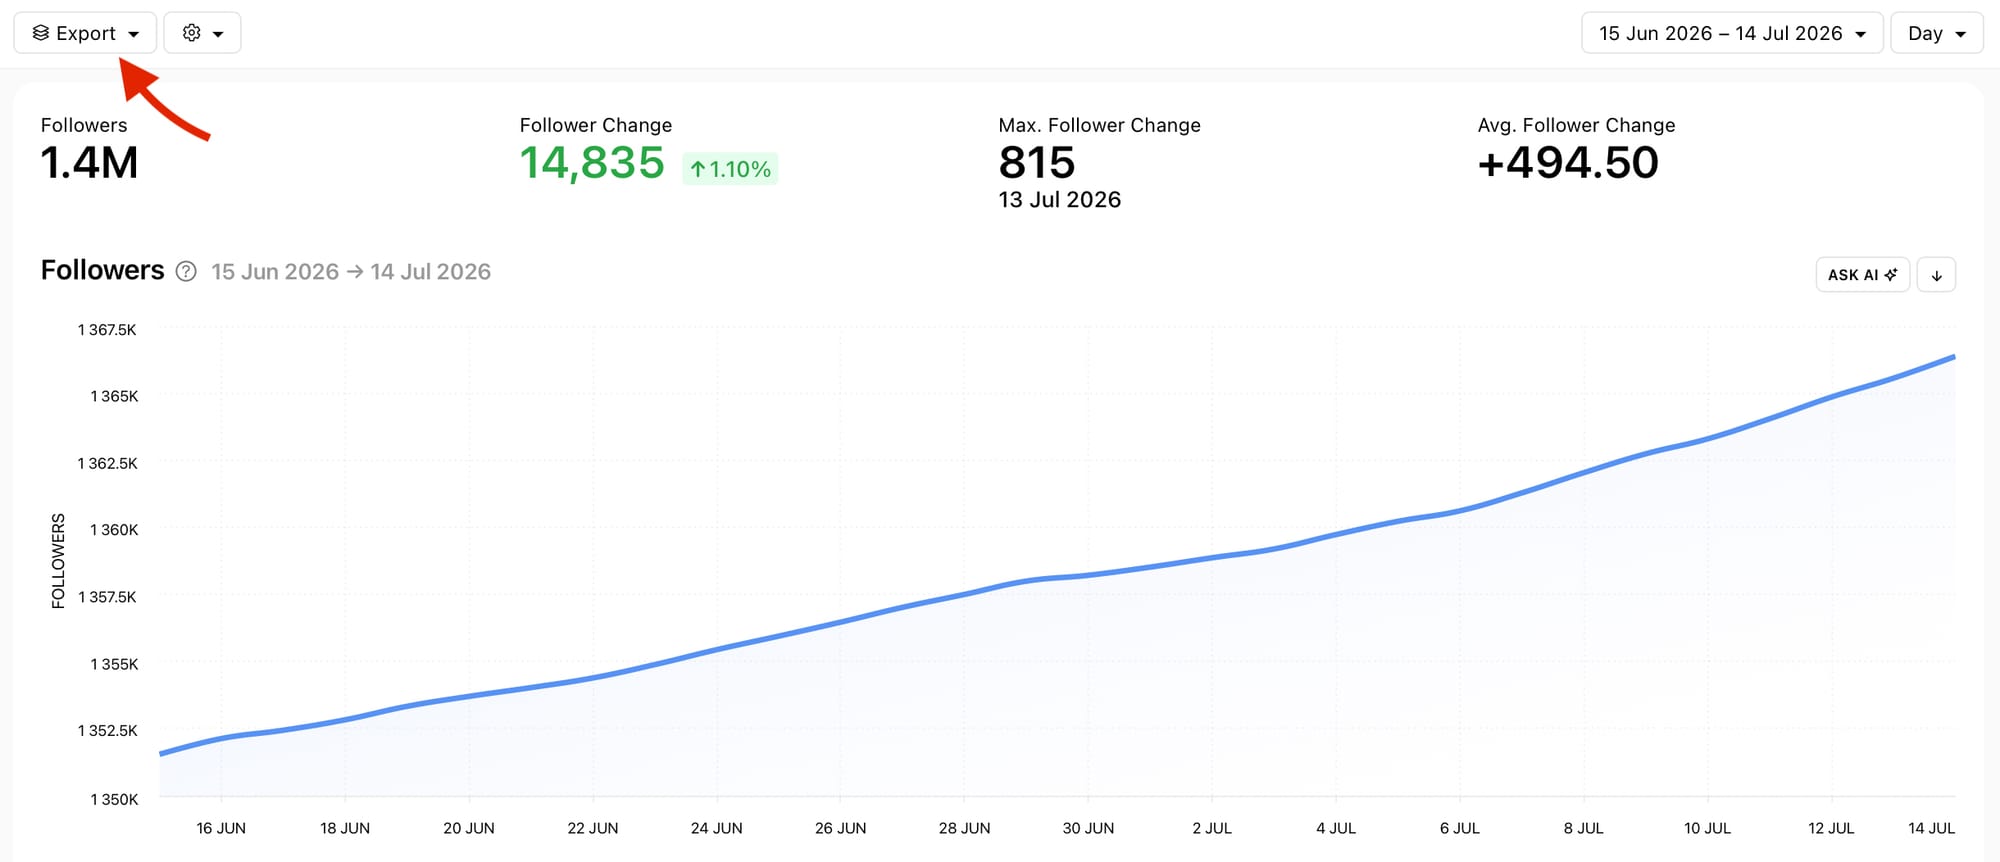
3. Select the download button next to a specific graph to download specific data in CSV or XLS format.
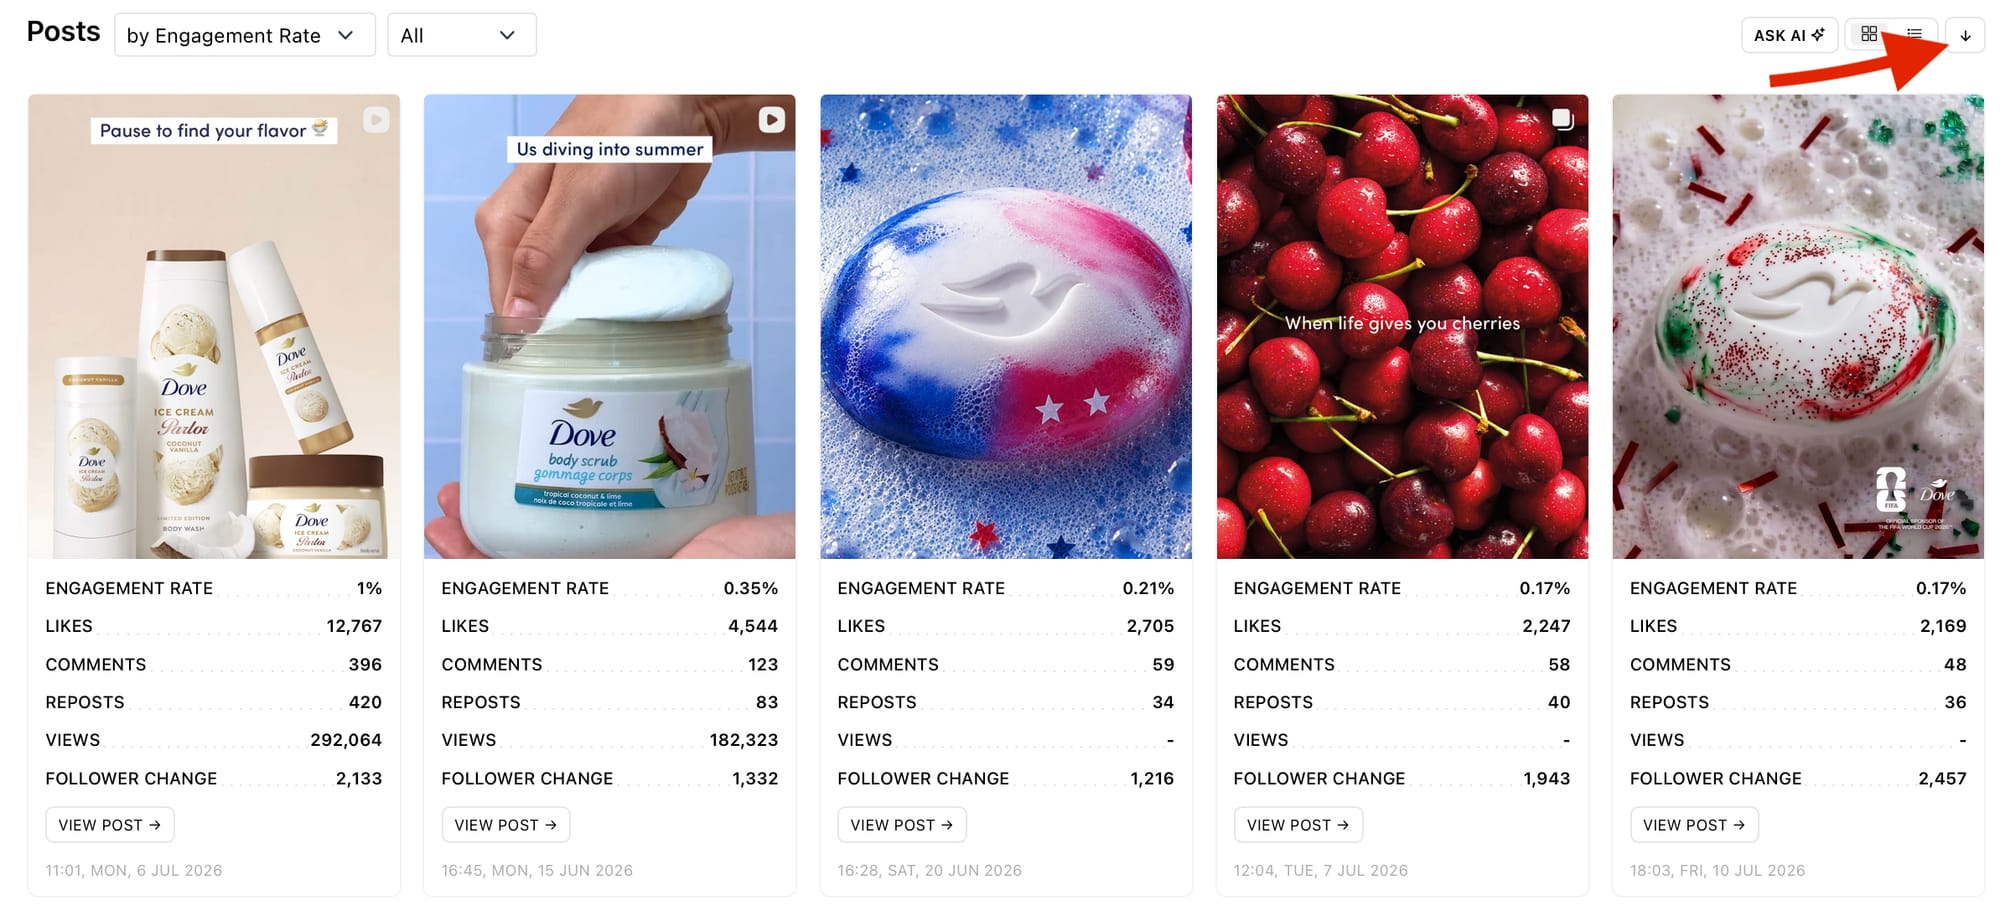
Select another date range using the date picker and export the data as above to get the information you want from a specific date range ready for comparison.
Use the AI Analyst to compare social media data
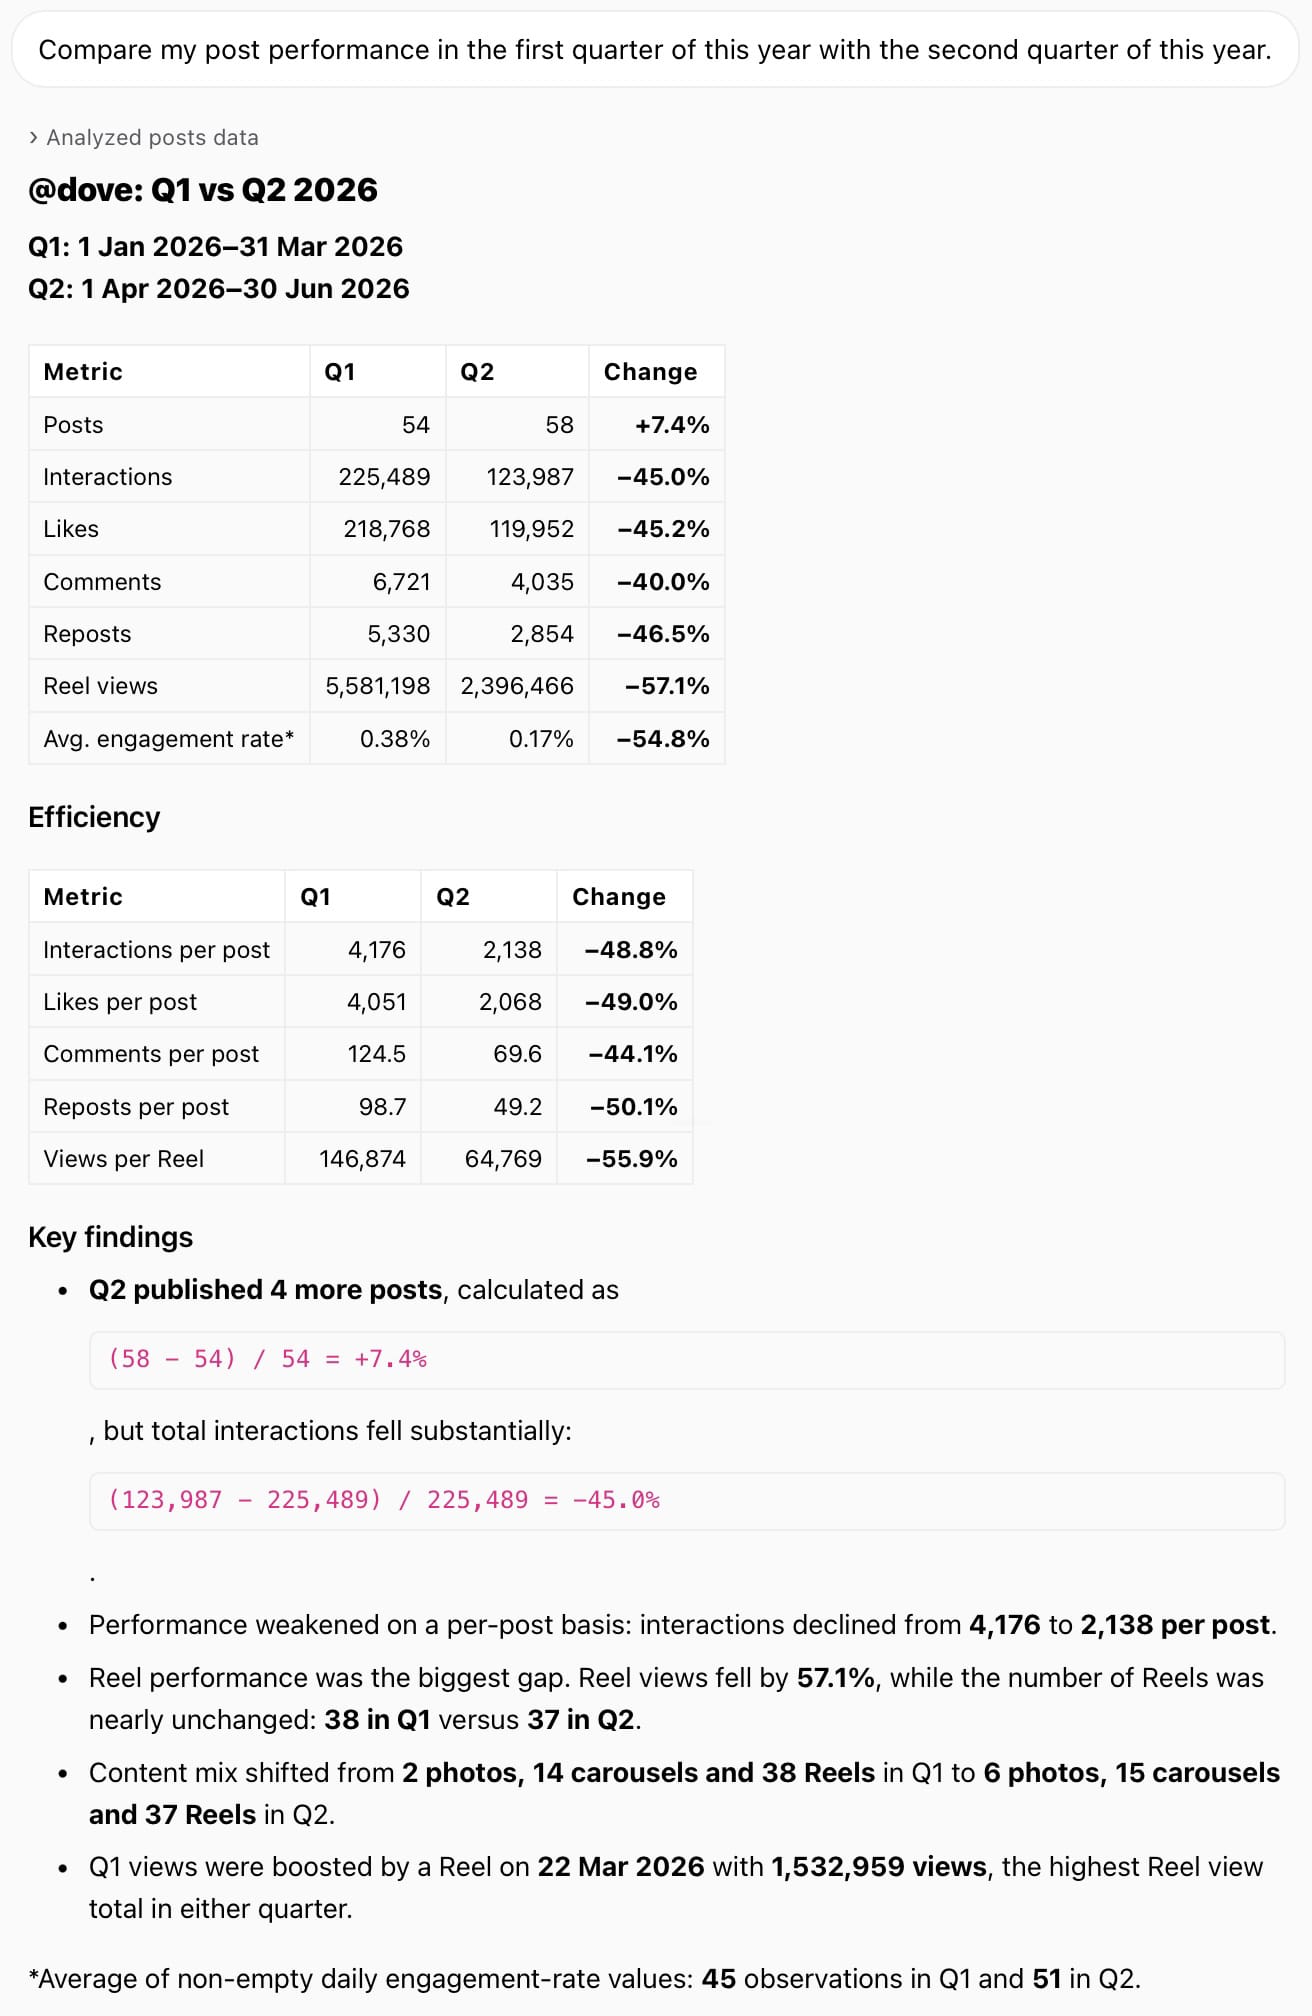
The Minter.io AI Analyst pulls all the relevant data from your report to provide a unique, tailored response specifically for your social media account and its performance. Detail in plain language the metrics and date range you want a comparison for and let the AI Analyst do the hard work for you. It will sift through all the important information to compile an easy-to-understand response for you. You can even ask the AI Analyst to turn it into a report you can download straight from the chat box. Continue the chat and let the AI Analyst detail how this comparison can shape your next steps and improve your presence on social media.
Use the Minter.io AI Analyst to compare data:
- From any date ranges
- Tailored around specific metrics
- That supports specific goals and focuses
- And compile it into a downloadable report
Key social media metrics to compare
With Minter.io and its comparison features, you can compare the metrics that mean the most to your business and brand, create custom reports such as an Instagram comparison report, and compare the performance of your social media content over any time frame (such as year over year, monthly or completely custom).
Here are some key metrics to consider to get you started…
Followers
Get a clear idea of your follower growth and whether it has snowballed or slowed down in comparison with a previous time period. Dive further into the data of the top-performing period to determine what you were doing differently, and use this to shape future strategies.
Reach Rate
Social media success starts with being seen. Compare your reach rate from different date ranges to understand how the algorithm was serving up your content and the percentage of your followers that saw your posts. Aim to replicate techniques from posts published during the better performing date range.
Engagement Rate
The engagement rate is often used to determine the quality of your engagement as it measures the amount of engagement (likes, comments, shares, saves and reposts) against the amount of posts published and the number of followers. Compare your engagement rate over different time periods and use this to negotiate brand deals, collabs and partnerships. This comparison can help you determine the value of your audience’s attention and gain financial compensation in line with your performance.
Specific engagement metrics
If you have a specific goal you’re striving for, such as gaining more comments, shares or saves, compare the performance of these specific metrics after implementing different strategies to determine their effectiveness.
Easily compare the performance of your social media accounts across Instagram, TikTok, Facebook, Threads, X and LinkedIn with Minter.io - the social media analytics tool for brands and businesses. Try it today and discover all the features in this article.