How to access your Instagram Engagement Rate insights

Engagement is a key social media metric which is vital to be tracked if you want to accelerate growth online. With this single metric you can assess how well your content is performing, make pivotal moves for bettering your content and even negotiate strong brand deals and partnerships.
With Minter.io you can instantly access several engagement rate graphs for your Instagram account and the accounts of your competitors. There’s no need for an engagement rate calculator - we’ve done the sums for you.
Here are all the engagement rate graphs you'll need to grow your business on Instagram.
Engagement Rate graphs for your Instagram account
Minter.io hosts engagement rate graphs for your own Instagram account. This includes graphs for your posts, profile and ads.
You can use the date picker to change the selected date range and view any of your engagement rate graphs (excluding benchmark graphs) over any specific time period. This is fully flexible so you can view your data over whichever time period matters to you and your brand.
To start your virtual tour of the available engagement rate graphs, we’ll be looking at the Posts section of your Minter.io Instagram profile.
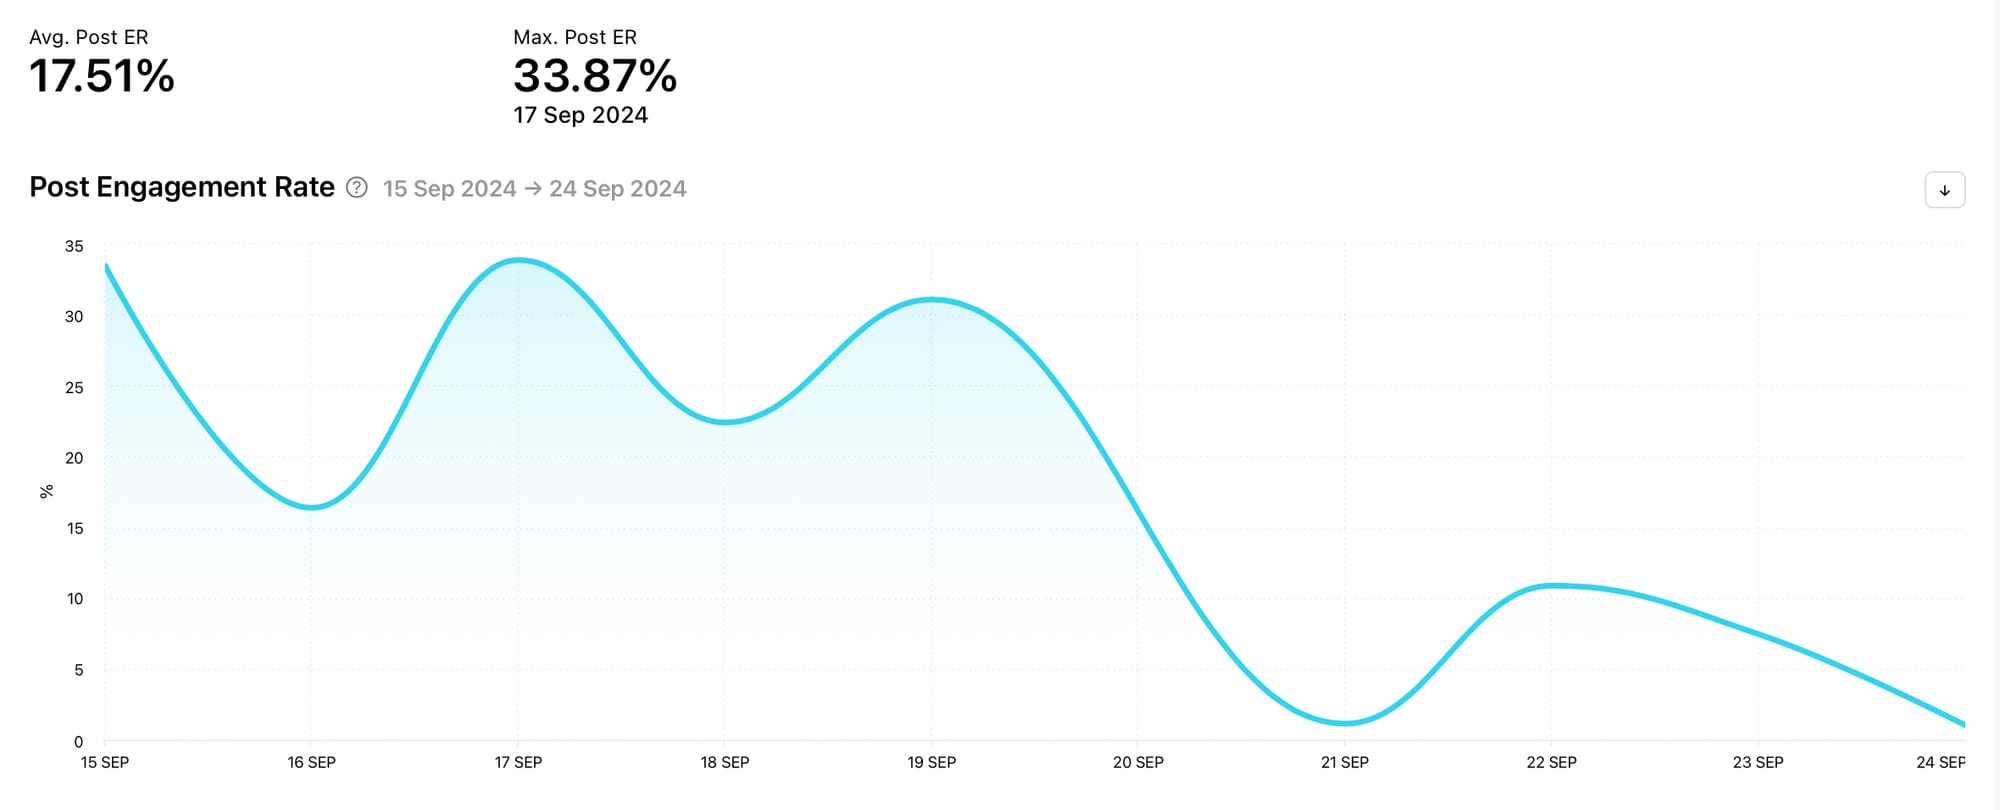
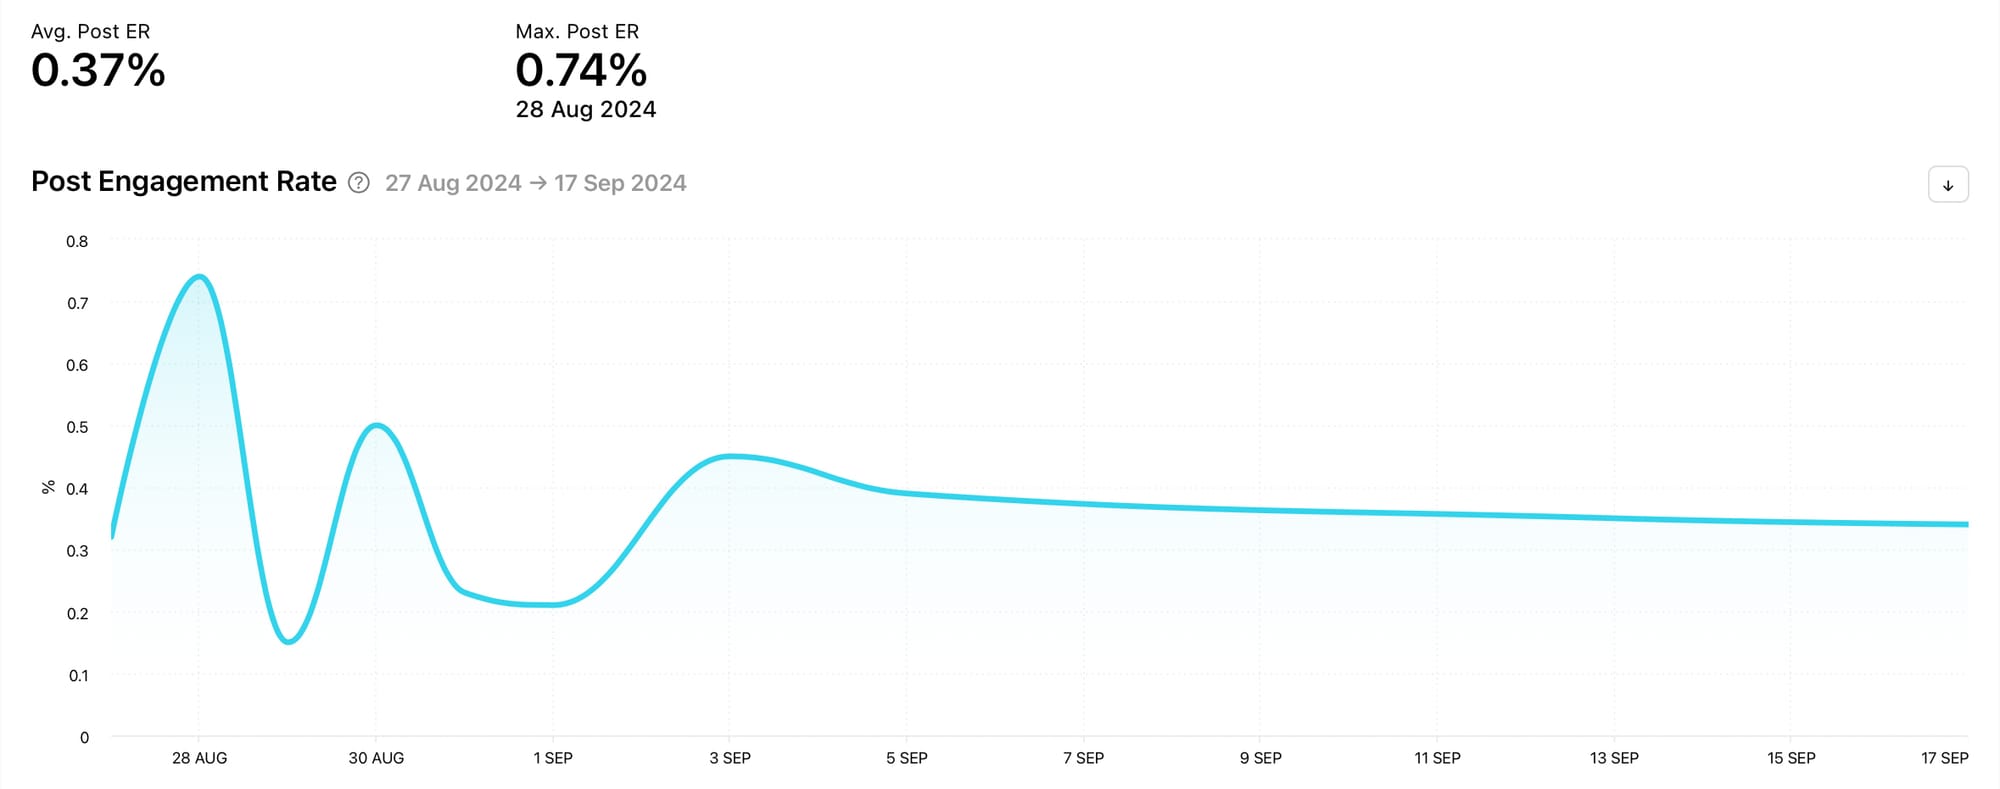
Post Engagement Rate graph
The Post Engagement Rate graph shows the sum of all likes and comments divided by the number of posts and the number of followers on a given day within the selected date range. This is the percentage of followers that interacted with your posts. Above the graph, the average post engagement rate and the maximum post engagement rate are displayed. This makes it easy to pick out key engagement rate data without getting out a calculator. Hover over any part of the graph to view the engagement rate on a specific day. This can allow you to pinpoint posts that drove higher levels of engagement for replication.
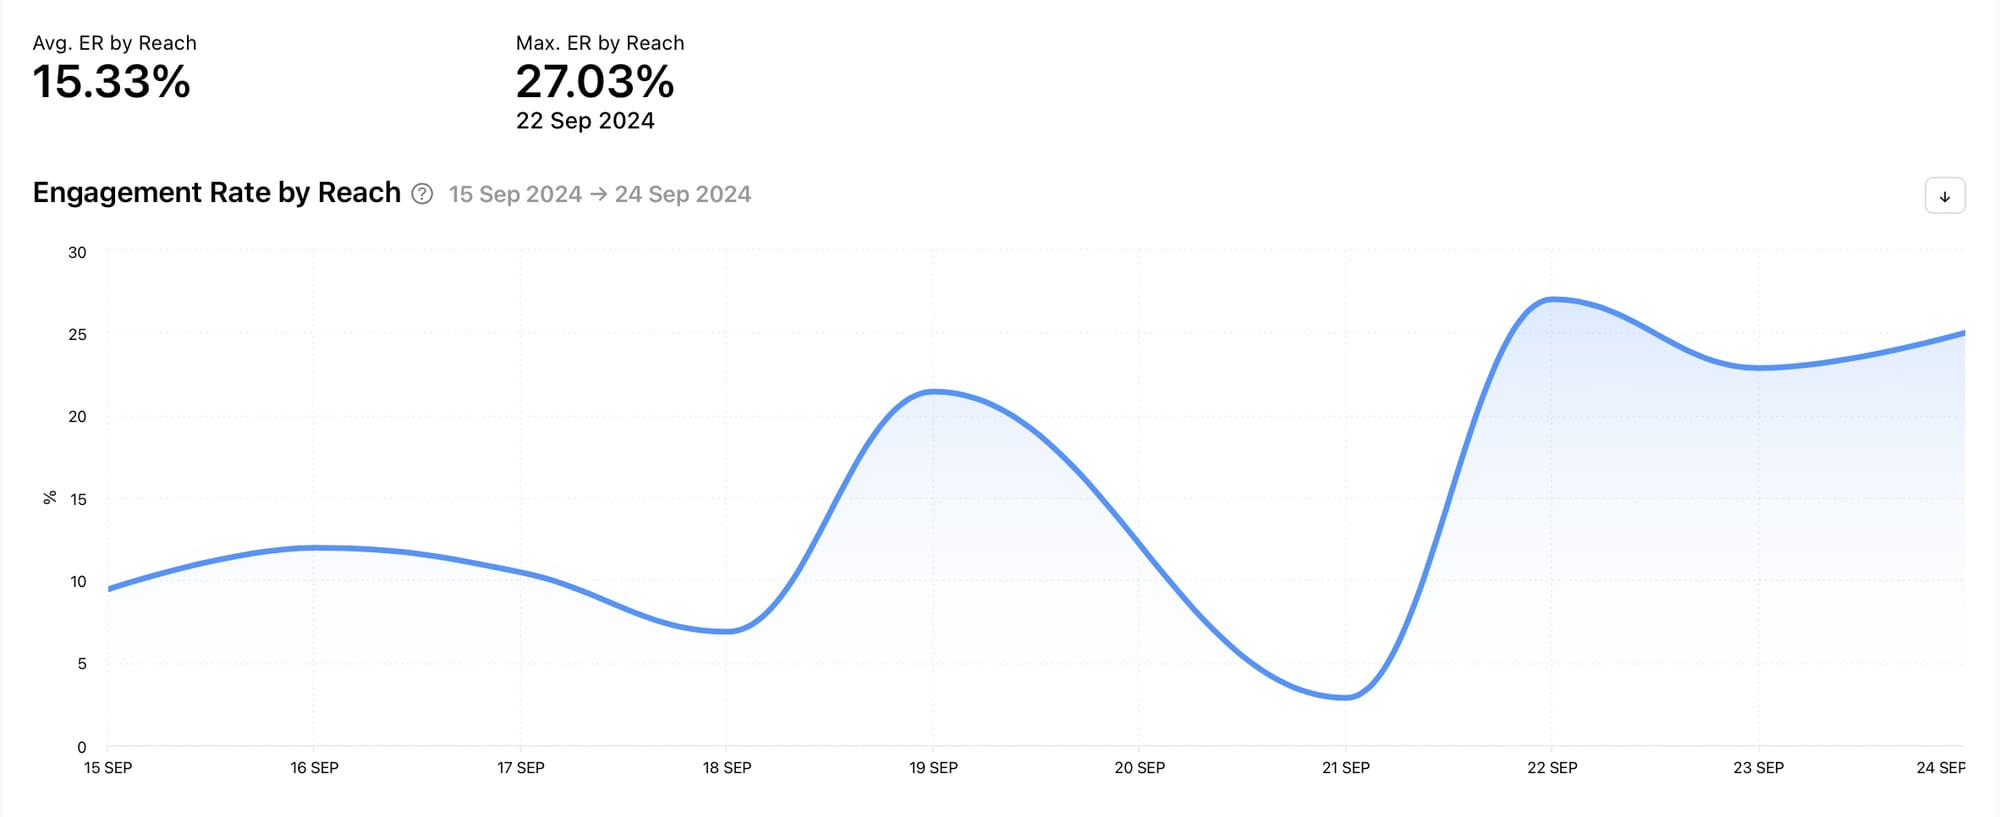
Engagement Rate by Reach graph
The Engagement Rate by Reach graph shows the sum of all likes and comments divided by reach and by the number of posts on a given day within the selected date range. This is the percentage of unique accounts that interacted with your posts. Above the graph, the average engagement rate by reach and the maximum engagement rate by reach are displayed. Hover over any part of the graph to view the engagement rate by reach on a specific day. This graph can give you a better sense of how well your content performed in terms of engagement because it takes into account the amount of accounts your content was served to.
Individual Posts
Scroll to the bottom of the Posts section of your Instagram profile on Minter.io or navigate to 'All Posts' to view engagement information for individual posts. You can sort your posts by engagement rate or engagement rate by reach and view the engagement rate and engagement rate by reach percentages for specific posts on your Instagram profile. This can show you which posts are performing the best in terms of engagement, which can help shape the creation of future content to replicate similar levels of engagement.

Ads
Head to the Ads section to view the Engagement Rate by Reach graph for your ads on Instagram. This shows the sum of all likes and comments divided by reach and by the number of ads on a given day within the selected date range. This is the percentage of unique accounts that interacted with your ads. Above the graph, the average engagement rate by reach and the maximum engagement rate by reach are displayed. Hover over any part of the graph to view the engagement rate by reach on a specific day. This graph shows you how well your adverts performed, helping you shape decisions for further ad creation.
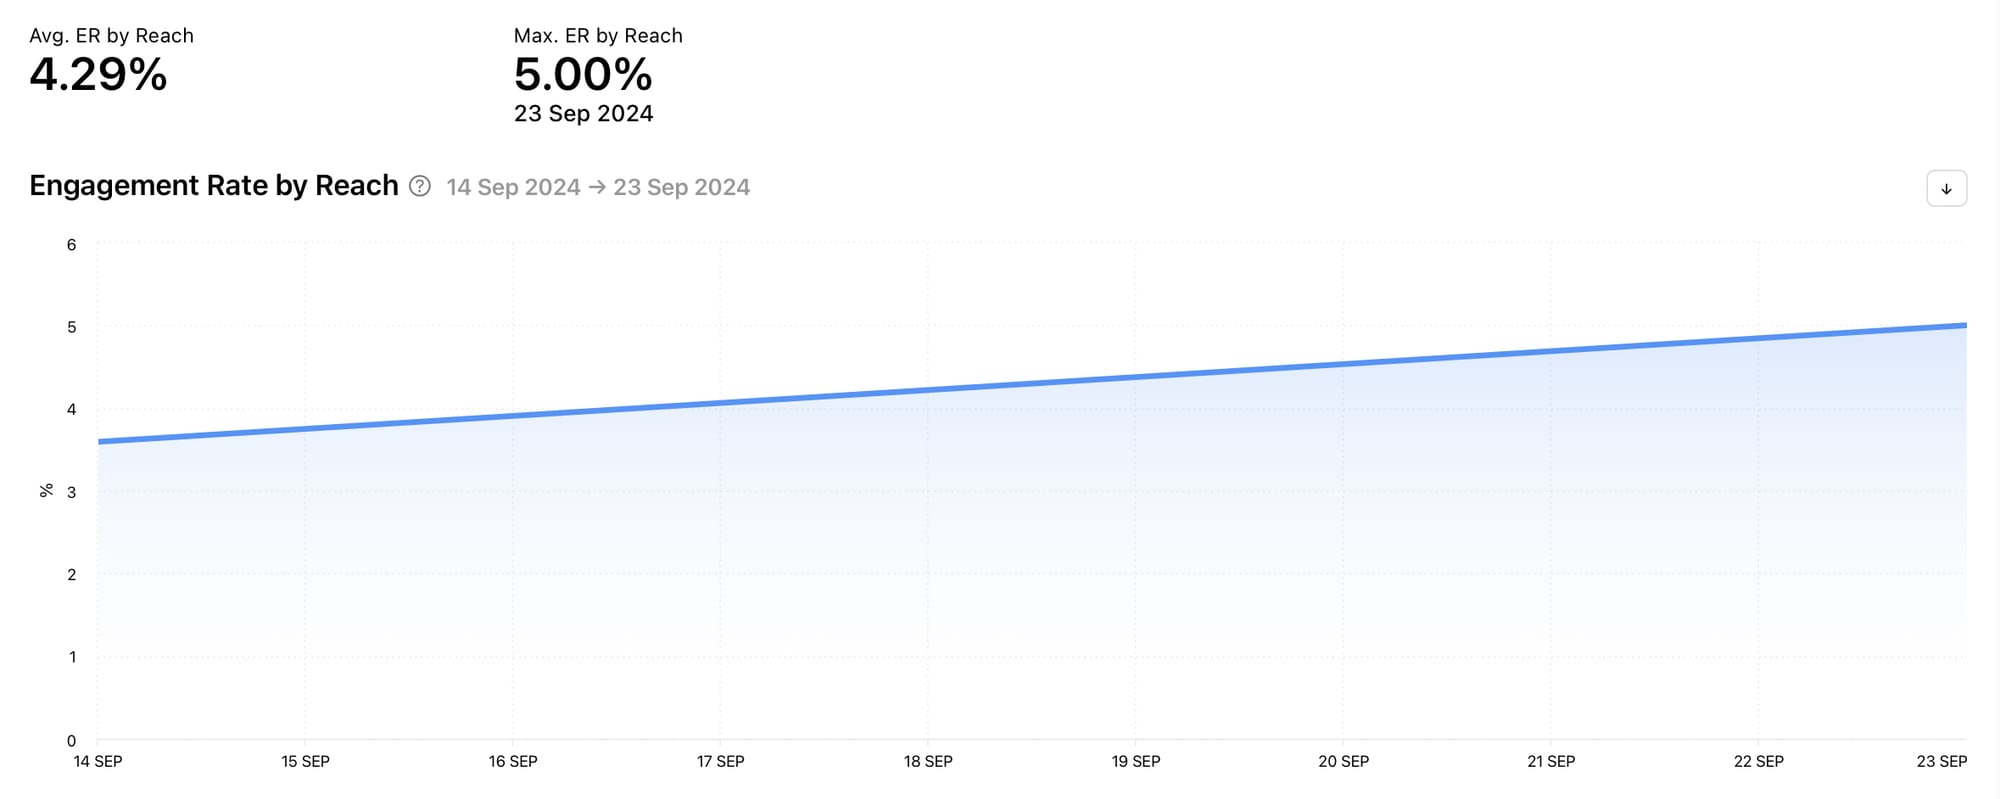
You can also view engagement rate by reach information for individual ads. Sort your ads by engagement rate by reach and view engagement rate by reach percentages for specific ads.

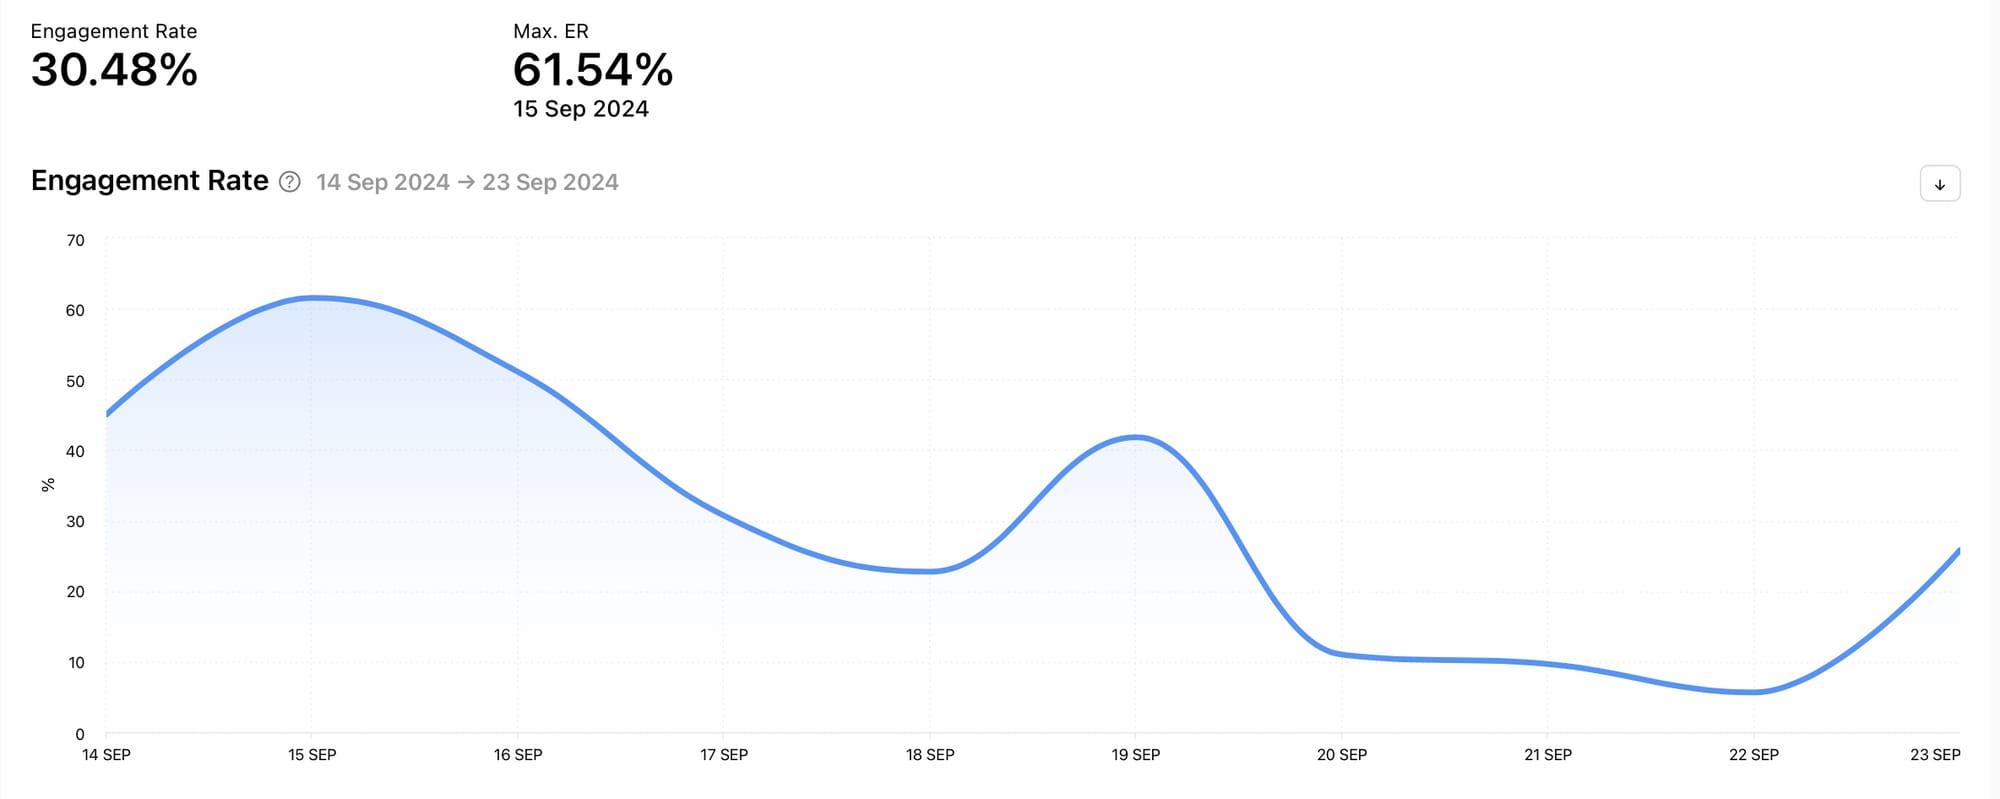
Profile Engagement Rate graph
Head to the Profile section to view the Engagement Rate graph for your Instagram profile. This shows the percentage of followers that interacted with your posts, stories or ads within the selected date range. Above the graph, the average engagement rate and the maximum engagement rate are displayed. Hover over any part of the graph to view the engagement rate on a specific day. This graph can help you determine how well your Instagram profile is doing as a whole as it takes into account multiple content types in a single graph.
Engagement Rate graphs for your Competitors
Not only does Minter.io provide engagement rate graphs for your own data, you can also view engagement data for your competitors. This can give you insight into what they’re doing well so you can gather inspiration, avoid pitfalls your competitors have tested first and see how your business is performing in comparison. Link an Instagram competitor account to your Minter.io account to explore more.
Post Engagement Rate
Head to the Posts section of your competitor’s Instagram data on Minter.io to view the Post Engagement Rate graph. This shows the sum of all likes and comments divided by the number of posts and the number of followers on a given day within the selected date range. This is the percentage of followers that interacted with posts. Above the graph, the average post engagement rate and the maximum post engagement rate are displayed, making it easy to compare your data with theirs. Hover over any part of the graph to view the engagement rate on a specific day so you can find days when posts performed well in terms of engagement.
Individual Posts
Scroll to the bottom of the Posts section of your competitor’s Instagram profile on Minter.io or navigate to ‘All Posts’ to view engagement information for individual posts. You can sort posts by engagement rate and view the engagement rate for specific posts. This can show you which posts are performing the best in terms of engagement, which can help provide inspiration and insight into what is working well for your competitor, enabling you to incorporate techniques that might work well for your own content.

Engagement Rate Benchmark graphs
Minter.io hosts benchmark engagement rate graphs so you can see how your engagement, and the engagement of your competitors, stacks up against accounts of a similar size. View benchmark graphs in the Benchmarks section of your Instagram account on Minter.io and the accounts of your competitors.
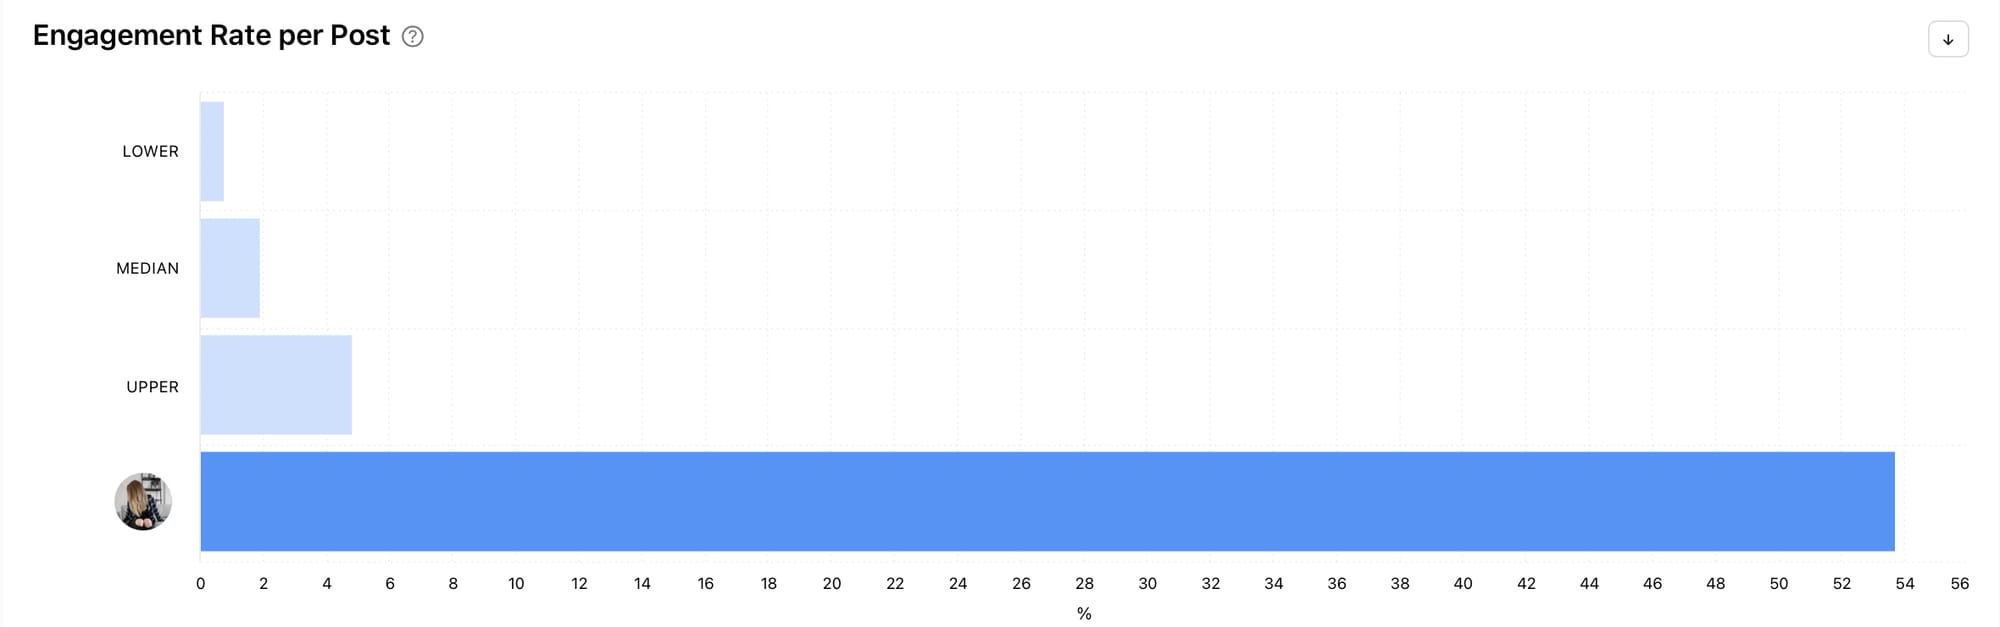
Engagement Rate per Post graph
The Engagement Rate per Post graph in the Benchmarks section of your Minter.io account shows the average engagement rate per post in comparison with other Instagram accounts in a cohort of similar account sizes. This graph gives you a clear indication of whether your content gains lower, median or upper levels of engagement. Hover over a bar to see the percentage of engagement your account is achieving and the percentage associated with lower, medium and upper levels of engagement. This is great for seeing whether you need to focus on improving your levels of engagement, however if your engagement percentage is high, this provides excellent leverage for better business deals, partnerships and collaborations on Instagram.
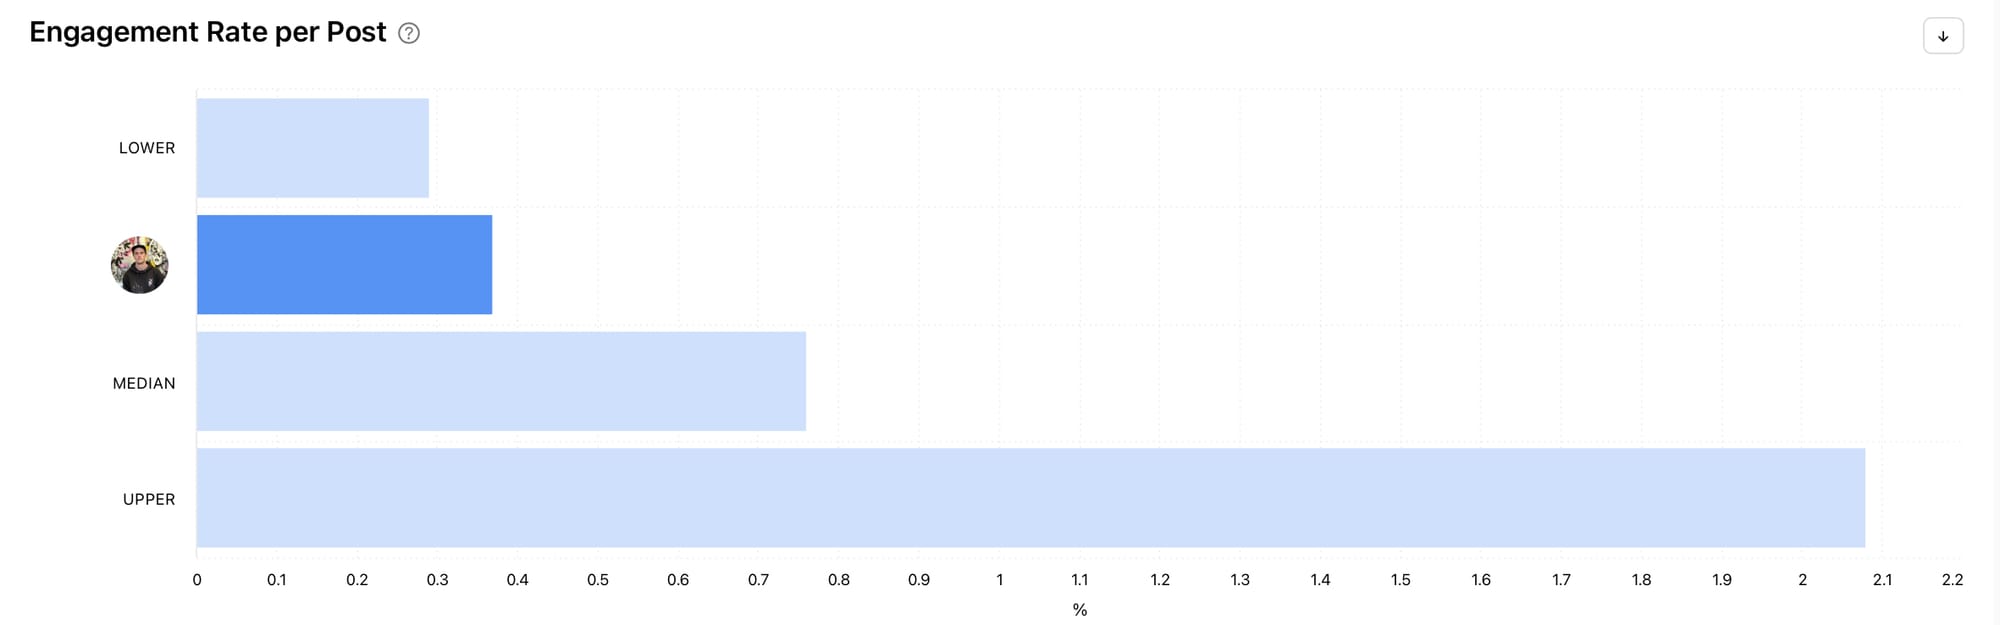
Competitor Engagement Rate per Post graph
View the same graph for your competitors on Instagram. You can use this data to see how well your competitors are performing in terms of engagement. If their performance is higher than your own, take note and use them as inspiration for upping your game. If your performance is higher, you can use this graph in negotiating deals by comparing your own data with data from similar competitors.
Unlock your engagement rate graphs with Minter.io and discover many more graphs waiting to bring your social media game to the next level. Find out more here.
Try Minter.io now→