How to get more followers on TikTok using Minter.io

Everyone wants more TikTok followers. Who wouldn’t? When more followers means more opportunity for connection, community, trust, sales and ultimately business growth, sales and money, you’d be a fool to pass up on knowledge to see that TikTok follower count rise.
TikTok is notorious for putting fresh content in front of new audiences, so it’s vital to have a plan in place to turn passive viewership into loyal fandom. In this article, we’re going to show you exactly how to use key analytical graphs from Minter.io to help you get more followers on TikTok using your own unique data.
Get to know your follower graphs
When it comes to understanding your follower count over time, there are several graphs to get to grips with. Let’s have a look at the follower graphs you need to know about in order to understand exactly what’s going on with your follower count.
Followers
Located in the Audience section of your TikTok Minter.io data, the Followers graph shows the number of TikTok followers you had within the selected date range. Look above the graph to find: the total number of followers; the total follower change within the selected date range alongside the percentage of growth or decline; the day, week or month (depending on the settings you’ve selected) with the maximum amount of follower change; and the average amount of follower change per day, week or month. Hover over the line graph to see the exact amount of followers on a specific day, week or month.
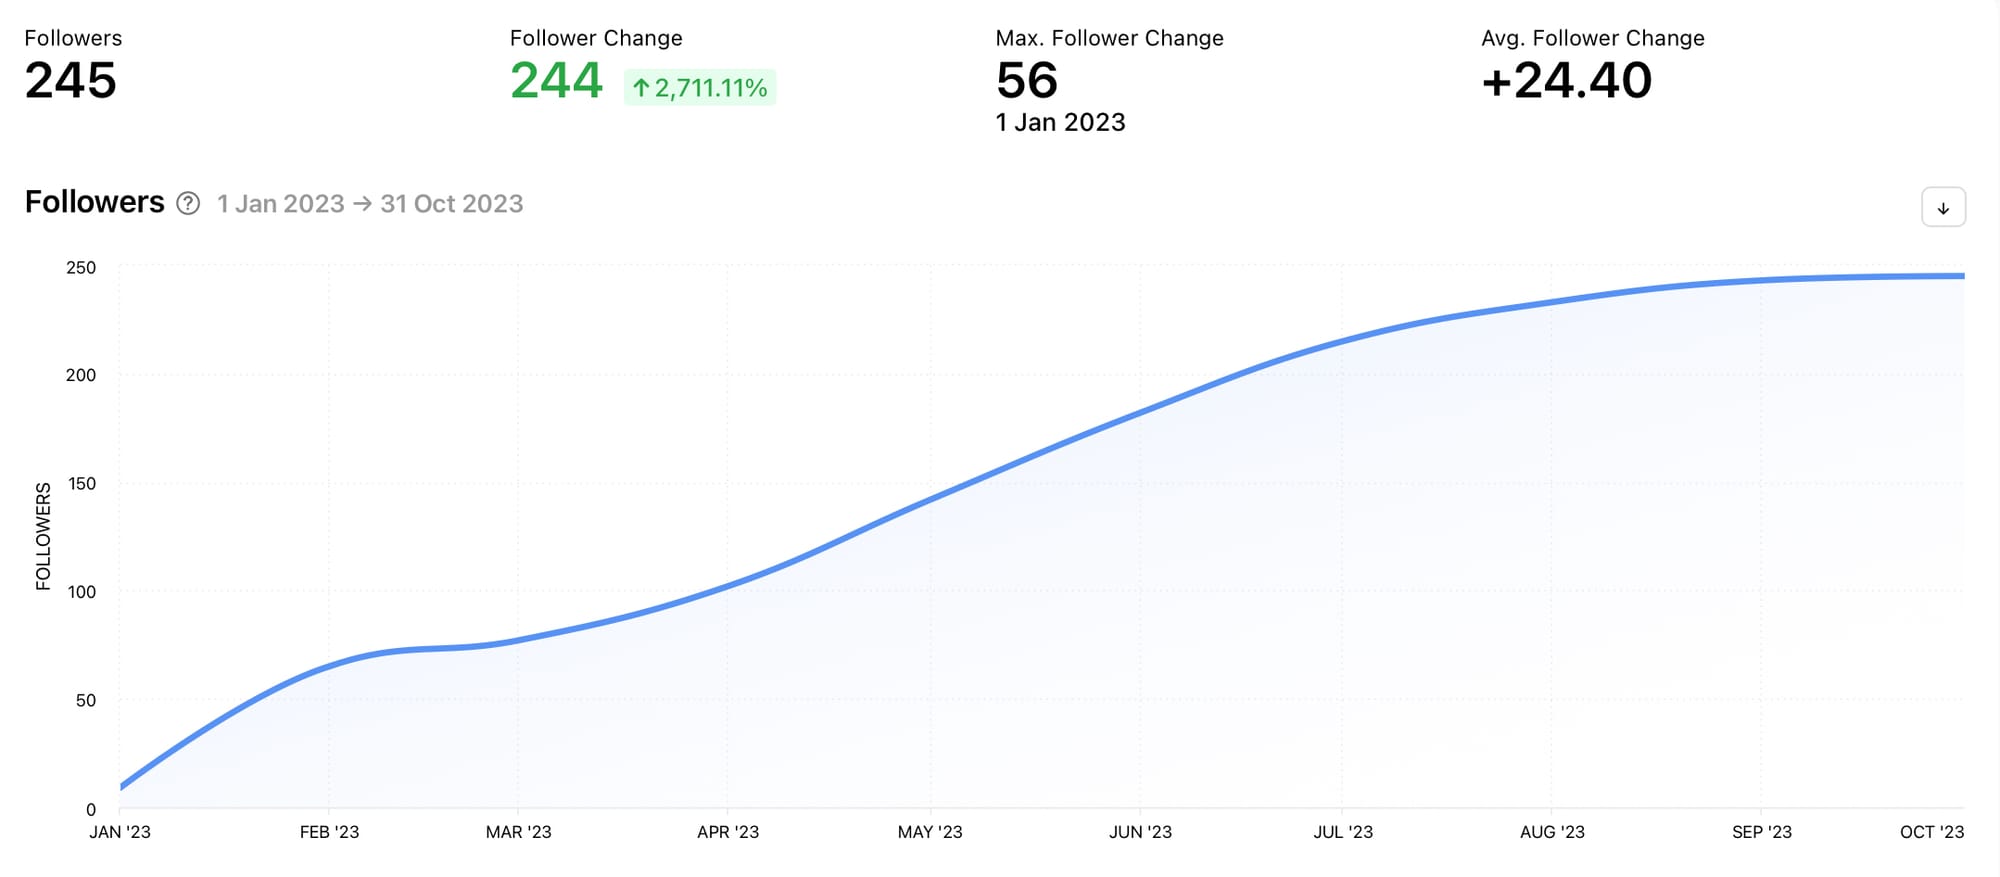
Use this graph to see the trend of your total follower count. Is your TikTok following growing or shrinking? Is the change in your follower amount steep or gradual? Are there dips and spikes in the amount of followers and what could have sparked these noticeable changes? The Followers graph acts as a springboard to determine which other graphs to look at to inform your next moves.
Check out the graph above. The TikTok follower amount has been growing gradually but it’s reached a plateau. It hasn’t seen any significant spikes or dips. Although the follower amount has been positively trending, this graph screams out that this account needs to shake things up. It’s time to experiment with different content types and themes, get some inspiration from TikTok accounts that are performing well and implement the ideas they spark. It might also be worth hopping on some trends, interacting with other accounts and adjusting how consistently and frequently content is posted.
If you have spikes and dips in the Followers graph, diving into the exact dates and content that triggered the changes would be highly beneficial. From there you can replicate strategies that have proven to work for you on TikTok, while avoiding pitfalls that have already arisen.
Follower Change
Located underneath the Followers graph, the Follower Change graph shows the absolute increase or decrease in followers during the selected date range. View this graph by day, week or month. Choosing to view this graph by month will give you a rounded look at how your follower change trended, whereas if you view this graph by day, you’ll be able to more easily pinpoint specific dates that gained or lost followers. Hover over a bar in this graph to see the amount of follower change in a specific day, week or month.
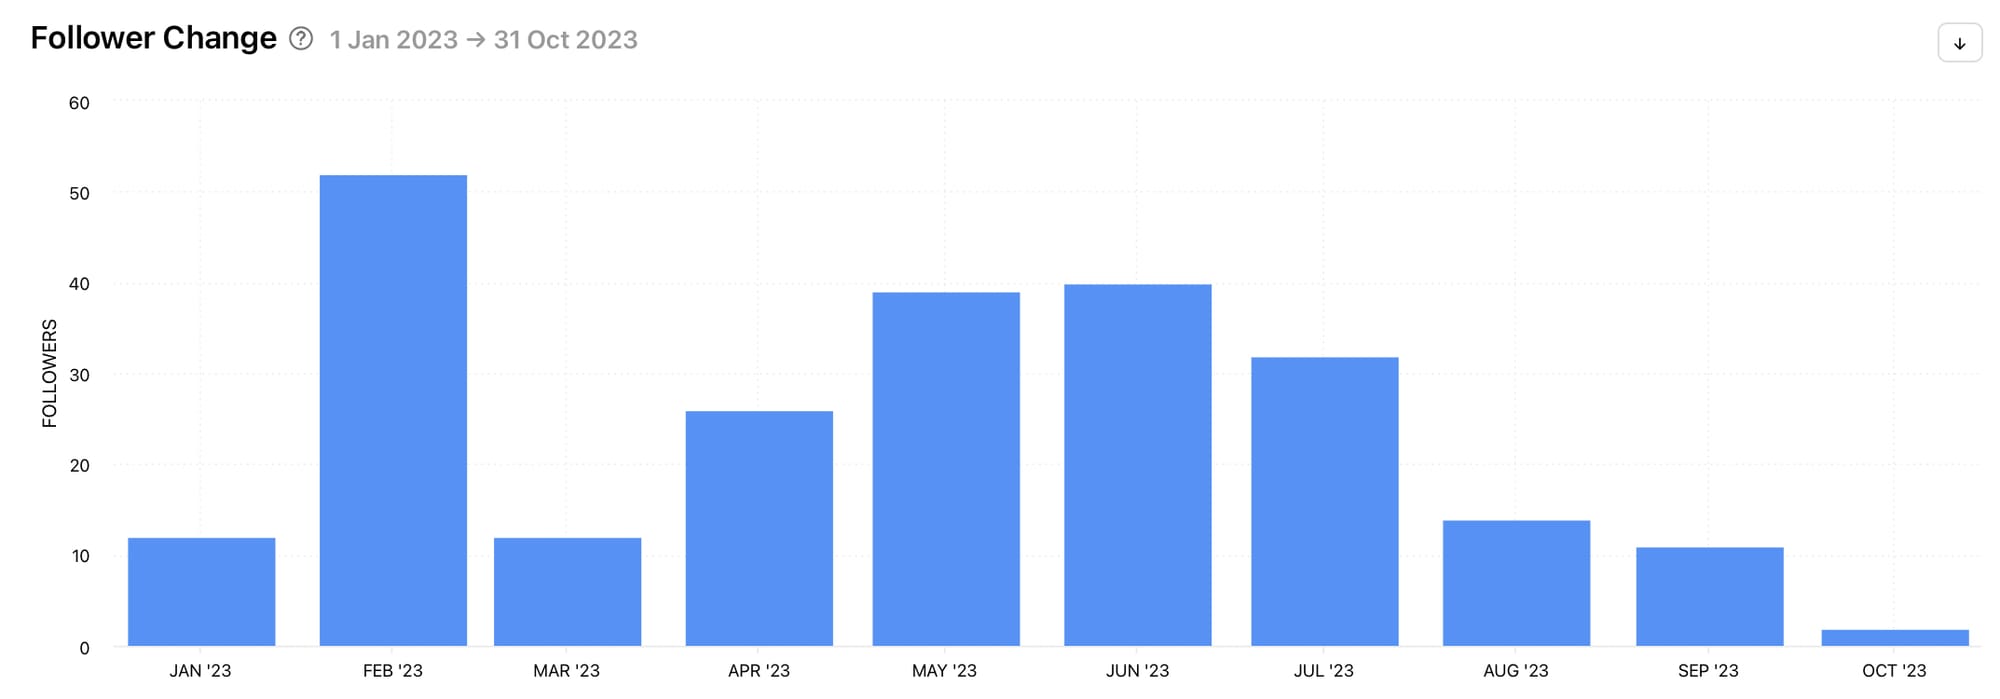
Use this graph to see your follower change over days, weeks or months. Which times gained you the most amount of followers and which gained you the least? Were there times when your follower change was negative? Are there significant spikes or dips in the data and what could have caused them?
Check out the graph above. Although the TikTok follower change has remained positive, the amount of growth has varied dramatically throughout the selected date range. What was this account doing in February that it failed to replicate in March? What caused the drop in followers from August onwards? Finding the answers using subsequent graphs by Minter.io could provide quick wins and help restore higher levels of follower growth. Explore the Videos graph in the Content section to determine whether consistency and frequency of posting is the main issue. If that isn’t the issue, it’s likely the content itself needs addressing.
All Videos (sorted by Follower Change)
Let’s check out the content you posted within the selected date range that resulted in the biggest amount of positive follower change for your TikTok profile. Head to the All Videos section of your TikTok Minter.io data and sort your videos by Follower Change to see which of your TikTok videos gained the most amount of followers. See the exact amount of followers gained or lost underneath each piece of content.
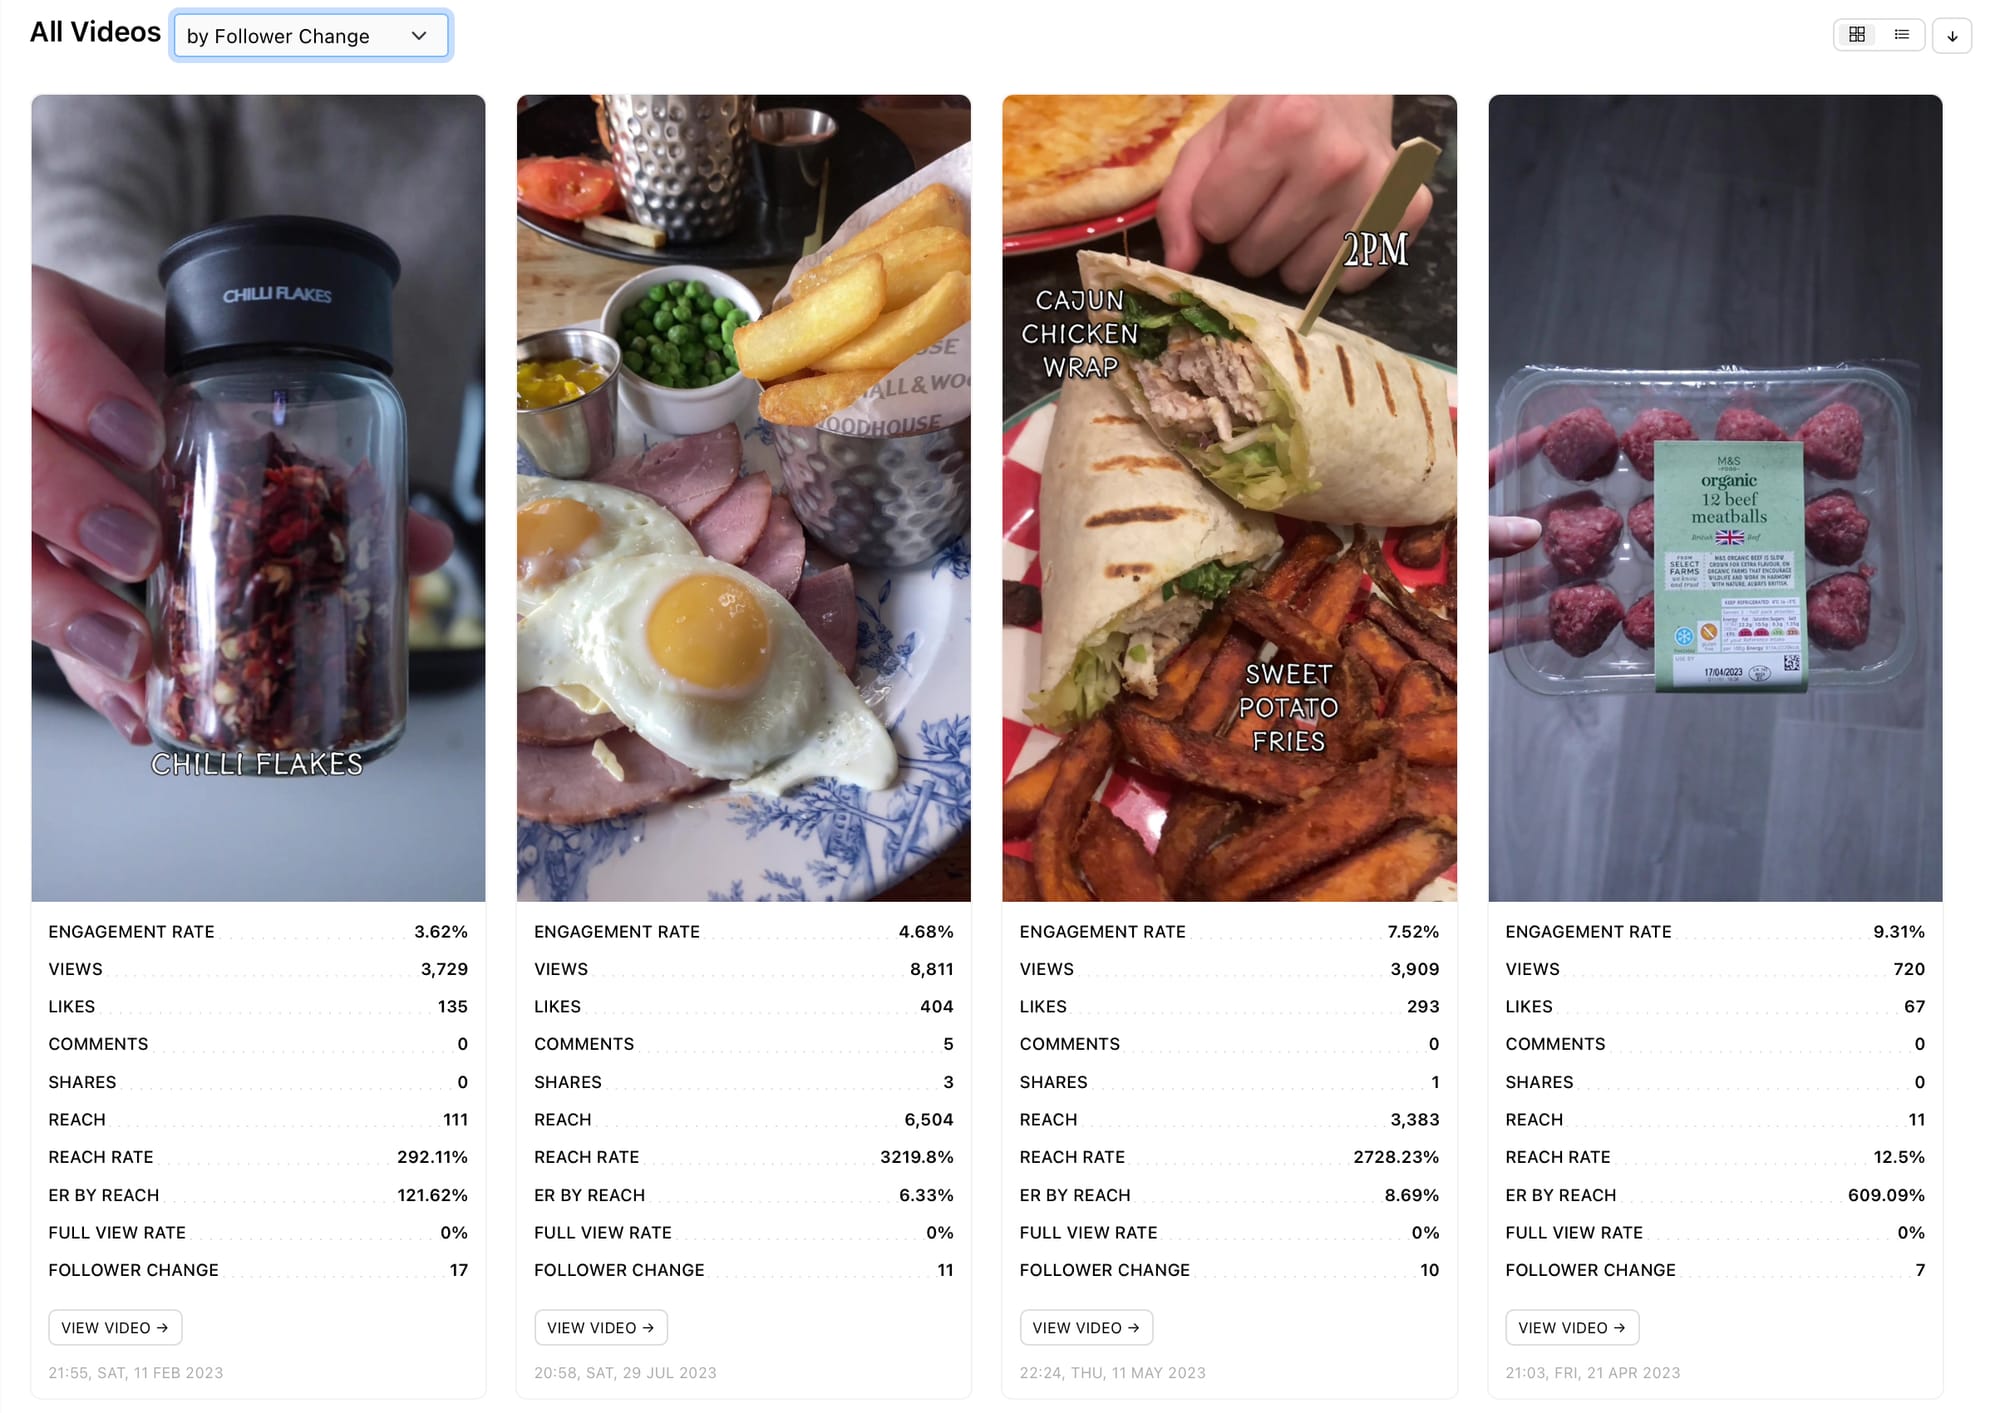
By clearly seeing which pieces of content gained the highest amount of follower change, you can take inspiration from your high-performing content and replicate key elements in an effort to gain similar amounts of positive follower change. Take note of the cover images, colours, text overlays, fonts, music and editing in content that has proven to gain you followers.
Followers 72h
While viewing All Videos, select a specific video and scroll down to find the Followers 72h graph. This graph shows the distribution of followers the video received in the first 72 hours broken into each hour.
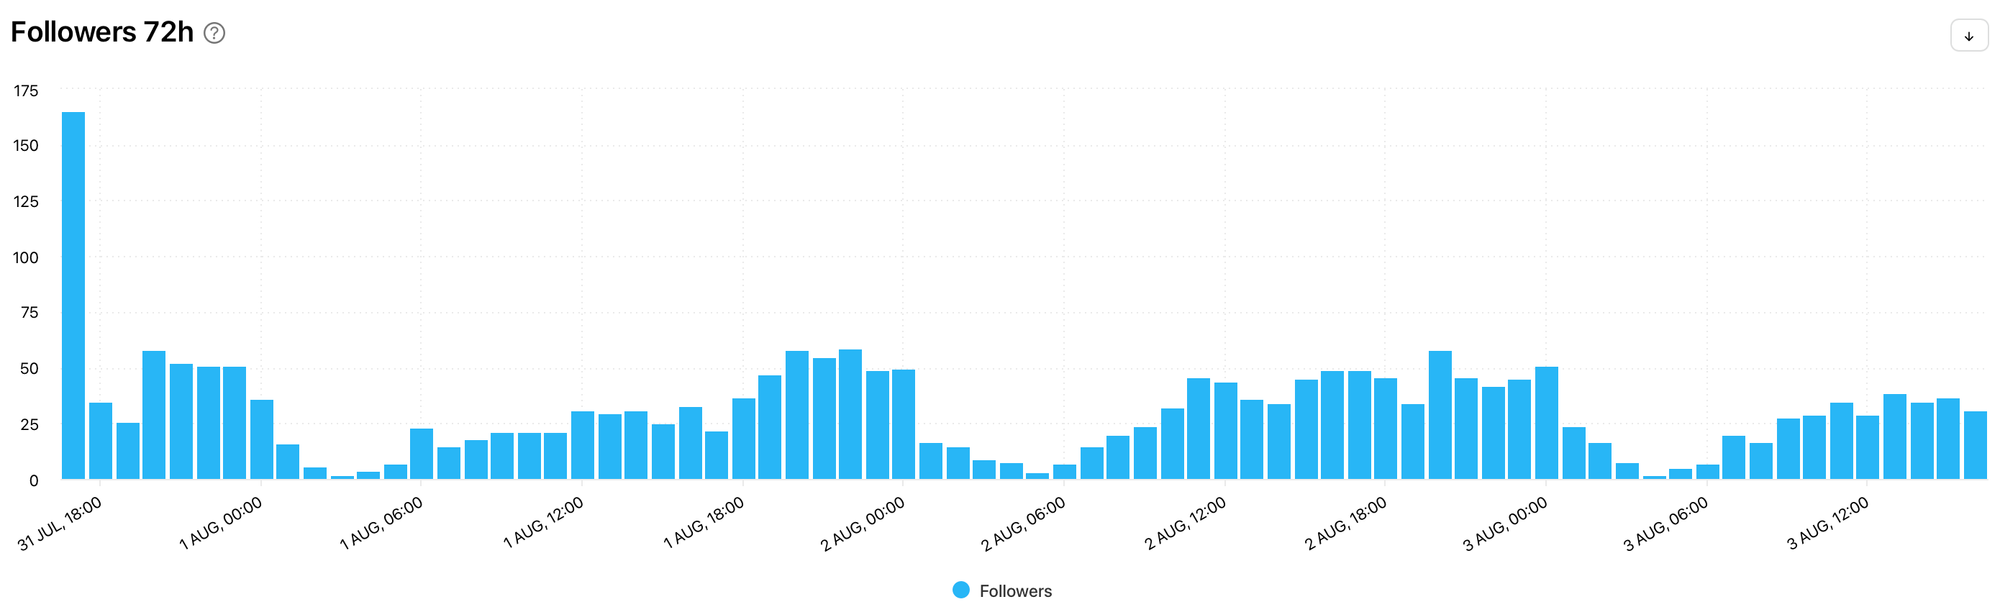
Viewing information gathered soon after content is published can help you understand how early viewers of the content responded to it, which can influence the algorithm to show the content to more people or not. Use the Followers 72h graph to develop strategies based on content that has proven to gain followers fast.
Additional graphs to increase TikTok followers
Understanding what is happening with your TikTok follower count is a start in getting it going in the right direction, but there are several more graphs you can use to supercharge your efforts. After getting to know your follower graphs, focus on the steps below and implement the techniques to encourage your follower count to increase.
Publish content consistently
Building a TikTok following is about building community on the platform. Remember, your follower count isn’t only about getting new followers; it's also about giving your existing followers a reason to stick around. One of the best ways to build trust and community is to keep showing up consistently for the people who want to see your content. By posting frequently, you can keep your existing fans engrossed in your activity while proving to new eyes that your profile can be relied upon to keep producing content they like. Developing a posting schedule and creating content in advance of publication can help you post consistently.
Head to the Videos graph in the Content section of your Minter.io TikTok data to see how often you’ve been posting videos. View the total amount of videos and the average amount of videos as well as your data broken into days, weeks or months.
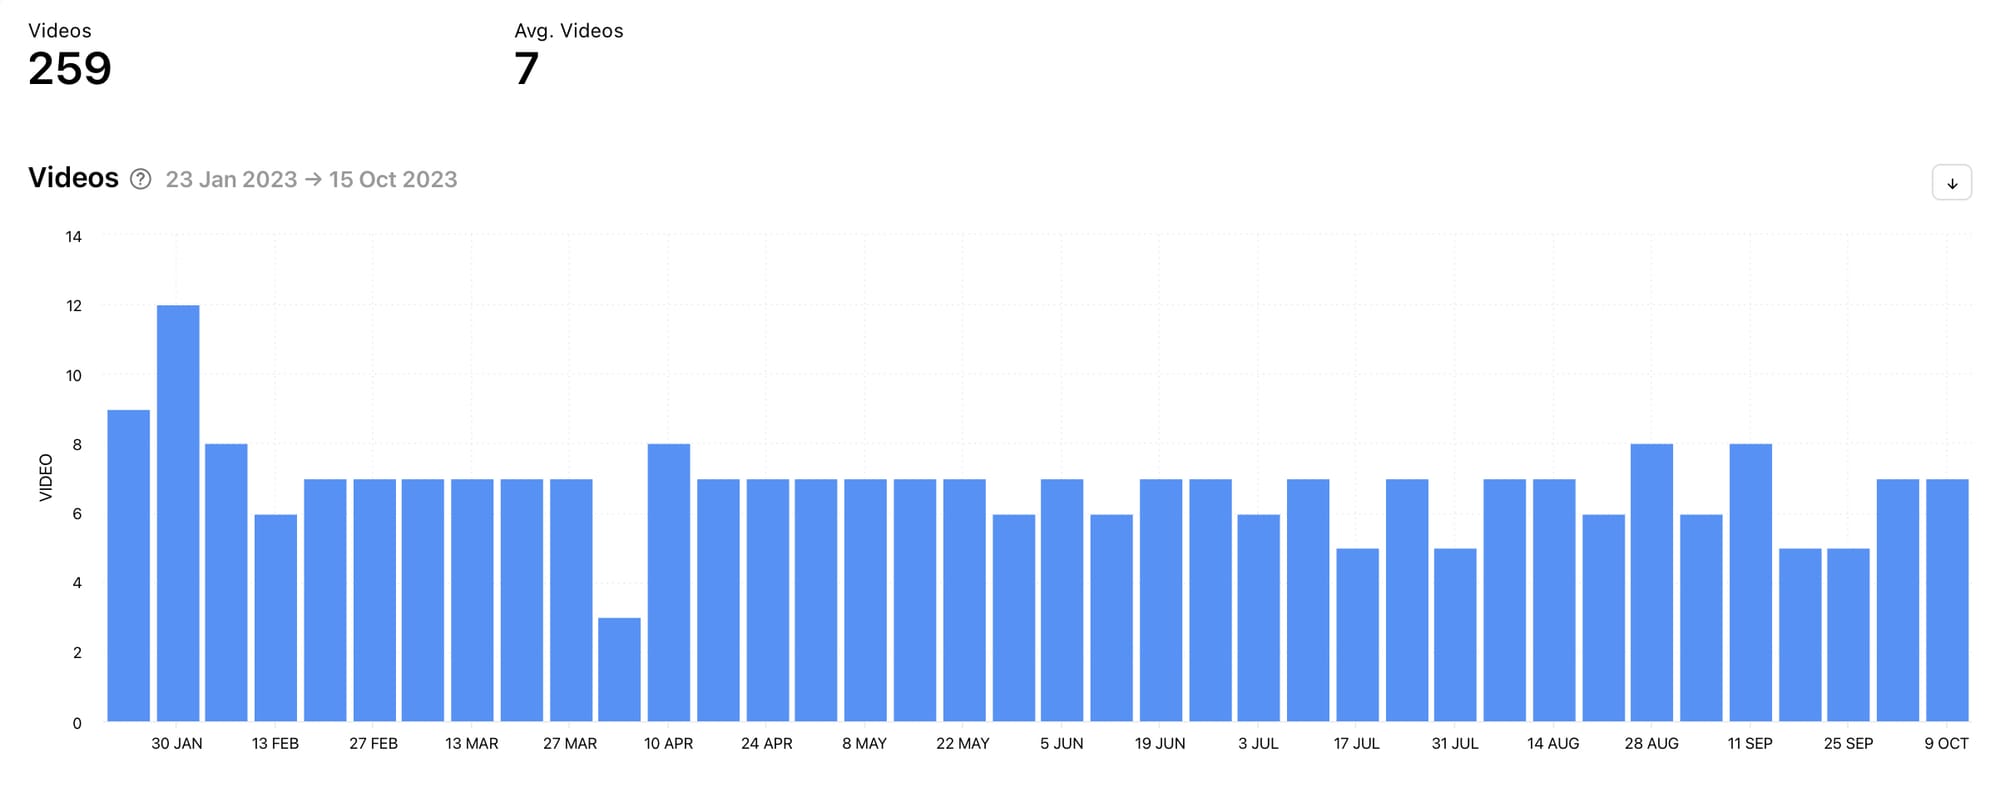
Get a good overview of how frequently you’ve been posting TikTok videos, any gaps within the selected time frame and note the times when you posted more. Combine the information here with other graphs in this section to see the impact your posting habits have on other metrics such as reach and engagement.
Optimise for your audience
Get to know your unique audience in order to retain your current following and attract more people who are likely to enjoy the same kinds of content. Optimising for your current audience can help you develop content which strengthens your community and encourages more people to join.
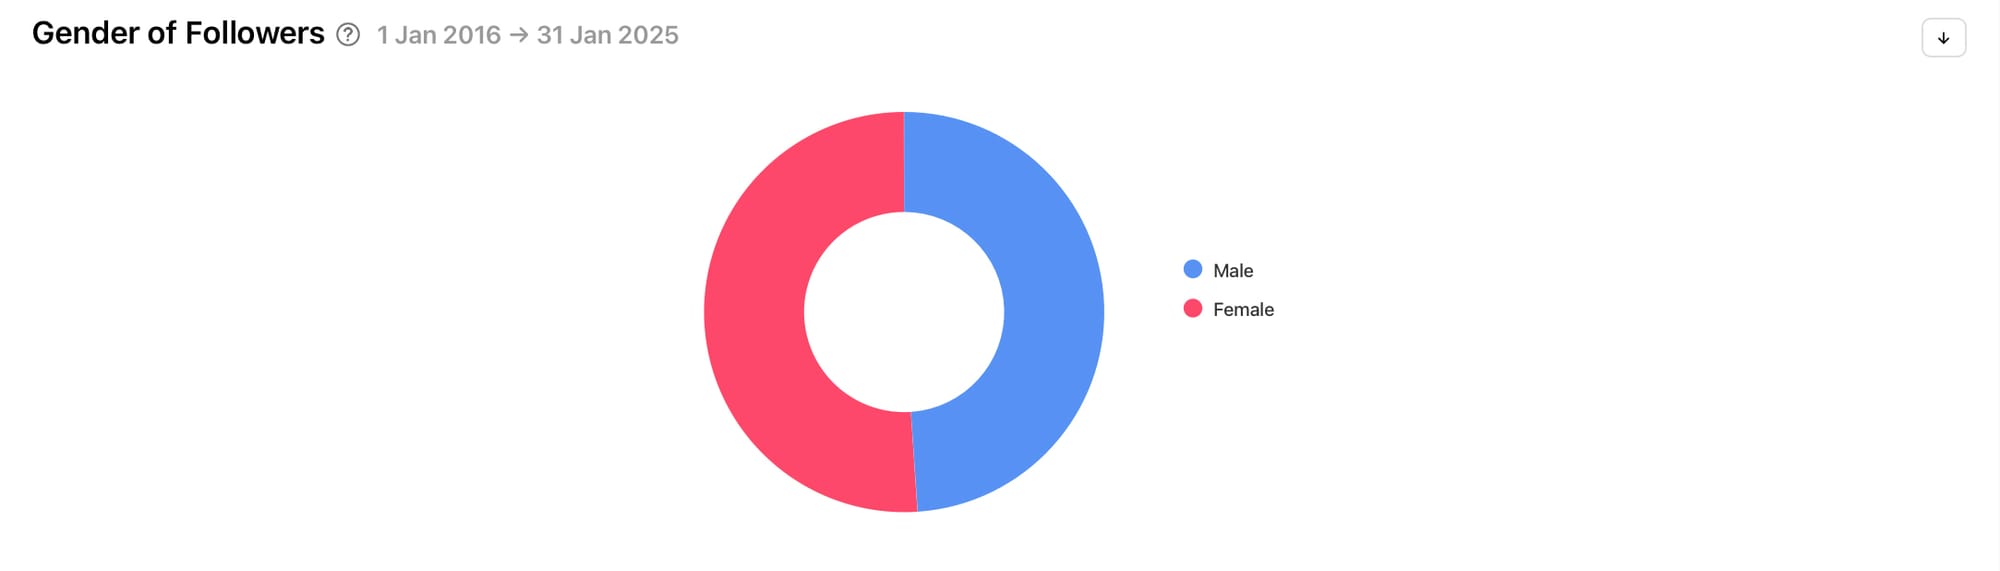
Minter.io provides several demographic graphs in the Audience section of your TikTok Minter.io data to give you insight into your current audience including the: gender of your followers, country of your followers (map & graph) and country of your viewers (map & graph).
Prioritise positive engagement
There are many metrics that can help fuel a thriving following, however engagement is particularly important for triggering the algorithm to work in your favour. Reach, views and engagement all lean on each other. When one increases, the other metrics have the opportunity to increase too. Higher engagement triggers the algorithm to increase the reach. More reach provides more opportunity for more views. More views means more opportunity for more engagement. But without getting engagement rolling in with the initial reach TikTok provides, you’ll be hard-pressed to get your content in front of new people and open up the door for new followers.
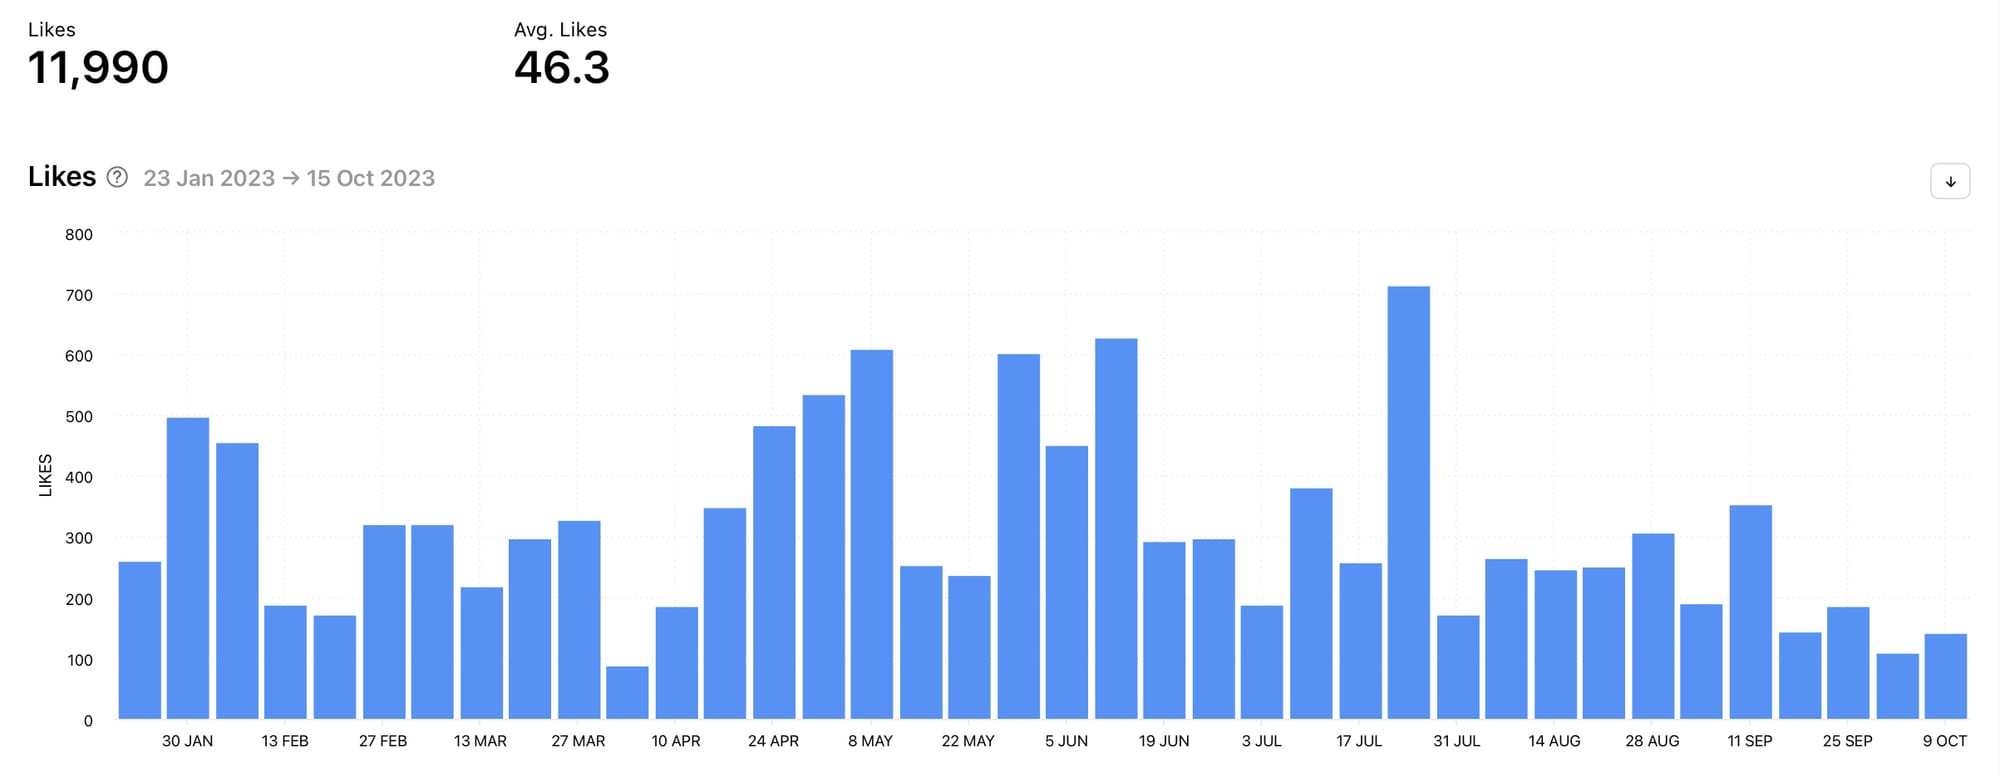
Minter.io provides several engagement graphs in the Content section of your TikTok Minter.io data including: likes, comments, shares, video engagement rate and engagement rate by reach. Producing engaging content is crucial for growing your following but remember that not all engagement is positive. It’s possible to have an explosion of comments and shares for all the wrong reasons which could work against you and impact your follower count negatively. That’s why the Likes graph is an important graph to look at in combination with other engagement graphs.
See how people interact with your profile
You may also want to look at the Profile section of your TikTok Minter.io data to see how people are interacting with your entire profile. If people are tapping on your profile and having an explore, that’s a clear indication that they’re interested in learning a little more about your brand, beyond the content that’s popping up on the For You page. Check out the Profile Views graph to see how often your profile is getting attention.
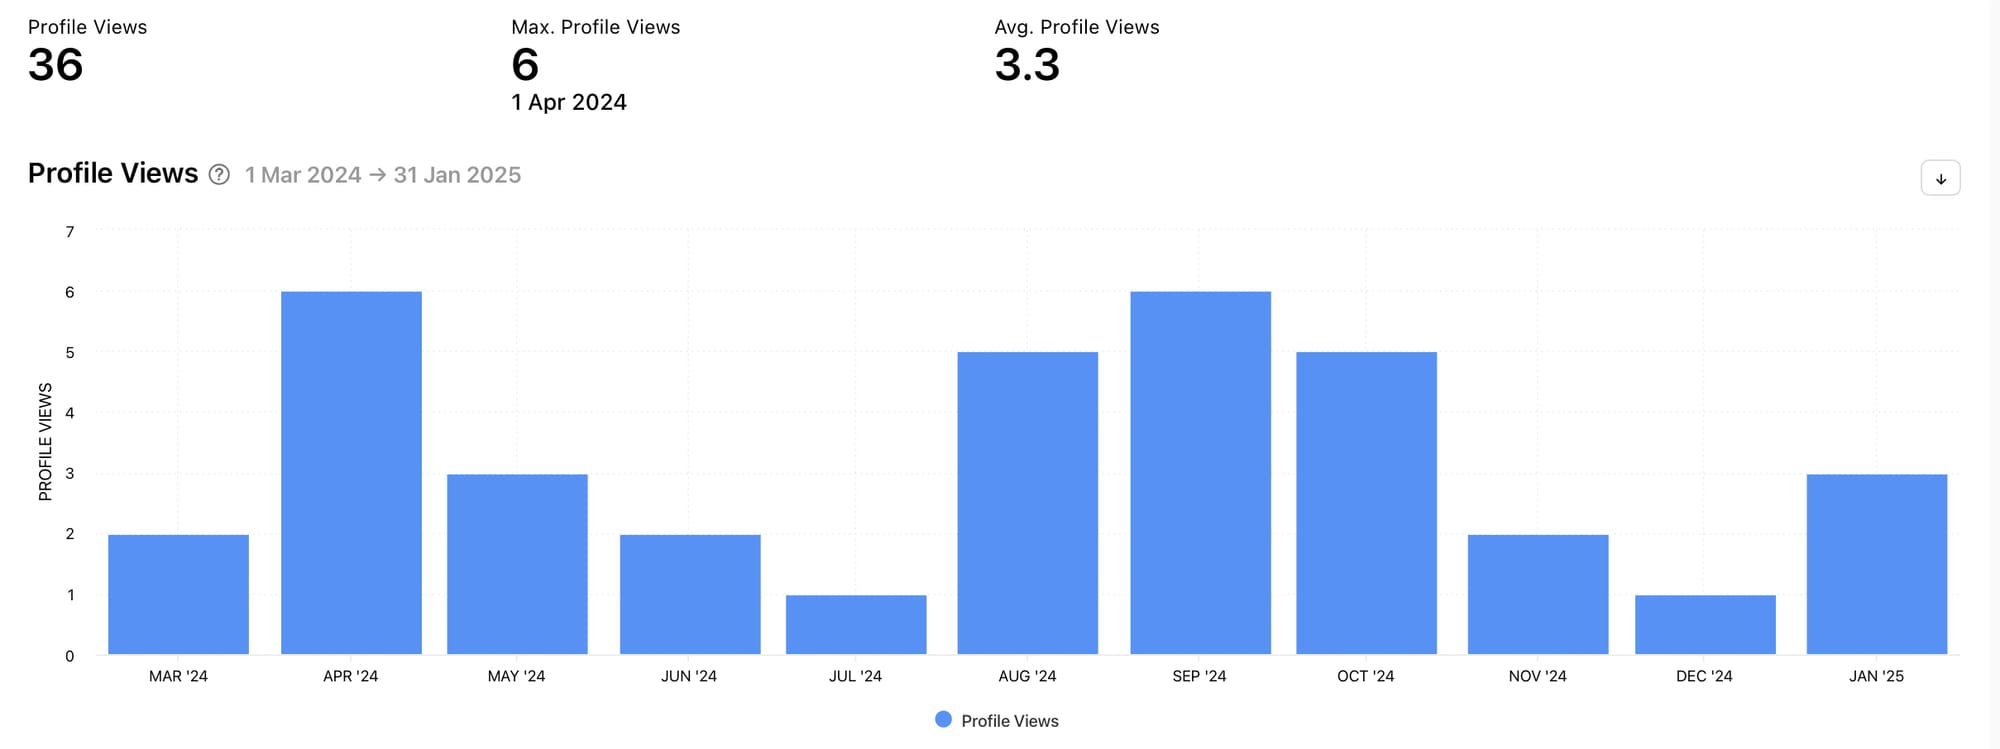
Getting views is only the start. Once people have tapped onto your profile, are you providing clear and effective value? Check out our article about optimising your TikTok profile to make sure those views turn into followers.
Expand with TikTok ads
It is entirely possible to grow your TikTok audience extensively without ever paying a penny. However, if you do have a budget set aside and want to grow your following with ads, there are several graphs available with Minter.io that can help you keep track of how your ads are shaping your following. Graphs like the Ads Profile Visits graph in the Ads section of your Minter.io TikTok data shows you how many people are checking out your profile after seeing an ad. This provides a great opportunity to get new followers from your ads.
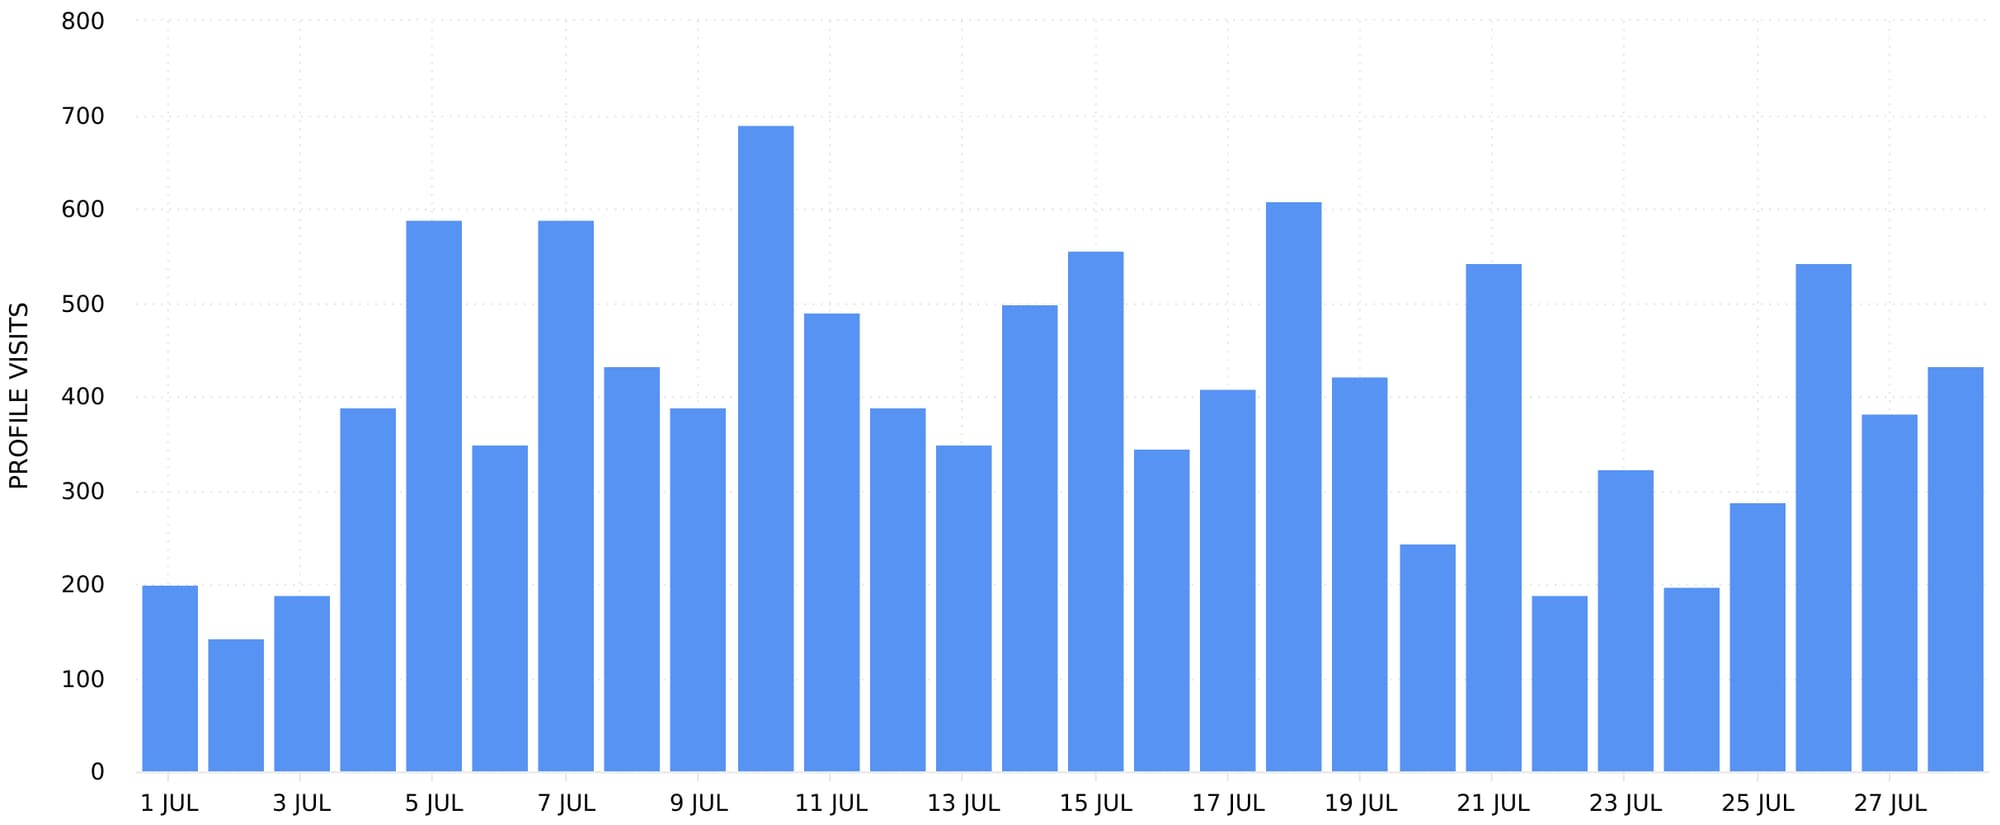
You can also view all your ads sorted by a specific metric. Choose to view your ads by Followers or Profile Visits for better insight into how your ads are impacting your TikTok follower count.
Get access to every graph in this article and so many more with Minter.io - the social media analytics tool for businesses online. Whether you’re looking to grow solely on TikTok or across your social media presence as a whole, you can unlock in-depth insights for TikTok, Instagram, Facebook, X, Threads and LinkedIn at the touch of a button. Explore your unique graphs now!
Try it today!