
How to know if your Instagram numbers are actually good (using Benchmarks)

Instagram analytics give you plenty of numbers to look at, but are your Instagram numbers actually good? Tracking social media metrics is vital for understanding profile and content performance on Instagram, but numbers on their own don't tell you whether your performance is any good. Without context, it’s easy to misread your results. A post with hundreds of likes might seem impressive, but if similar accounts are getting thousands, is your brand able to keep up with the competition? And if your reach rate is growing while your engagement rate is falling, you’ll want to know that too.
The best way to put your performance into context is to compare it using relevant benchmarks, and Minter.io has an entire section dedicated to viewing and comparing vital Instagram metrics with accounts of a similar size. Benchmarks show you how your Instagram metrics stack up against other accounts in the same cohort, so you can identify what’s working, where you’re falling behind, and which areas are worth focusing on.
Key Instagram metrics' benchmark graphs by Minter.io
Follower Growth by Month
The Follower Growth by Month graph shows the average follower growth compared with other Instagram accounts in your cohort. Your account is shown on the bar graph. If the bar representing your account is near or exceeding the upper bar, your follower growth is excellent in comparison with the other accounts in your cohort. Keep doing what you're doing. If it's around the median bar, consider your account as performing on par. Your follower growth is around the average for your cohort, so you're doing well but there's room for improvement. However, if your account is closer to the lower bar, this is definitely a metric to focus on and improve if you want to keep up with the competitors.
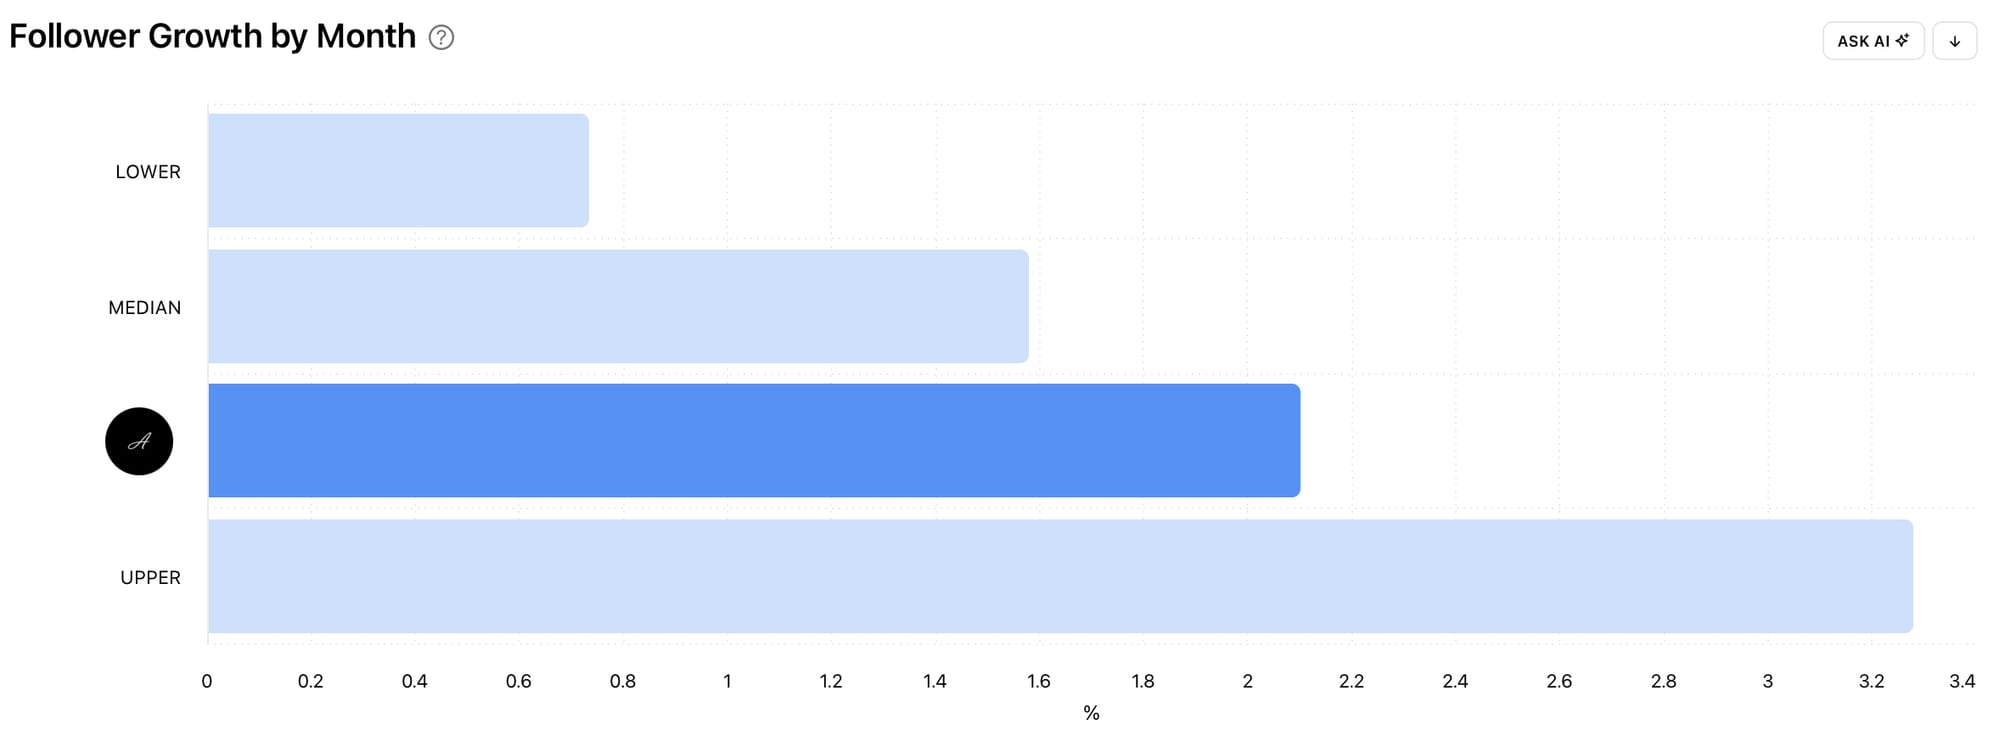
Benchmarking your monthly follower growth against other Instagram accounts in your cohort can give you a clearer picture of how effectively you’re building brand awareness. A growing follower count is positive, but putting the rate of your follower growth in context is substantially more useful. If your growth is consistently below the median or upper benchmark, look at the content, campaigns, collaborations and posting strategy you’re using to attract new followers. Gain inspiration by tracking your competitors with Minter.io or look closely at your top-performing content to influence follower growth.
Posts per Month
Posting frequency can have a big impact on how often your brand appears in users’ Instagram feeds, and with the Posts per Month benchmark graph by Minter.io, you can see how the amount of times you publish Instagram posts per month stacks up against Instagram profiles of a similar size. Are you posting more, less or an average amount in relation to your cohort and how can this be impacting your presence on Instagram?
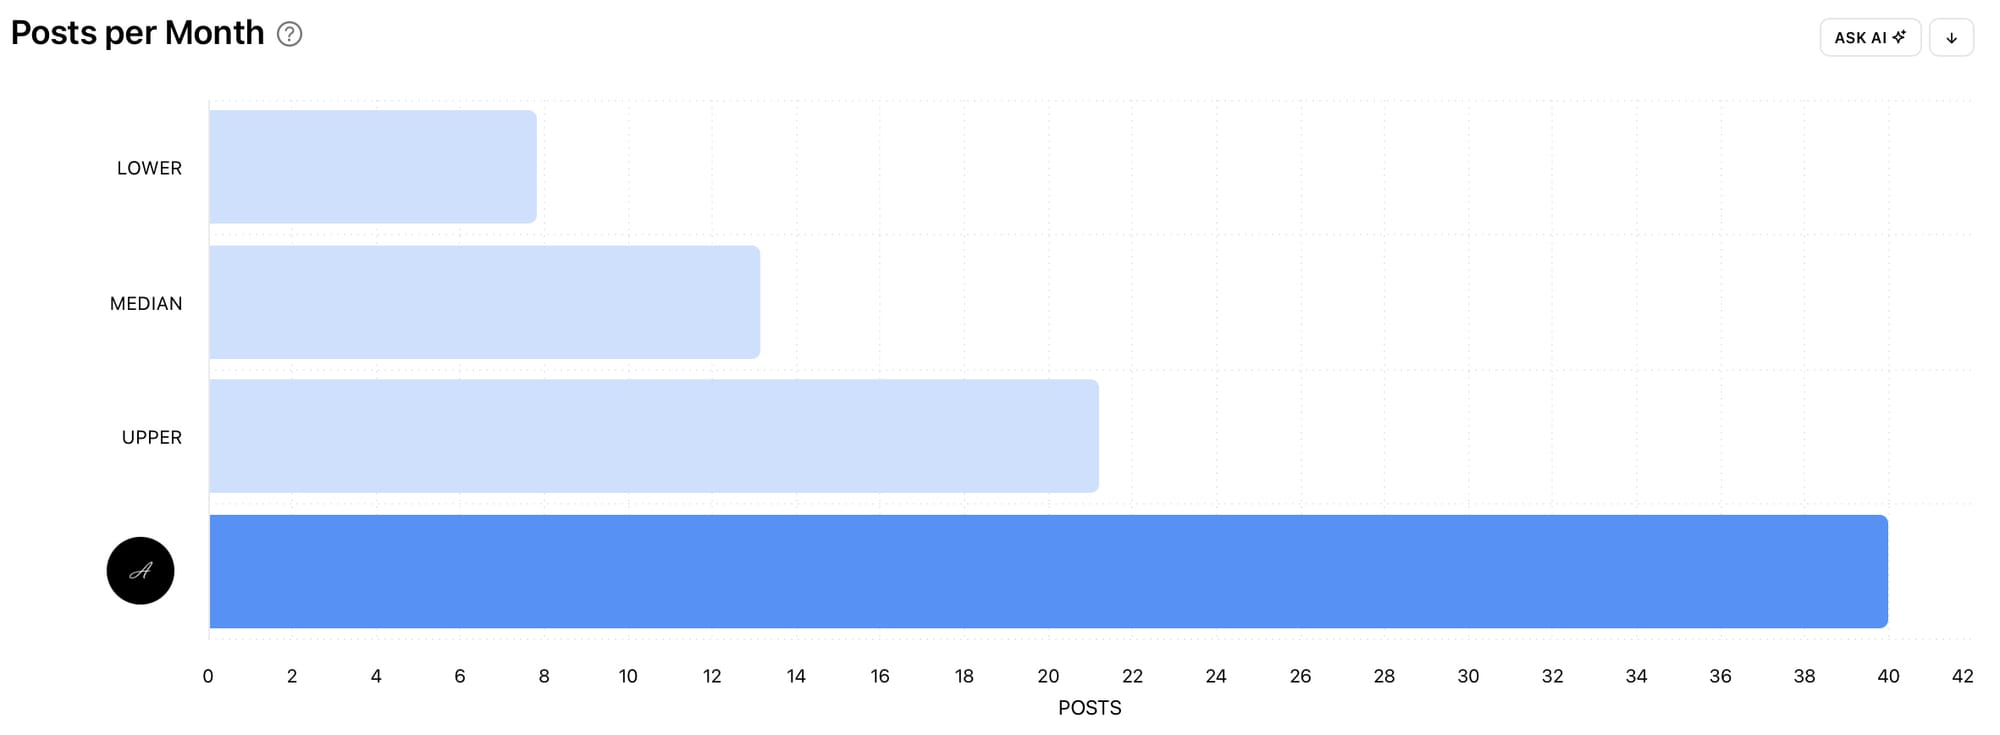
There’s no magic number of published Instagram posts that guarantees success. However, the Posts per Month benchmark graph can be used as a guide for understanding whether your account is relatively active compared with similar brands. If you’re posting considerably less than your cohort, ask whether you’re missing out on opportunities to reach your audience. If you’re posting significantly more, check whether that additional content is contributing to meaningful engagement and reach. The goal is to find a sustainable posting rhythm that gives you enough opportunity to connect with your audience.
Engagement Rate per Post
The Engagement Rate per Post graph measures how actively people interact with your content. Instagram engagement is calculated as the total amount of likes, comments, saves, shares and reposts on a post, divided by your follower count. Comparing this with other accounts in your cohort can help you understand whether your content is resonating well with your audience.
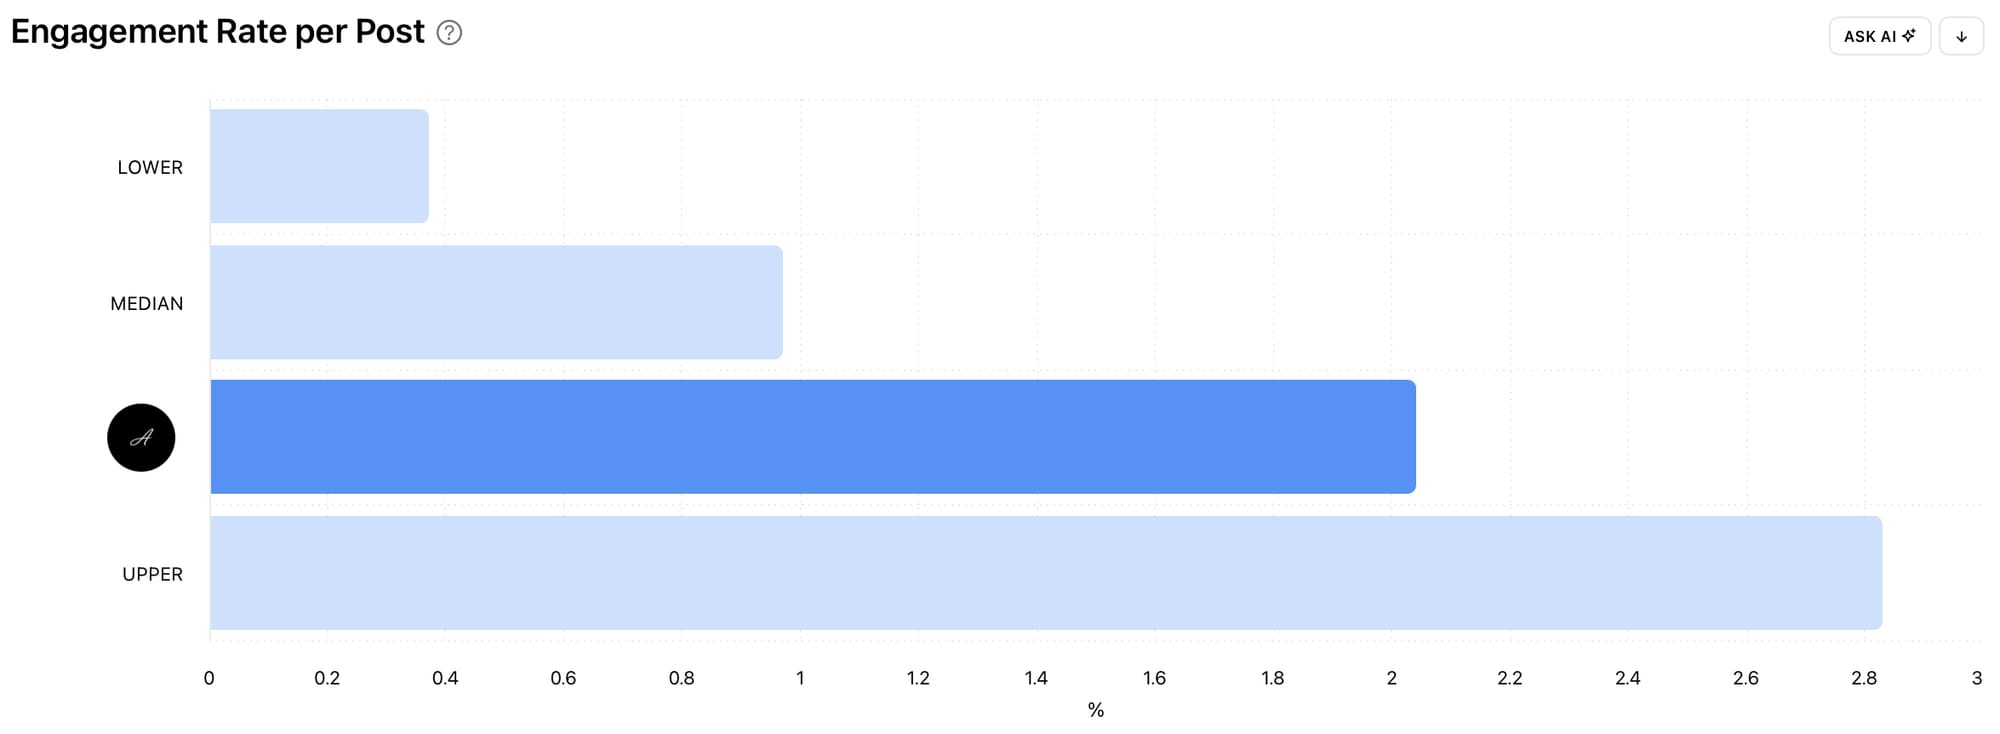
A high engagement rate generally suggests that the people seeing your content are finding it relevant enough to interact with. A lower rate means that fewer people are interacting per post, which can be a signal to experiment with different topics, formats, creative approaches or calls to action. Don’t look at the Engagement Rate per Post benchmark graph in isolation, though. A post can have a high engagement rate while reaching relatively few people. That’s why it’s useful to consider viewing the Engagement Rate per Post benchmark graph alongside the Reach Rate per Post and Follower Growth by Month benchmark graphs.
Reach Rate per Post
Reach Rate per Post tells you how widely your content is being seen relative to the size of your audience. It's calculated as unique accounts that saw a post, divided by your follower count, and it allows you to compare your content’s visibility with similar accounts.
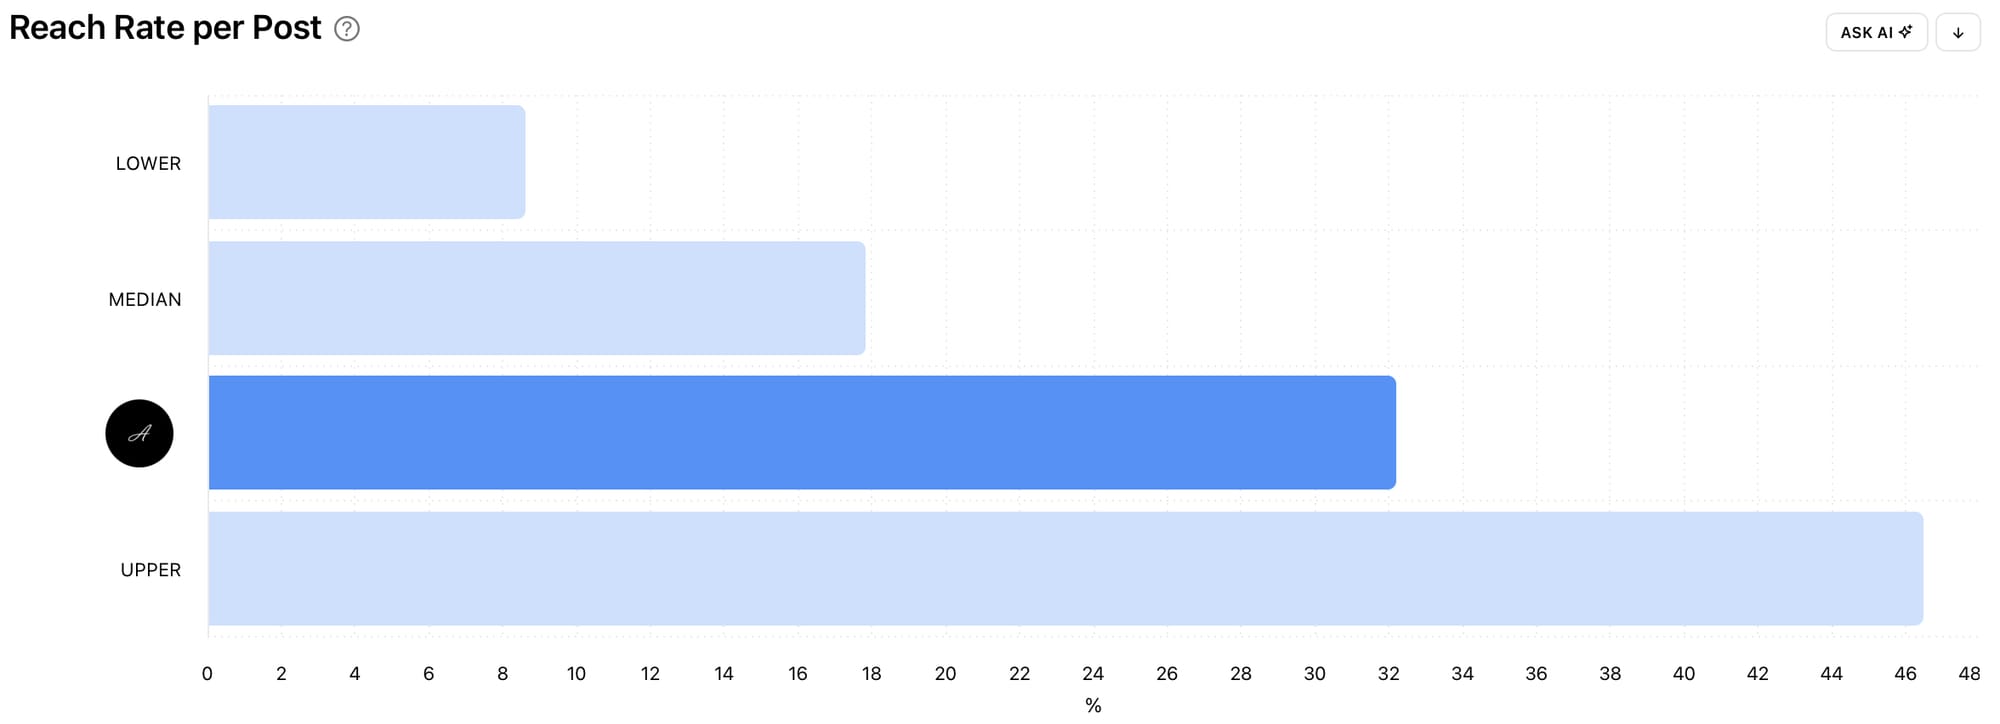
Reach is particularly useful for understanding brand awareness. If your reach rate is above the median or upper benchmarks, your content is getting in front of a relatively large proportion of your audience. If it’s below, you may want to explore ways to increase distribution. Look for patterns across your posts rather than judging performance from one post alone. Compare different formats, topics and creative styles to identify what consistently generates higher reach.
Likes per Post
Likes are one of Instagram’s simplest engagement signals. The Likes per Post benchmark graph shows the average number of likes your posts receive compared with other accounts in your cohort.
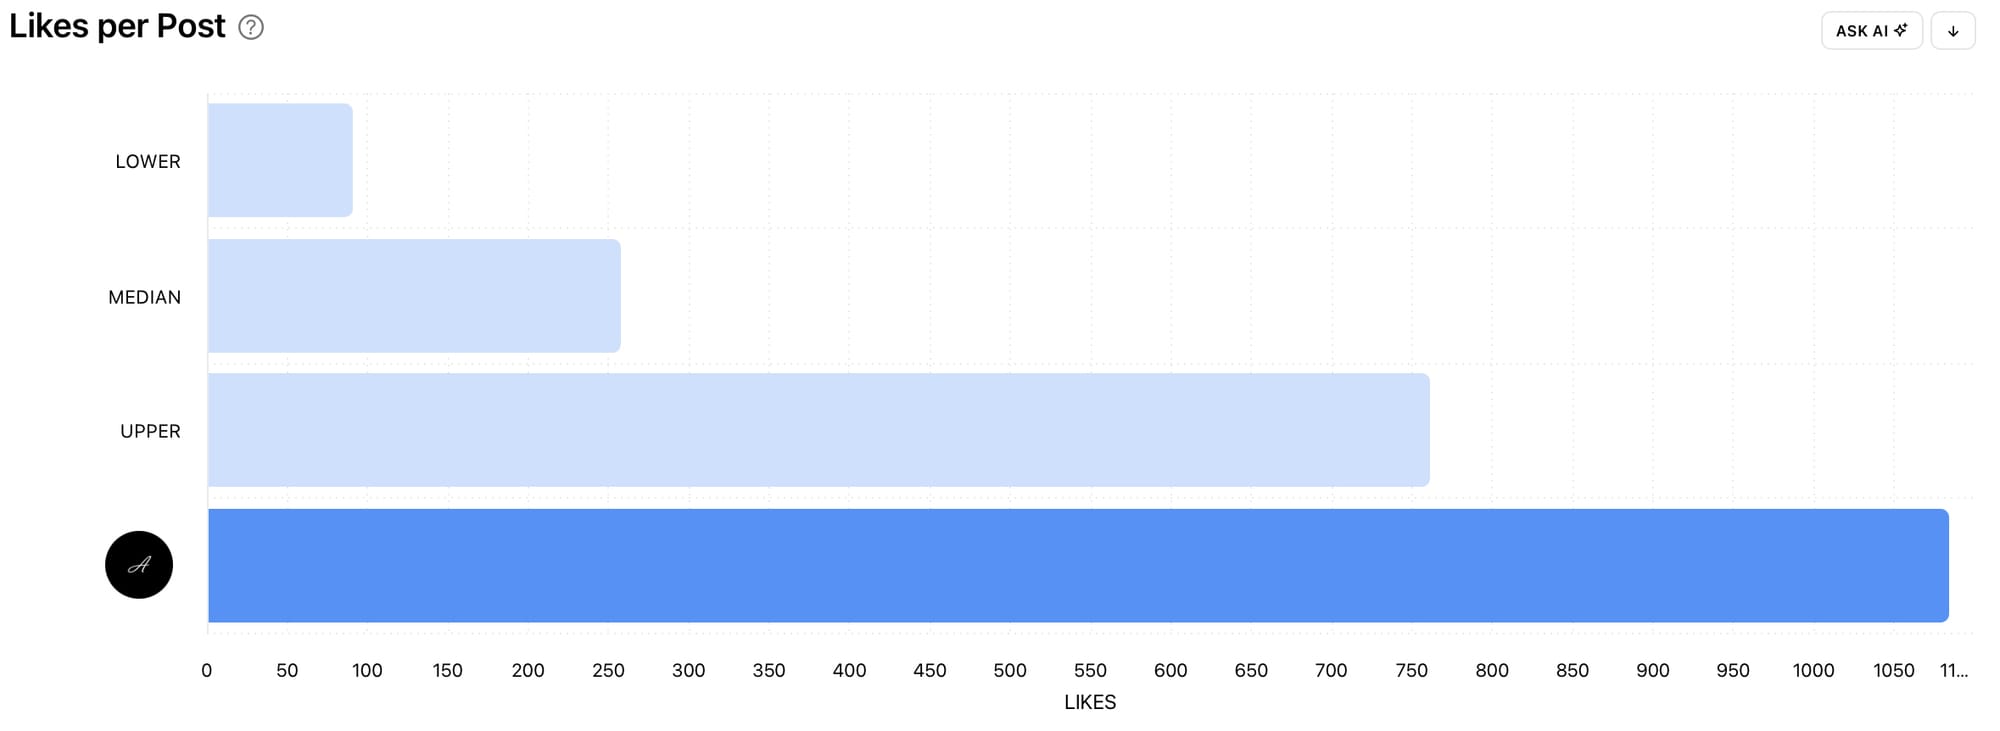
Comparing your average likes per post with accounts of a similar size gives you a much more meaningful view of performance than looking at your likes alone. Larger accounts will naturally tend to receive more likes, so comparing your numbers with brands that are considerably bigger or small than your brand on Instagram can make your results look better or worse than they really are. By benchmarking against accounts in the same follower-size cohort, you can see whether your content is generating more or fewer likes than similar accounts and identify whether there’s an opportunity to improve your content’s appeal.
Comments per Post
Comments indicate that your content is prompting people to actively respond rather than simply scroll past it. They require more participation than likes so are generally seen as a more valuable engagement metric. The Comments per Post benchmark graph shows the average number of comments per post in comparison with other Instagram accounts in your cohort. Comparing your average comments per post with other accounts can show whether your content is generating conversation.
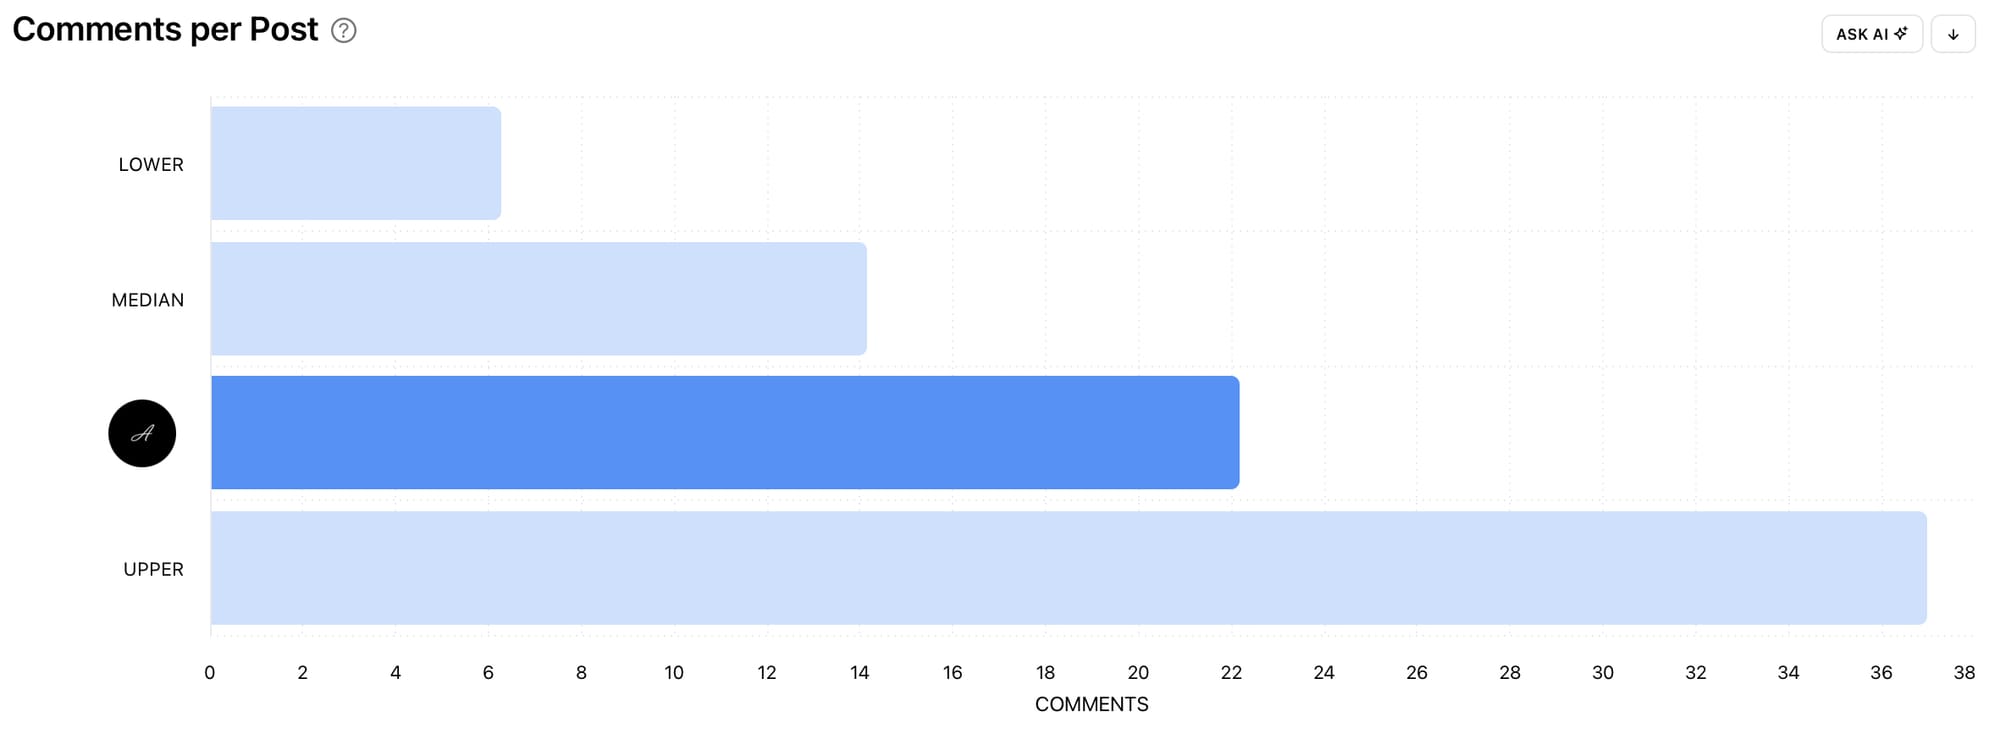
If comments are below the median benchmark, consider creating more opportunities for your audience to respond. Ask questions, invite opinions, encourage people to share their experiences, or create content around topics your audience cares about. Responding to comments can also keep conversations going and add to the engagement on your posts!
Stories per Month
Instagram Stories give you a way to stay visible between feed posts and share more informal, time-sensitive content. The Stories per Month benchmark graph shows the average number of Instagram Stories posts published each month by accounts in your cohort.
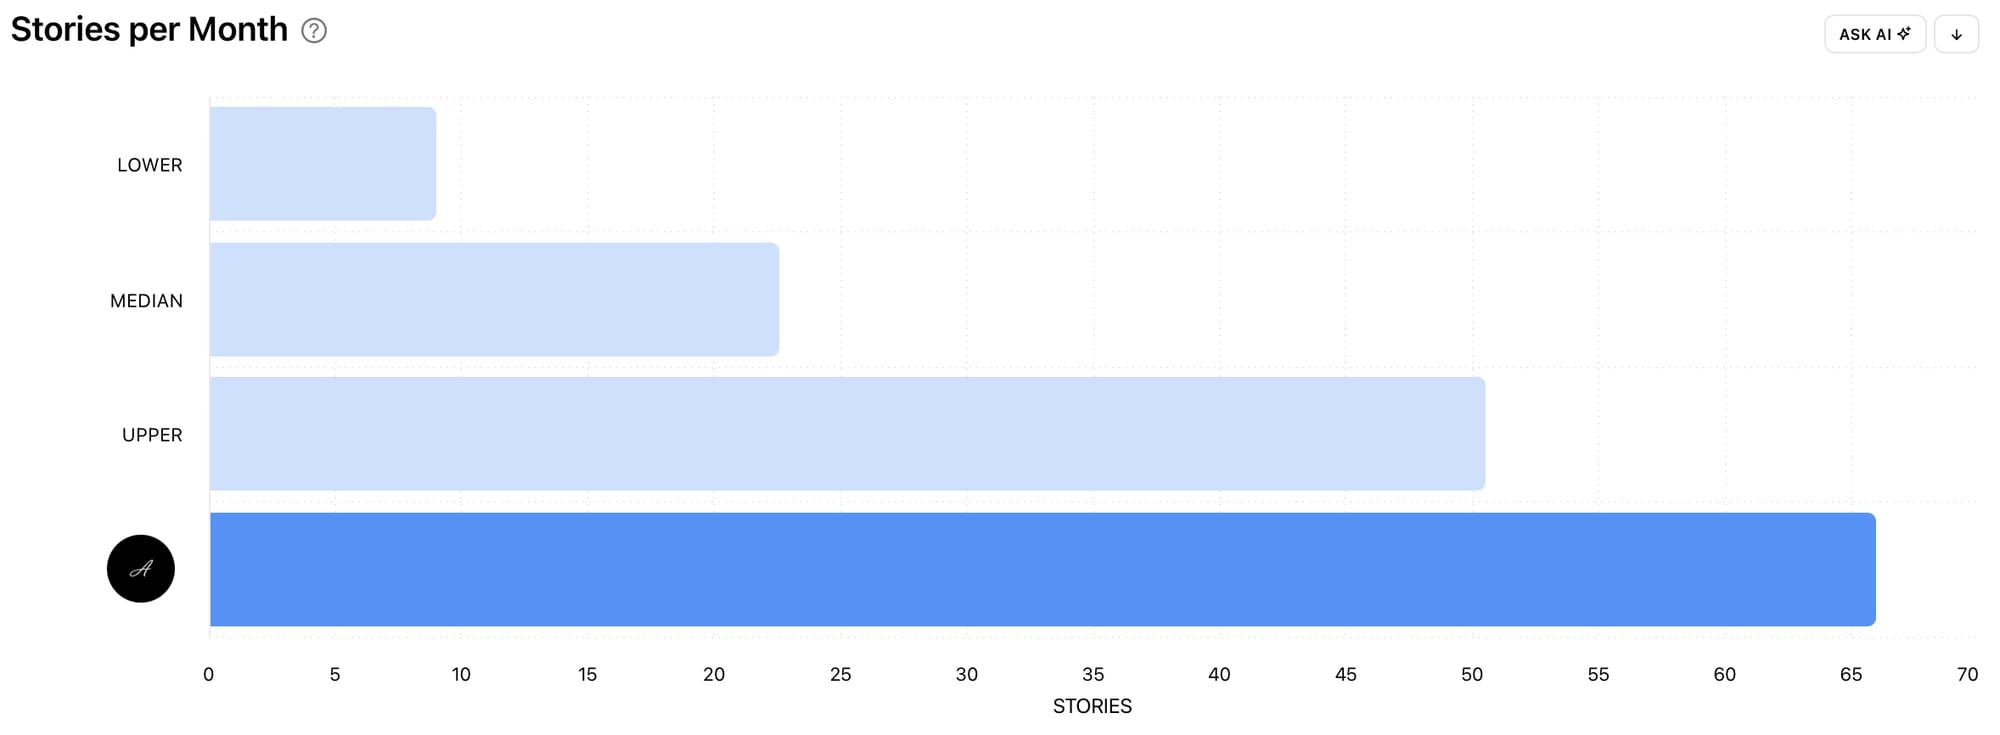
If you publish Instagram Stories posts less often than other accounts in your cohort, there may be an opportunity to use them more strategically to keep your audience engaged. Because Instagram Stories posts disappear after 24 hours, they can be a useful place to experiment and show a different side of your brand. Try sharing behind-the-scenes content, product updates, polls, questions, user-generated content or quick tips.
Reach Rate per Story
Reach Rate per Story calculates the unique accounts that saw an individual story, divided by your follower count. Comparing it with your cohort shows how much of your audience your stories are actually reaching.
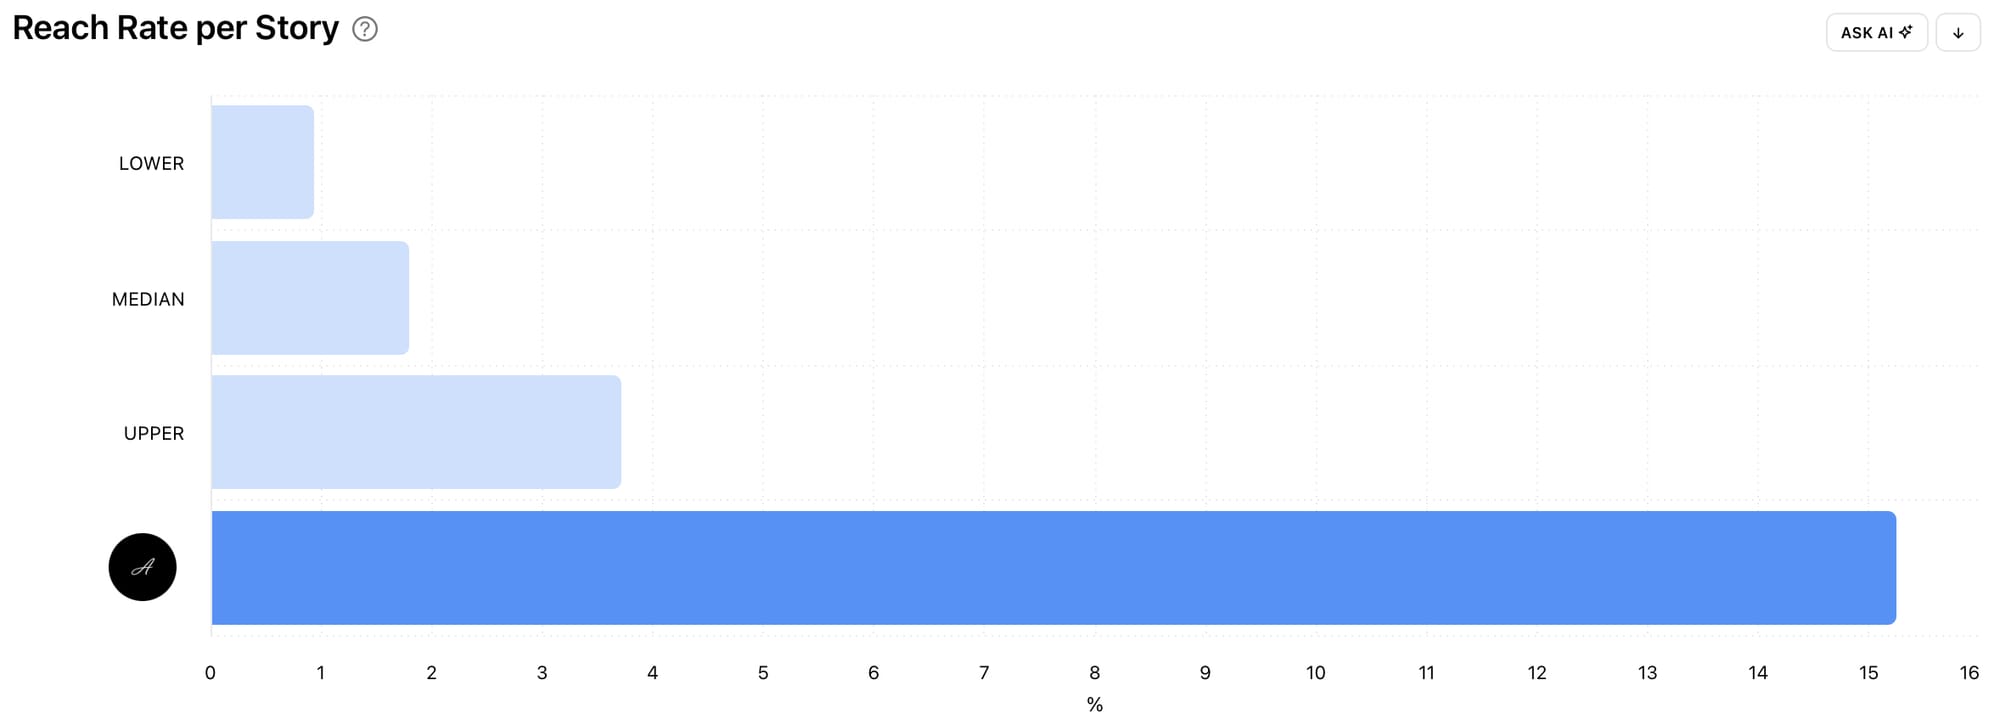
A strong story reach rate means a relatively high proportion of your audience is seeing your content. A lower rate could be a reason to experiment with different story formats, posting times and topics.
View your competitors' benchmarks with Minter.io
Fancy a peak at how a specific competitor benchmarks? With Minter.io, you can view your competitors’ Instagram benchmarks and compare their performance with your own. See where your competitor benchmarks across key metrics such as follower growth, posting frequency, engagement, reach, likes and comments, giving you a clearer picture of how they’re performing, where you’re ahead and where there may be opportunities to take strategic steps to get ahead.
How to use Instagram benchmarks on Minter.io
Benchmarks aren’t a pass-or-fail test. They’re a starting point for understanding your performance in comparison with accounts of a similar size. If one metric is below the upper or median benchmark, don’t immediately assume your strategy isn’t working. Look at your other metrics and consider your wider goals. For example, strong follower growth alongside lower engagement could tell a very different story from low follower growth and consistently high engagement.
The most useful approach is to:
- Compare your performance with your cohort. See where you’re above or below the median benchmark.
- Check your benchmark graphs regularly. As your Instagram presence evolves, and as you enter different cohort sizes, your benchmark positions will change. Make checking your benchmark graphs a consistent part of building your Instagram strategy.
- Identify your biggest gaps. Focus on the metrics where there’s the clearest opportunity to improve.
- Look for connections between metrics. Changes in posting frequency, reach and engagement can influence each other.
- Use benchmarks to inform experiments. Test new content formats, topics and posting times, then see how your results change.
Use Instagram Benchmarks to understand where you’re ahead, where there’s room to grow, and which metrics deserve your attention next. Explore your Instagram benchmark graphs with Minter.io now.