How to get more views on Instagram using analytics
We all want more views on social media because more views means more opportunities to build an audience, create connections, get followers, grow brand awareness and make sales. But how can you get more views if you don’t know what is working for your brand? Tracking your views takes the guesswork out of how you’re getting them, and at Minter.io we present a wide range of views graphs to assist in your efforts to grow online. By the end of this article, you will have the information needed to take informed steps towards getting more views on your Instagram profile, posts, stories and ads.
What counts as a view?
Views measures the amount of times content is seen, regardless of whether someone is looking at it for the first time or not. It is the total amount of times content is viewed and therefore takes into account multiple views from the same account.
Post Views
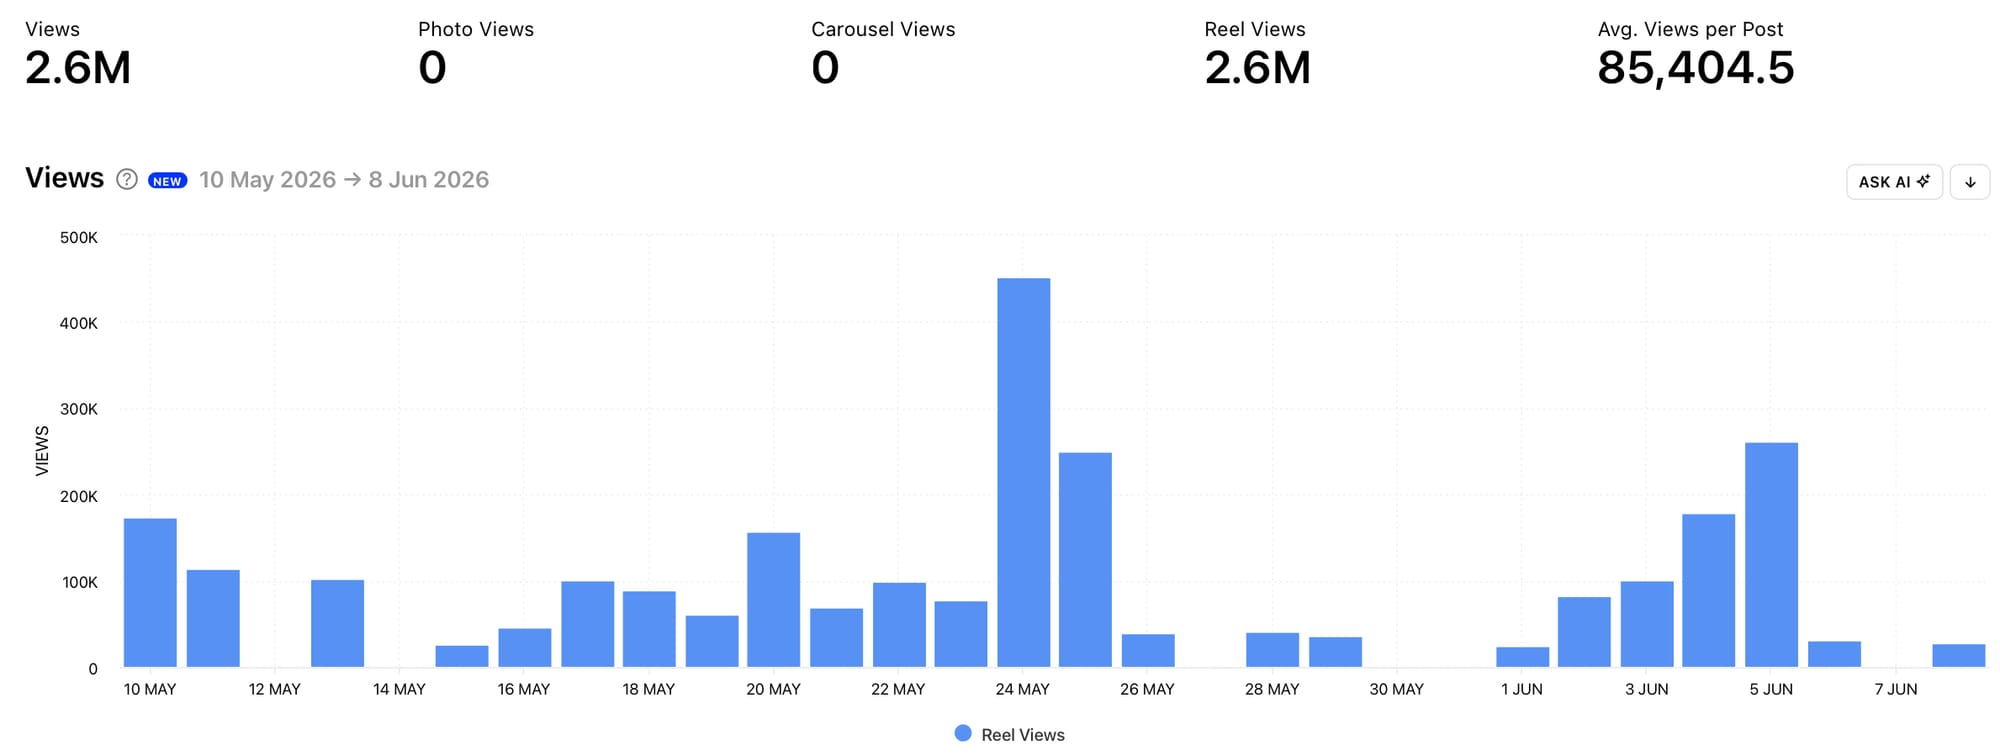
To track the amount of views on your grid, look no further than the Post Views graph; you can find it in the Posts section of your Minter.io Instagram data. The Post Views graph shows the number of times posts published within the selected date range were seen. It is split into post types. Above the graph is the total amount of views, the total amount of views from each content type and the average amount of views per post. This makes pinpointing the post types that bring in the most views easy.
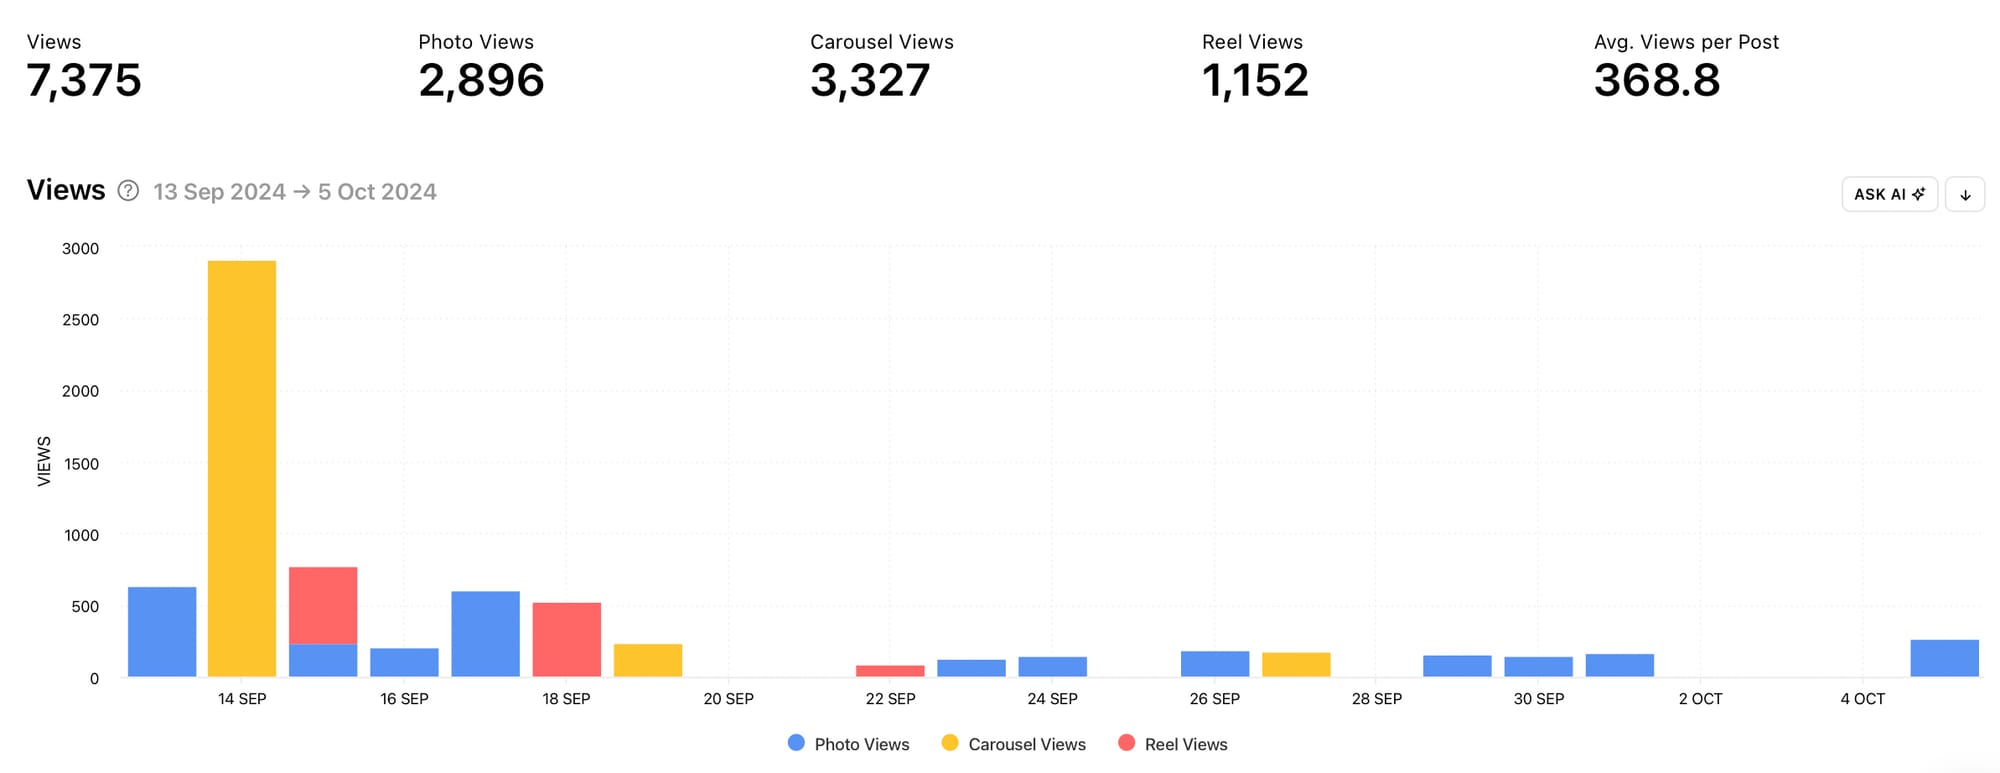
Which content type is pulling in the most views for your brand? Consider making more content in that format to increase your overall views. Look for peaks in the data. What did you do differently on the days that resulted in more views? Did you post several pieces of content in one day or did a particular post perform exceptionally well? Consider taking similar action in the future. Also note dips in the data. What sparked the drop in views? Use this information to avoid actions that have an adverse impact on the amount of views your posts gain.
Consider using the Views graph in conjunction with the Reach graph to determine how many views came from unique accounts and how many views were repeat views. Reach measures the amount of unique accounts that viewed your content, so by using these two graphs together you can get a clearer picture of whether people returned to view your content multiple times.
Sort Posts by Views
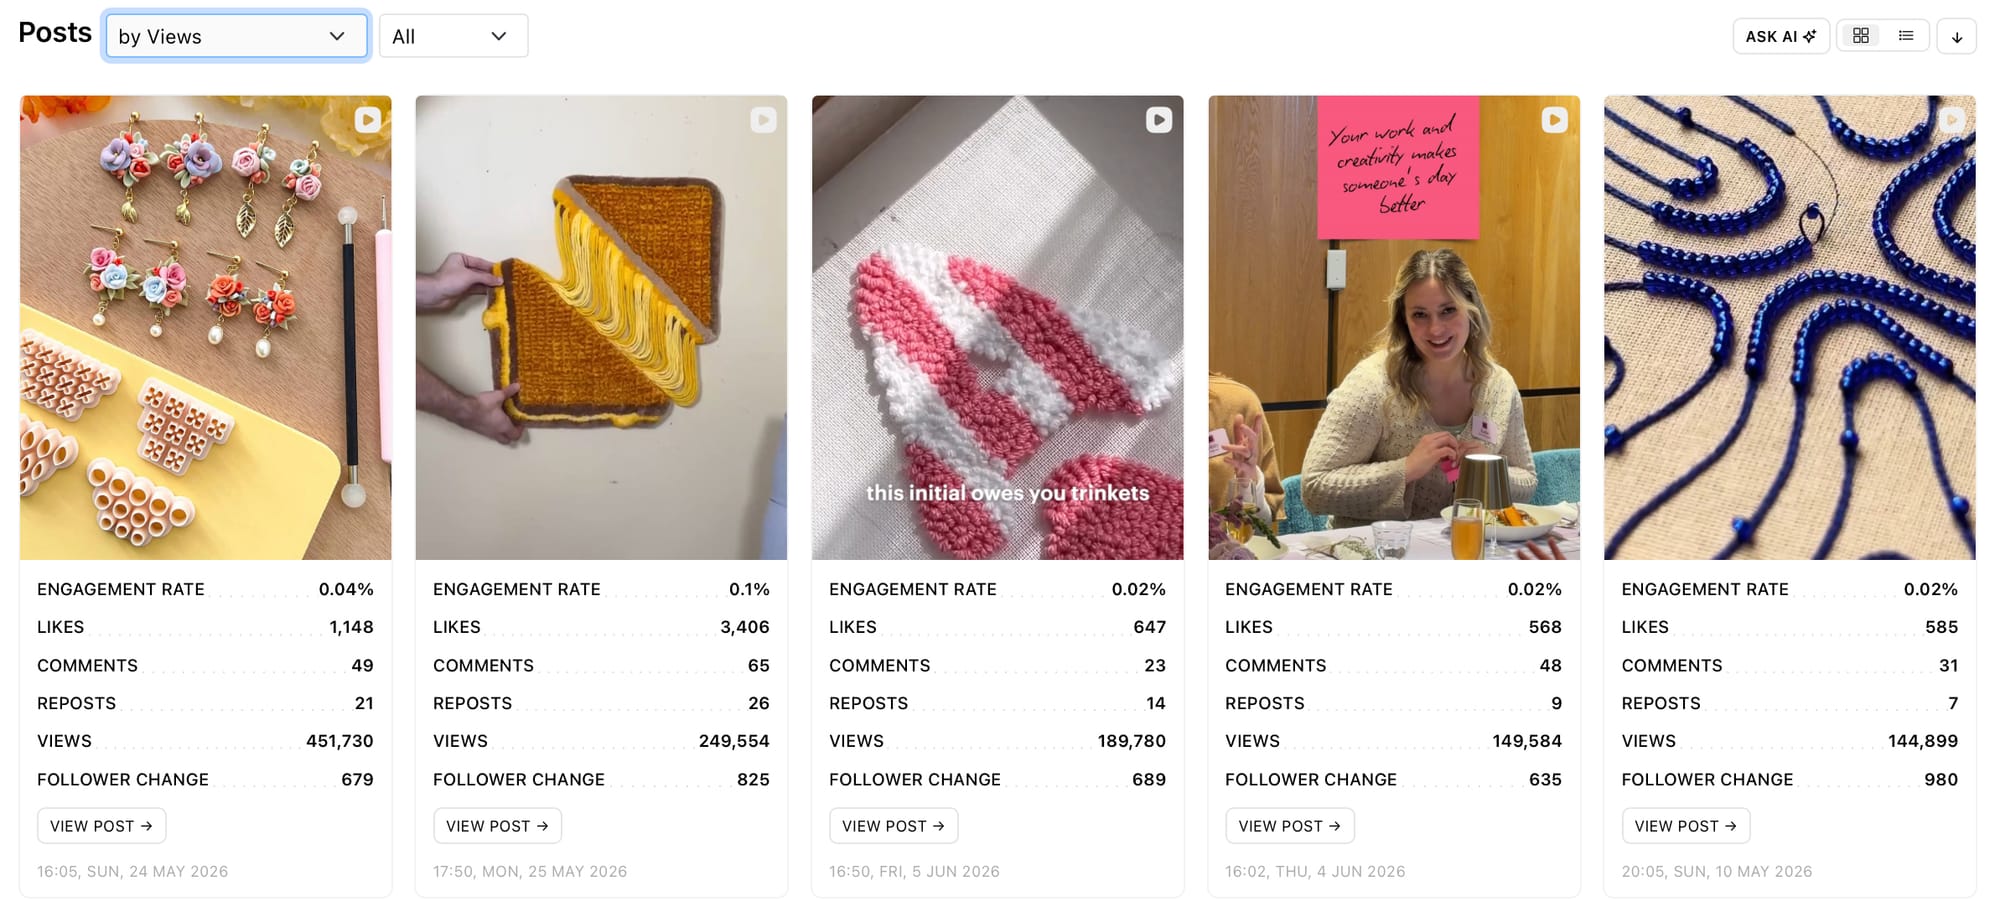
Finding out exactly which of your posts raked in the most views is a tremendous way to come up with new content that is likely to get you a load more views. Head to the All Posts section of your Minter.io Instagram data to sort your posts by views. This will order all your posts published within the selected date range from the highest amount of views to the lowest. Choose to sort all your posts or a specific post type. Hover over the views amount on promoted posts to see the split between paid and organic views.
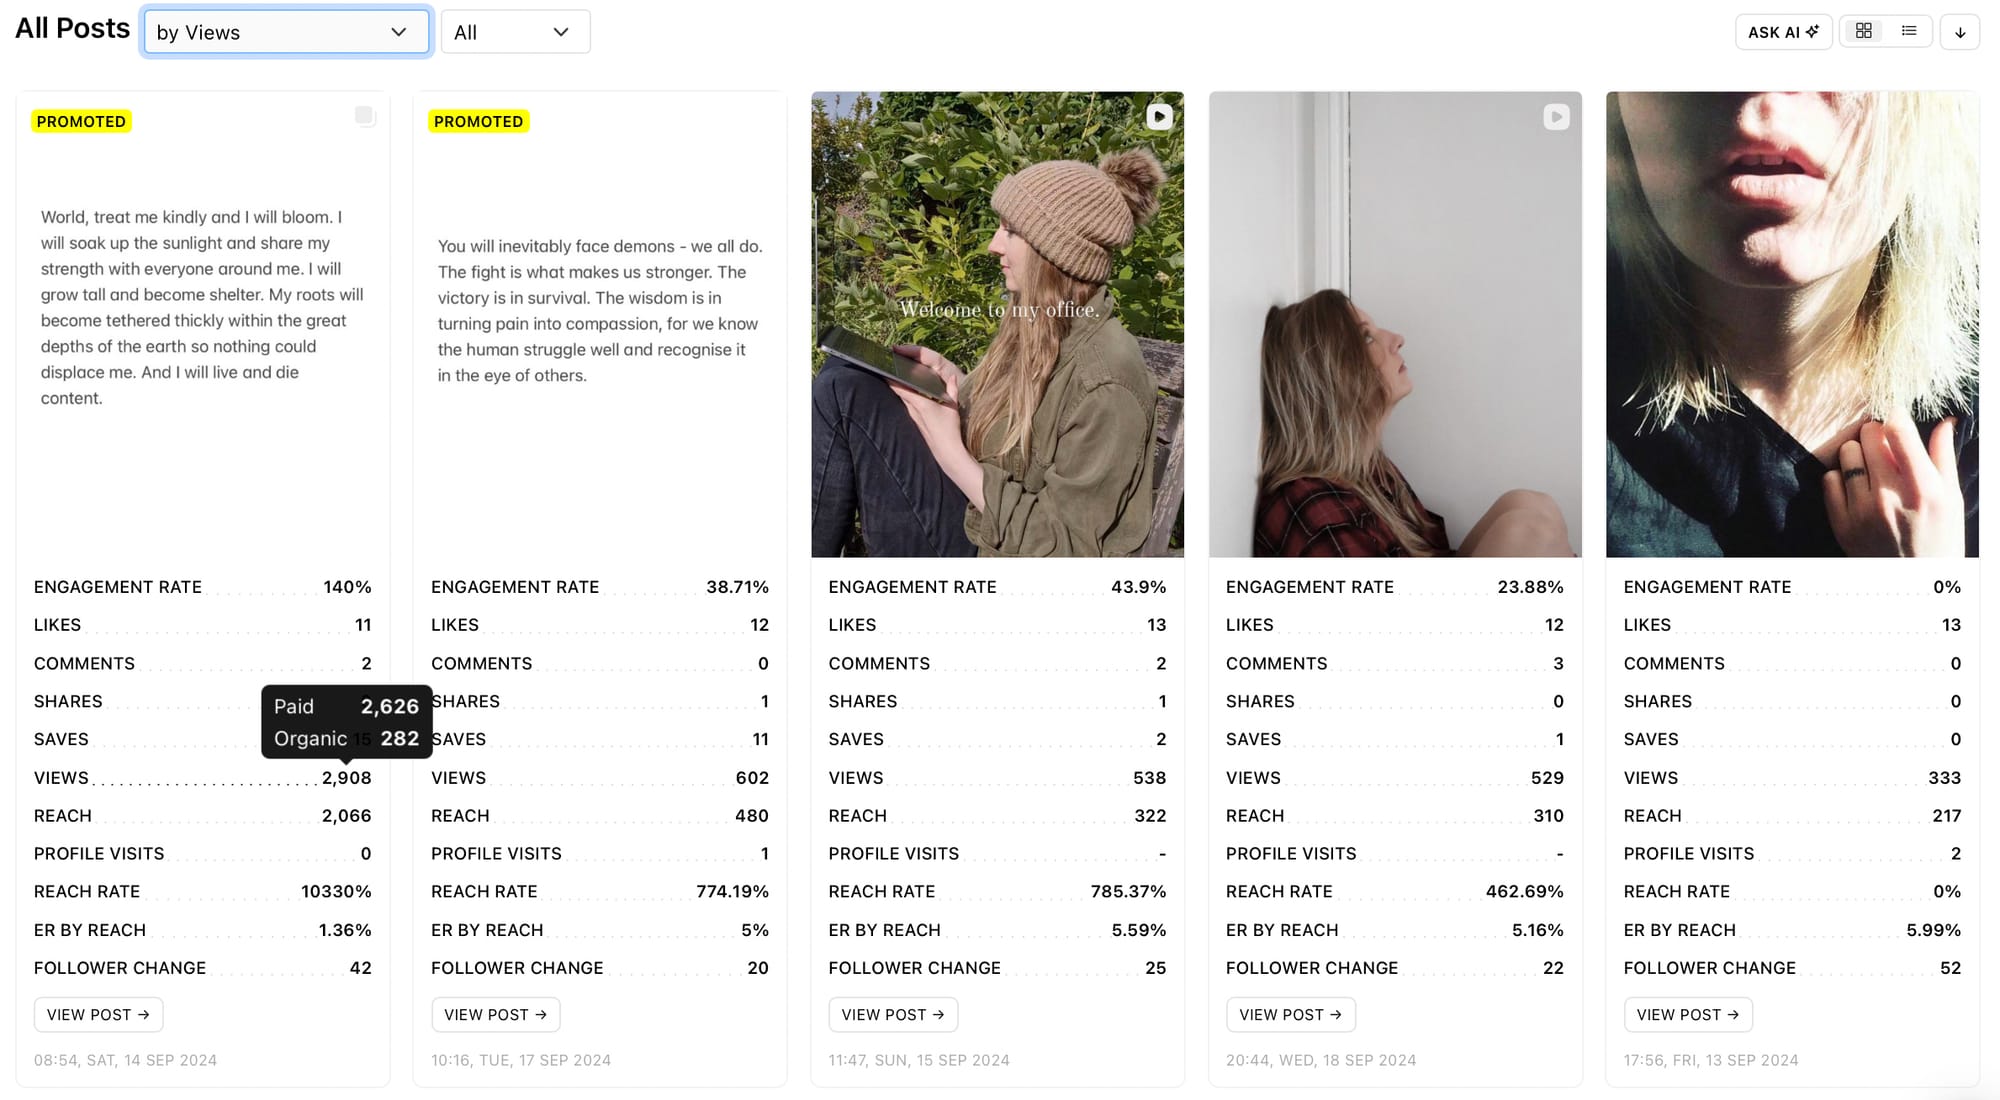
By finding your top-performing posts by views, you can spot similarities in the posts that gained the most views. Are the top posts all the same post type? Consider the topics, hooks, editing styles, colours, sounds, fonts, captions, hashtag use etc. Are there similar threads across the most-viewed content? If so, use similar formulas in upcoming content to encourage more views.
Post Views 72h
Select a post to discover exactly when views rolled in within the first 72 hours. The Views 72h graph shows the distribution of views the post received in the first 72 hours by hour. This can give you a better idea of how soon people viewed your content and how the algorithm interacted with the piece of content.
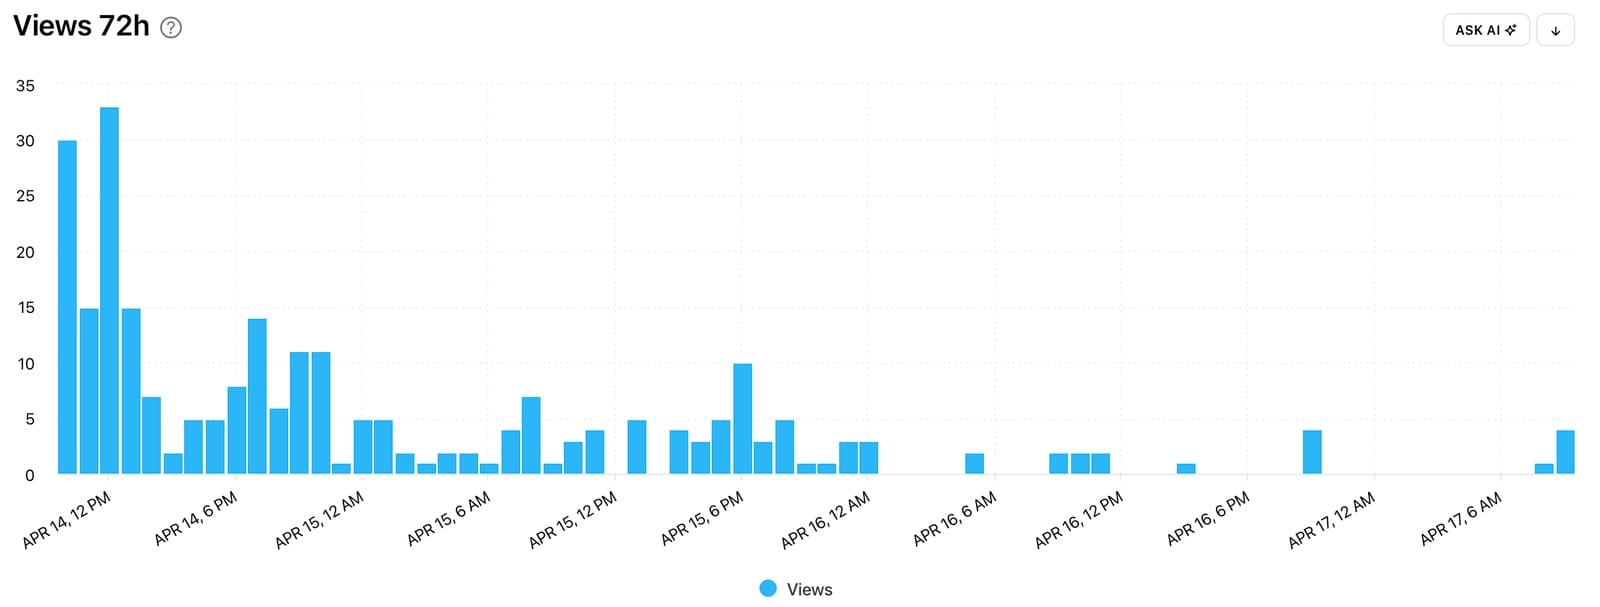
Did views peak early on, steadily build or remain consistent throughout the first 72 hours? Try creating similar content for a similar response early in the life cycle of your content.
Consider using the Views 72h graph in conjunction with the Best Time to post graph in the Optimisation section of your Minter.io Instagram data. See whether posting at an optimal time for your brand impacts how many views your content gains early on.
Stories Views
Instagram Stories posts are ideal for nurturing online connections, but you can only do that if people are viewing your stories. Head to the Stories section of your Minter.io Instagram data to find the Views graph for your stories. The Stories Views graph shows the number of times stories were seen during the selected date range. The data is split into photos and video views so you can easily see which content type brought in views on which days. Above the graph is the total amount of views within the selected date range as well as the average amount of views.
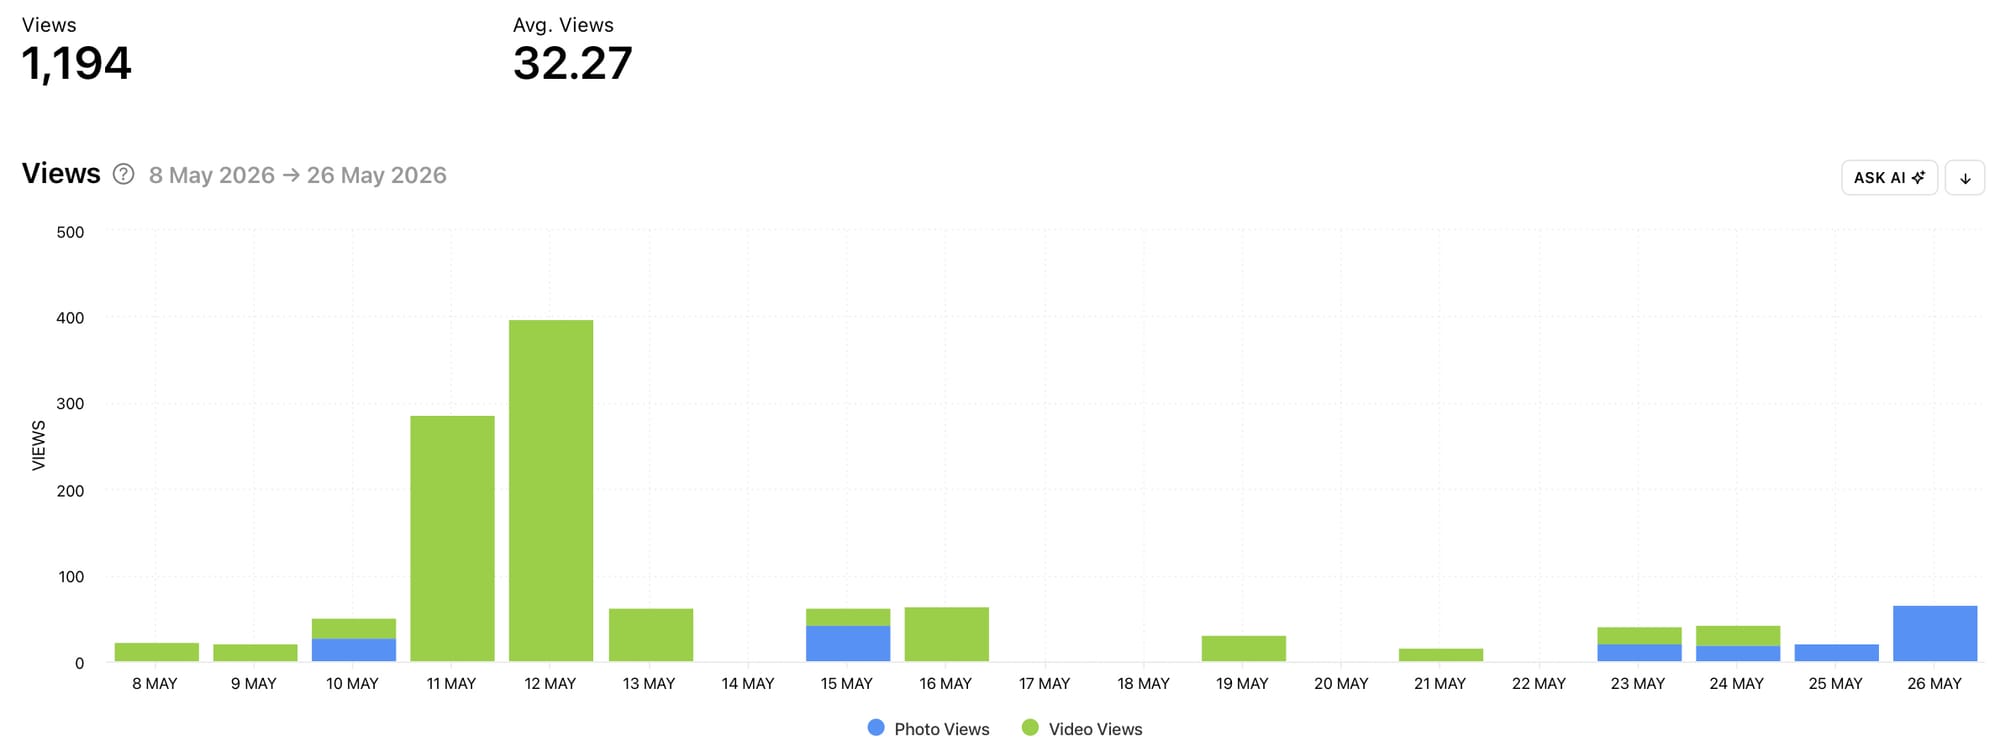
Did photos or videos gain the highest amount of views for your brand on Instagram? Consider whether this was due to posting more of that type of content or whether that content type simply outperformed the other on your account. Notice any spikes in the data. Did these peaks occur due to posting more or did a particular story post get viewed more than usual? Replicate similar ideas to encourage more views on upcoming Instagram Stories content.
Sort Stories by Views
Gather ideas specifically with the goal to get more views by sorting all your Instagram Stories posts by views. Head to the All Stories section of your Minter.io Instagram data to do this. This section will sort all your Instagram Stories posts by your chosen metric from highest to lowest. Choose to view all your Instagram Stories posts or specifically look at images or videos.
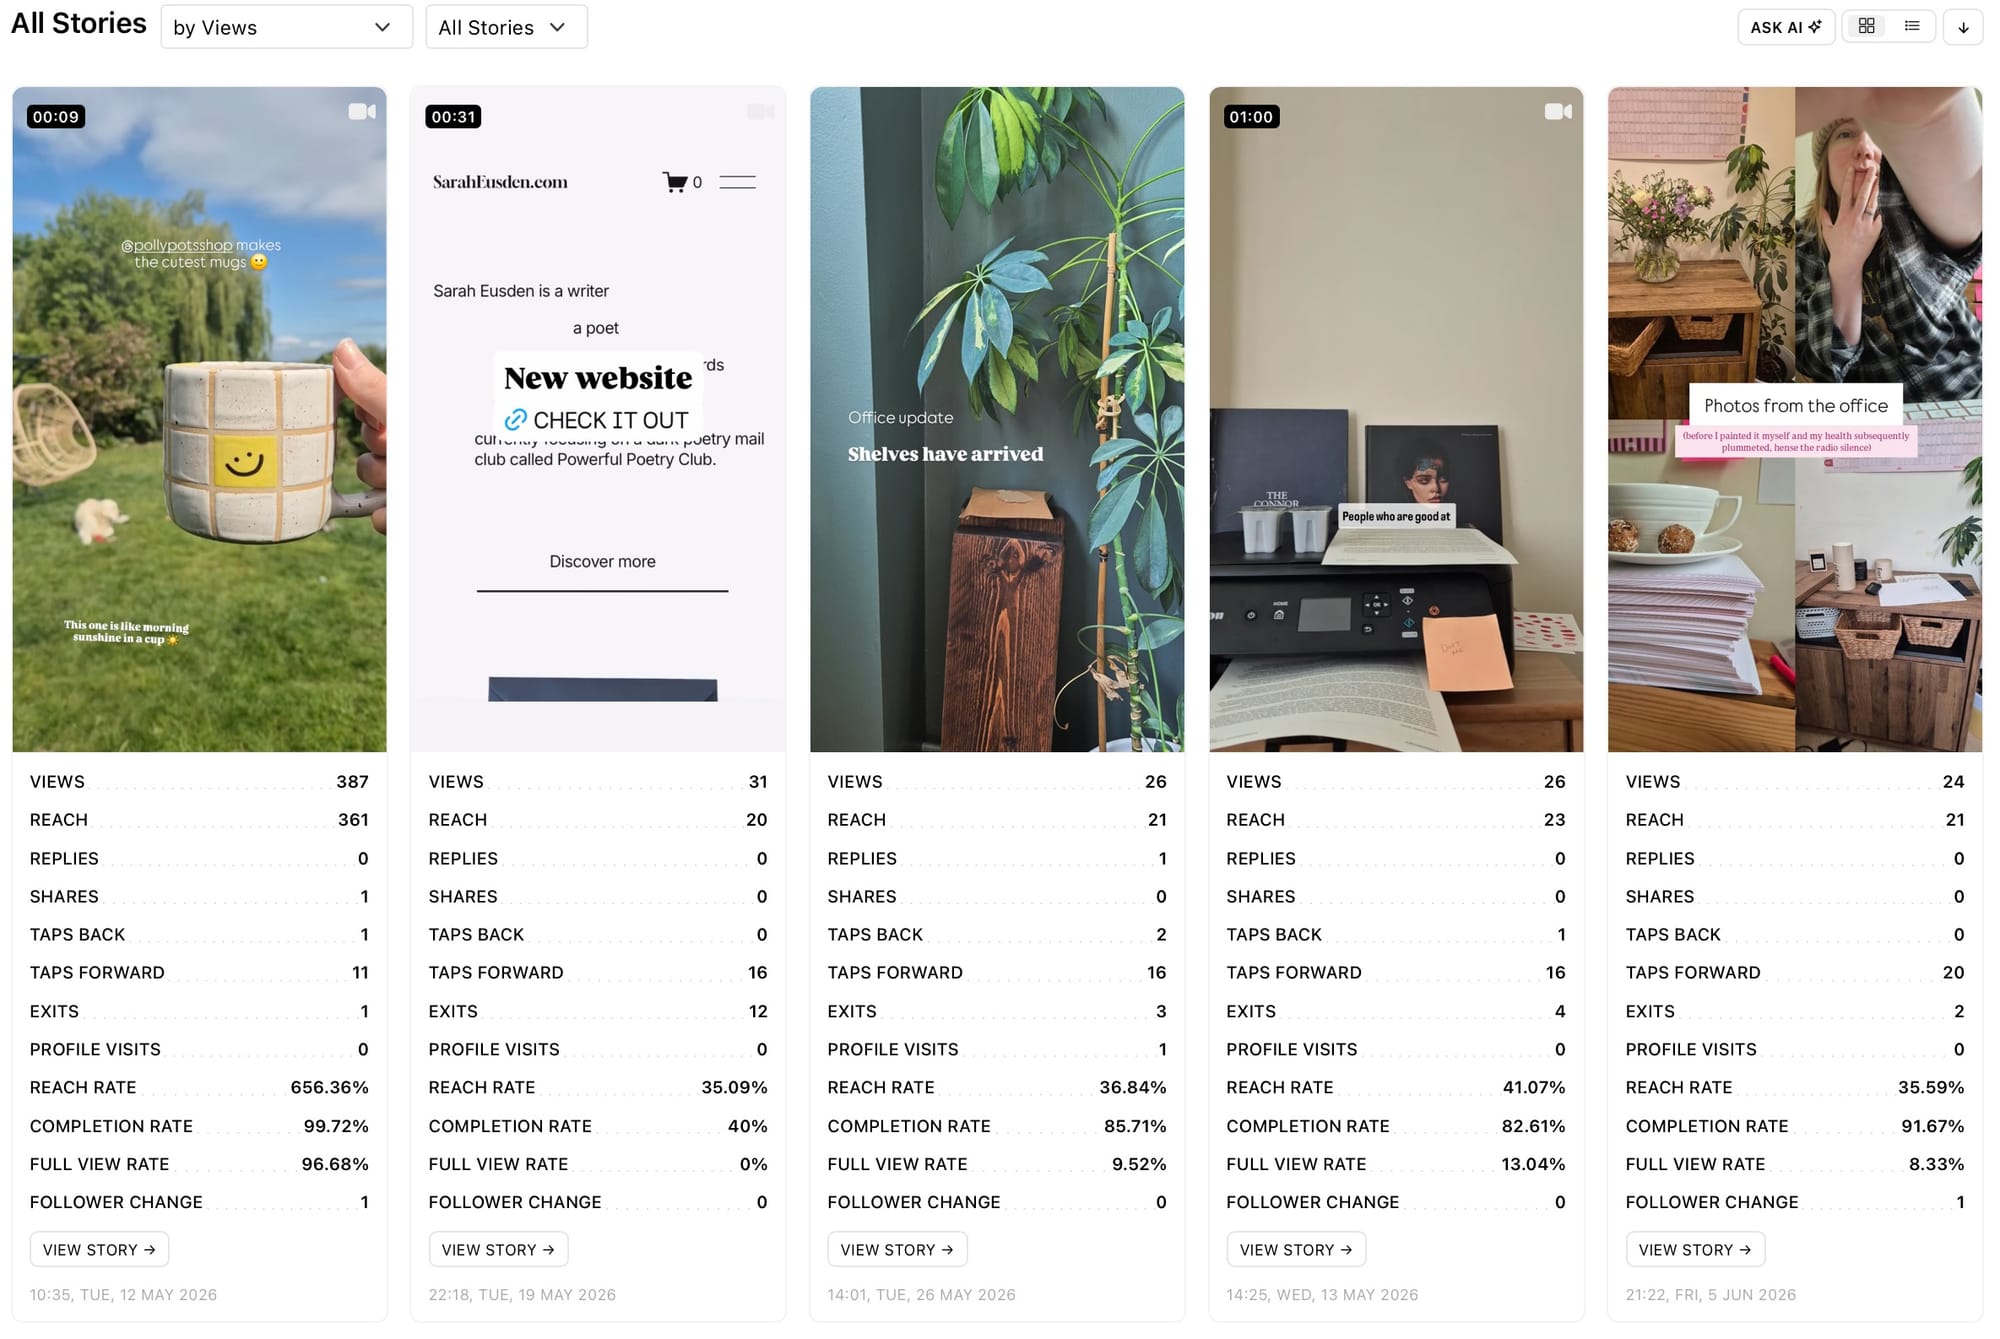
Did you do anything differently in your most-viewed stories? Consider whether you tagged another account, used interactive stickers, spoke to camera or reposted content from your feed or other accounts. Consider the topics, editing styles, caption use, fonts and colours. Do your most-viewed stories have similarities or are there a few standout stories to draw inspiration from? Replicate the elements in the highest-viewed stories to create new content with the aim to get more views.
Stories Views 24h
Select an Instagram Stories post to discover exactly when views rolled in. The Stories 24h graph shows the distribution of views the post received during its life cycle (as Stories posts only stick around for 24 hours unless they’re added to a highlight). This can give you a better idea of when people viewed a story during the day.
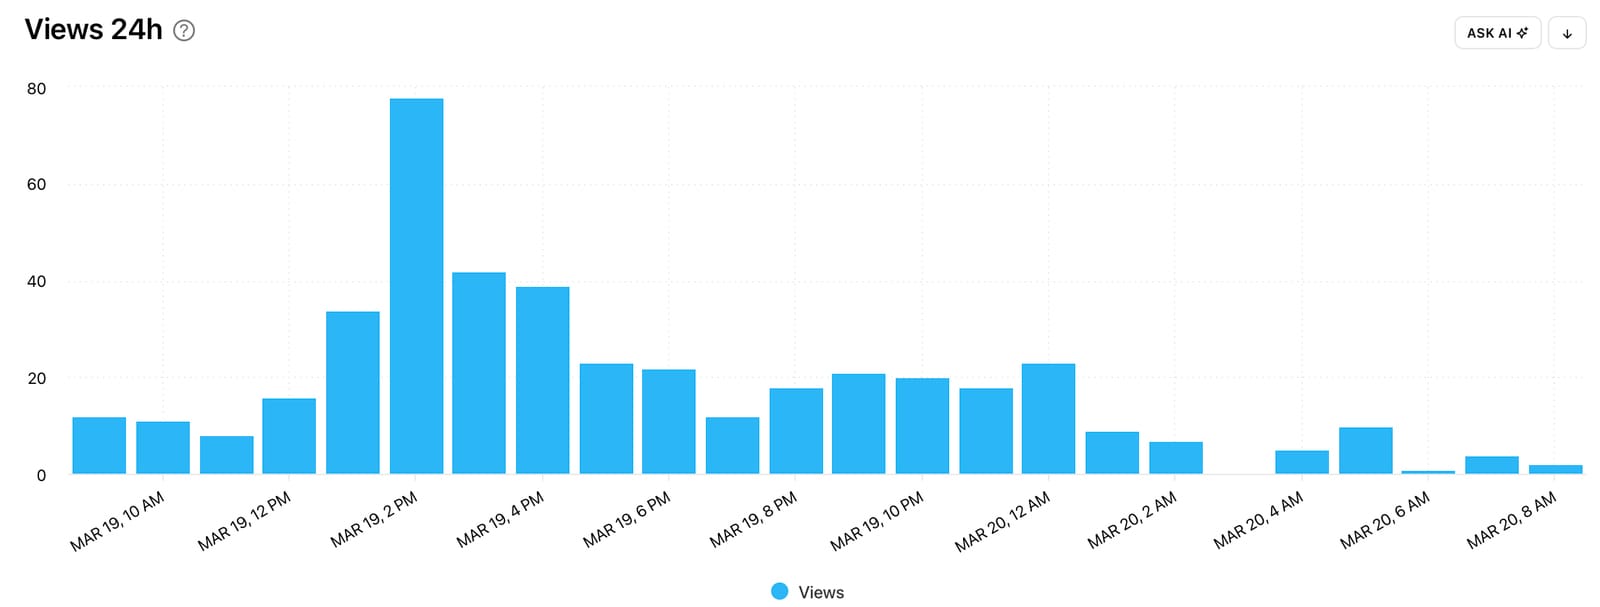
Did views peak early on, build over time or remain consistent and what could have impacted this? Were there any lulls in views and did they pick up again? Consider how this graph looks for your highest-viewed content, and try creating similar content for similar results.
Ad Video Views
Head to the Ads section of your Minter.io Instagram data to discover the Ad Video Views graph. This graph shows the number of times Ad Videos were viewed during the selected date range.
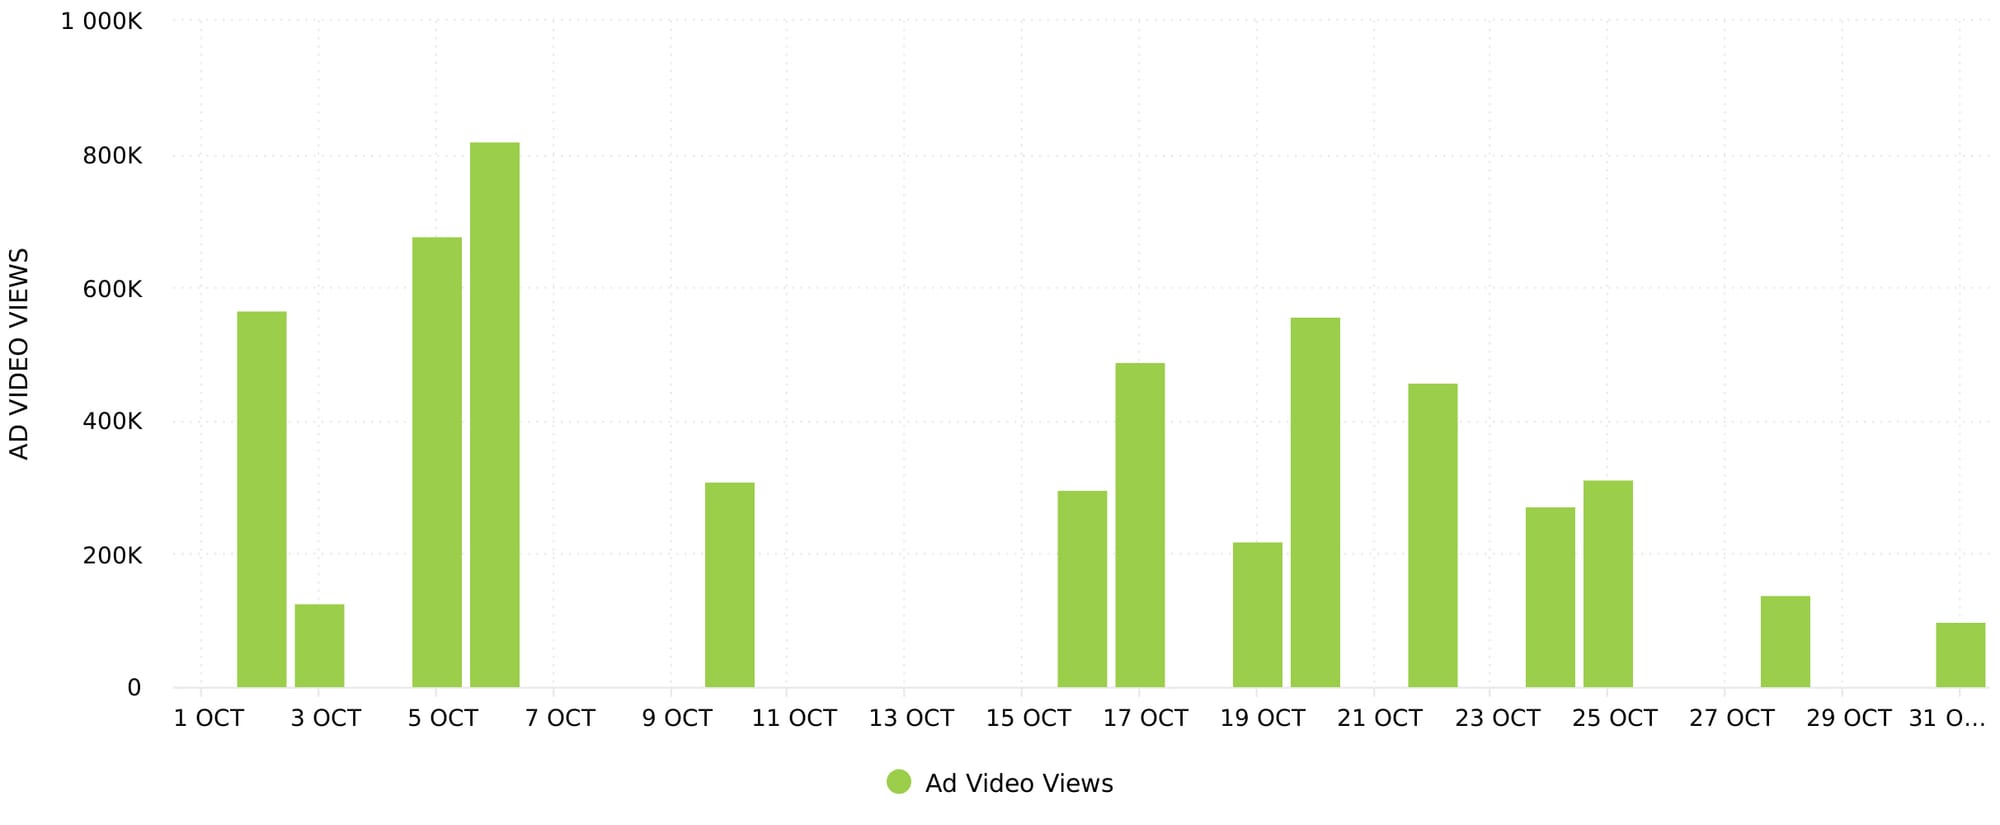
Look at your ad views data and notice any spikes or dips. Consider what may have caused the outliers. Were there fluctuations in the budget, multiple ads actioned at once or were your ads shared independently by viewers? Notice which ads were active during the peaks in data and use the most-viewed ads to determine your approach in creating and sharing new ads and campaigns.
Profile Views
For an overarching perspective of the amount of views your account is pulling in, head to the Profile section of your Minter.io Instagram data. Here you will find the Profile Views graph which shows the number of times posts, stories and promotions were viewed during the selected date range. The data is split into followers and non-followers so you can understand where your views are coming from. This gives some insight into how the algorithm is serving up your content and how much of your committed audience is viewing your content. Above the graph is the total amount of views, the maximum amount of views and the average views.
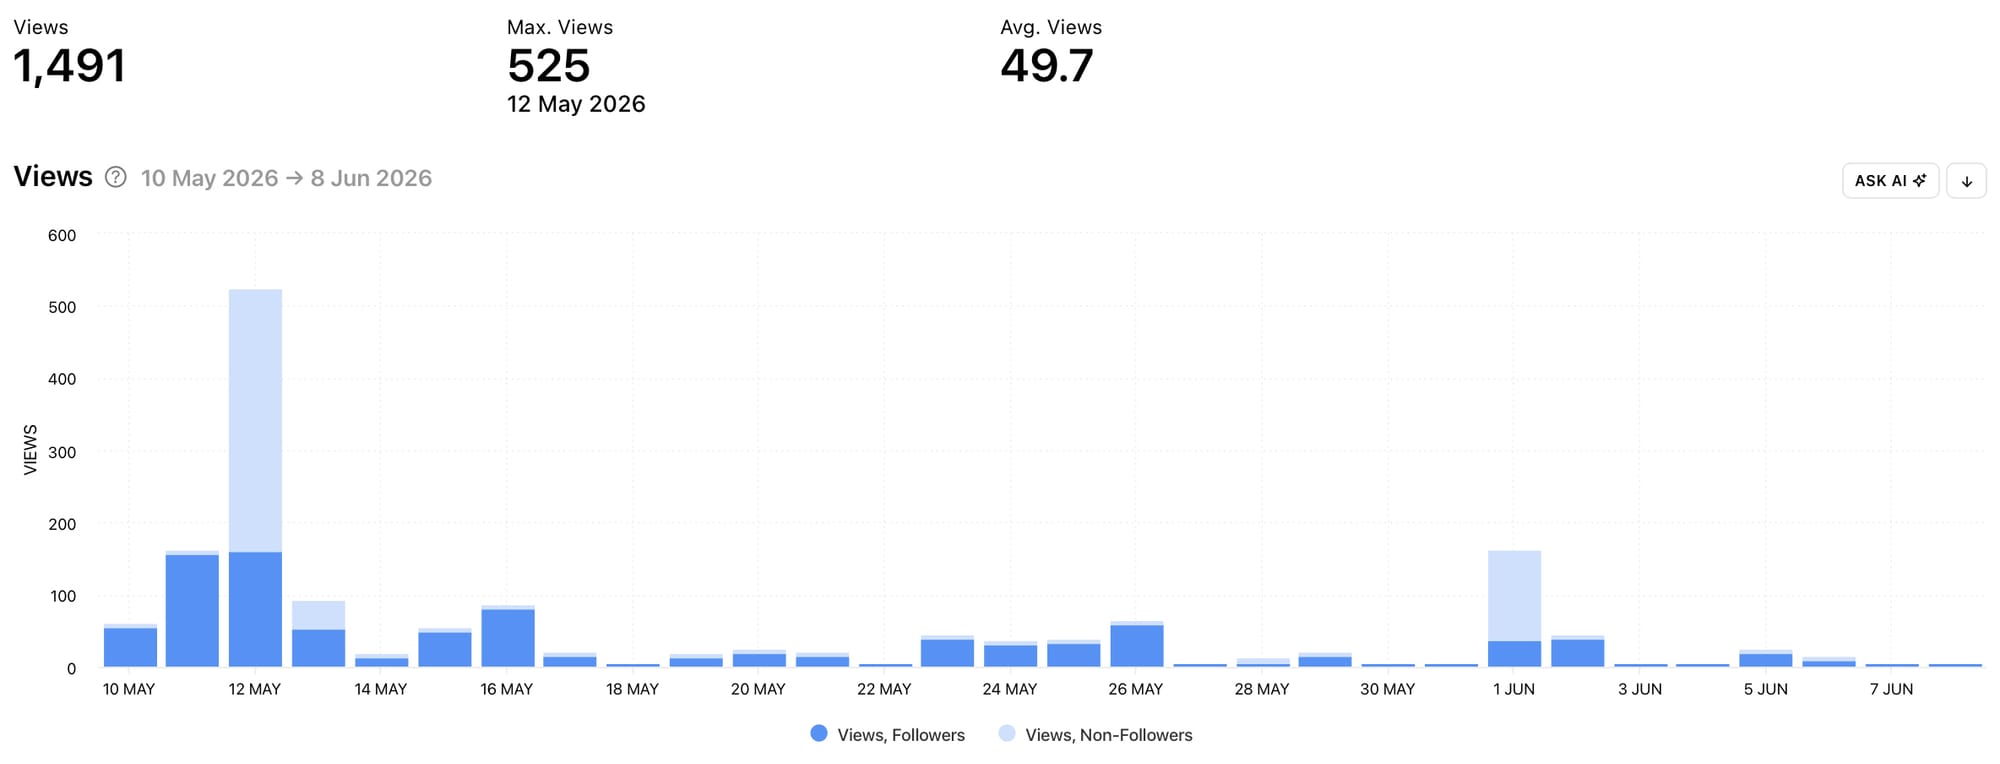
Did most of your views come from your followers or non-followers? If views spiked, did those peaks come from followers or non-followers? Which days sparked increased views and what content did you publish on those days? Use this information to drive more views across your profile as a whole.
Competitor Views
With Minter.io you can view competitor Instagram data to get insight on how your competitors are performing and how people are interacting with their content. This can help you come up with fresh ideas and content strategies based on what is working for other businesses in your field, as well as avoid pitfalls that competitors may have revealed.
Post Views
Head to the Posts section of your competitor Minter.io Instagram data to find the Post Views graph. Work with this graph in a similar way to your own Post Views graph, pinpointing spikes, noticing dips and getting curious about what led to the change in data. Use peaks in data to find content with high views and use it to inspire and shape your ideas around your own content.
Sort Posts by Views
Go straight to the All Posts section to view your competitor’s content by views. This will order your competitor’s posts from most to least viewed and make it easy to get inspiration based on the most-viewed posts. Consider the elements your competitor used in the posts with the most views. Look at the visual elements, sounds, captions, hooks, editing styles, colours, text overlays, themes and overall ideas. How can this inspire fresh content on your profile?
Ask AI
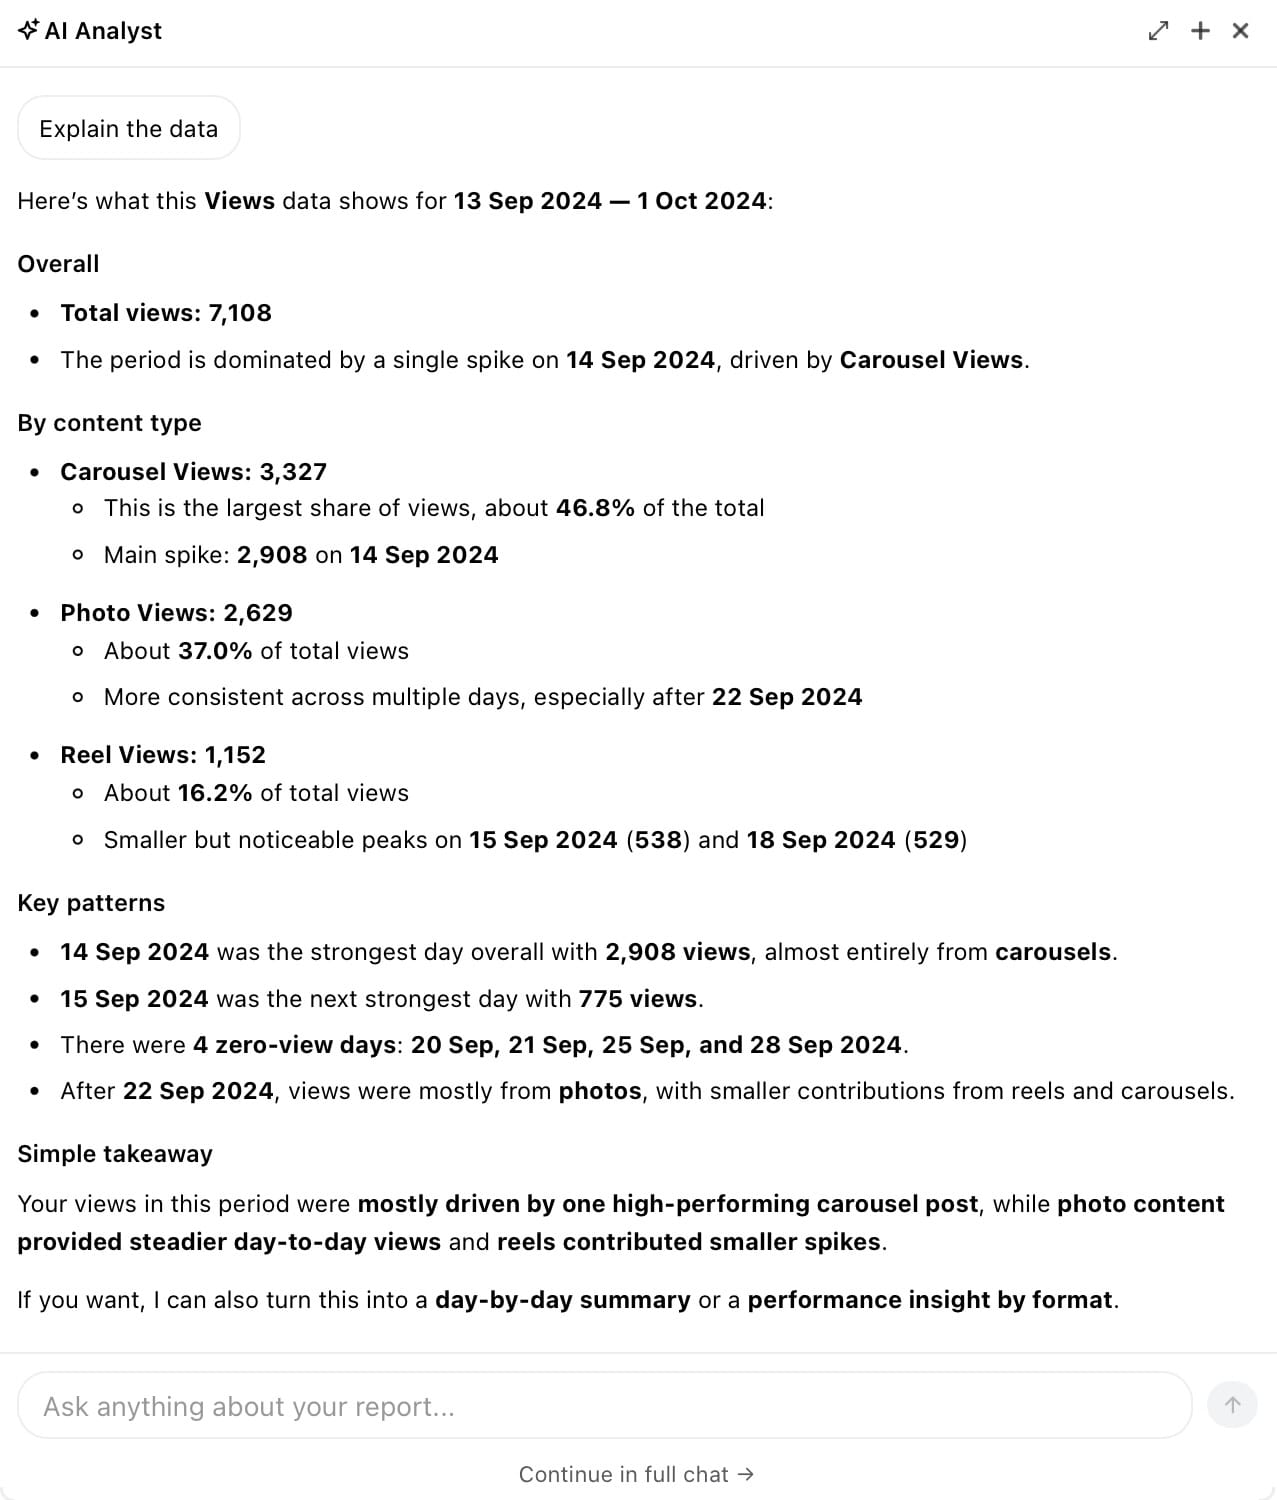
Select the Ask AI button next to any graph to get an explanation of the data powered by artificial intelligence. This is your speedy way to accelerated understanding of your views graphs and the data within them. Simply select the button and go with the prompt ‘Explain the data’ or insert a prompt of your own.
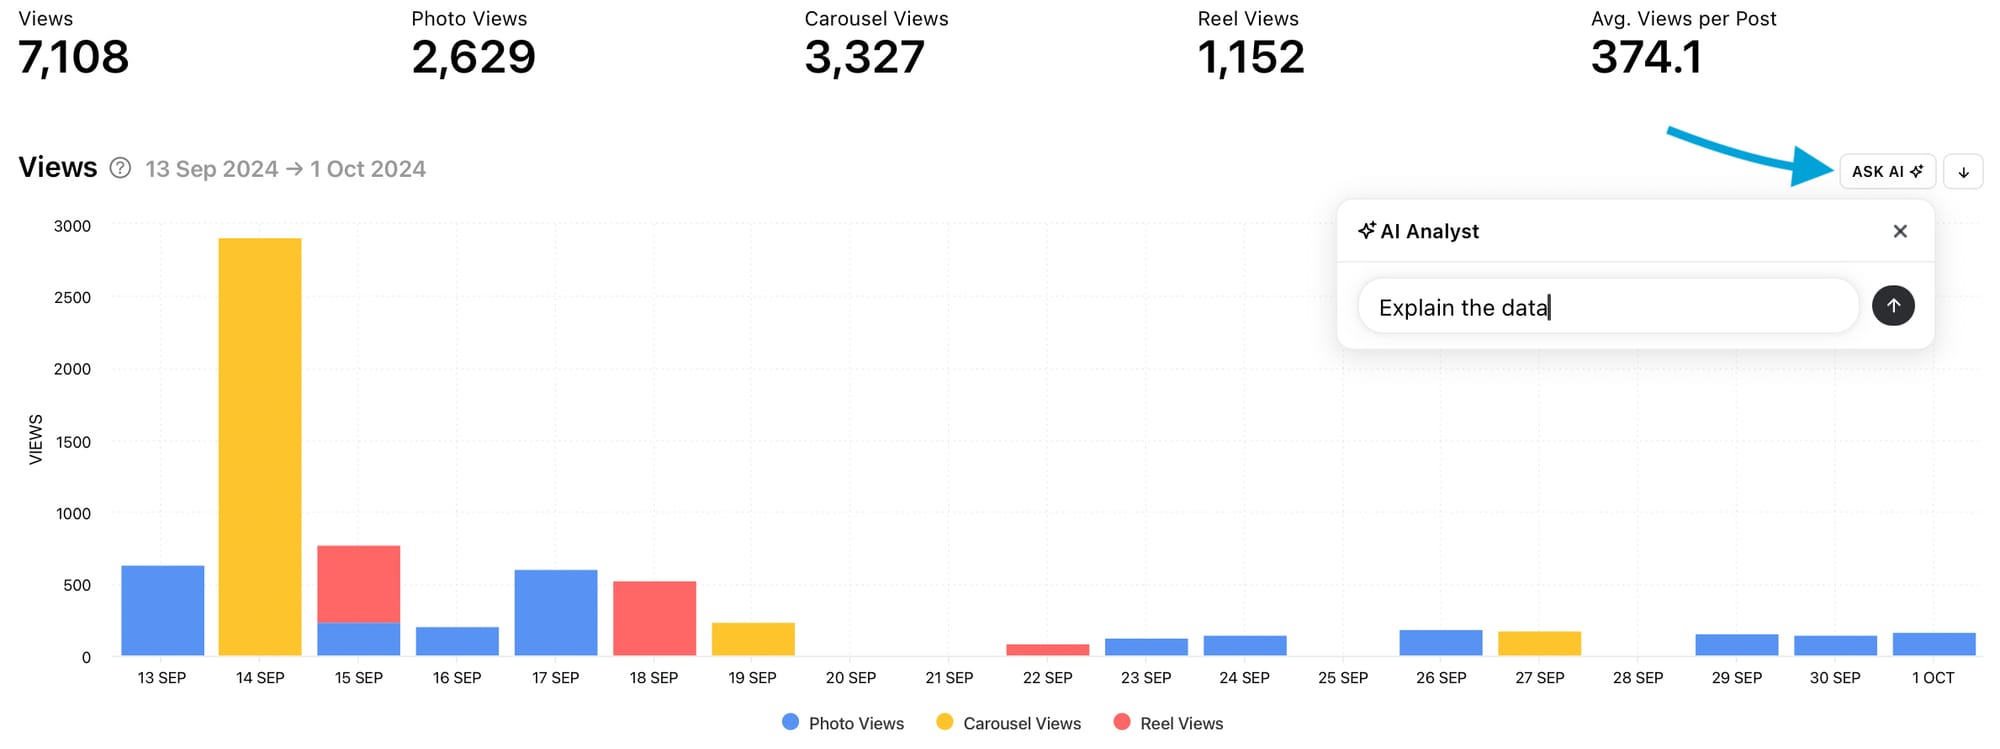
Continue the chat at the side of your chosen graph or head to the full AI Analyst for a dedicated experience of artificial intelligence assistance with your social media data.
AI Analyst
Whatever your social media focus, the Minter.io AI Analyst is here to help! Type in a prompt and let this artificial intelligence tool assist you in getting in-depth answers fast.
Consider one of these prompts to get you started:
- How has the amount of views on my posts changed this quarter?
- Create a 7-day content plan to get me more views
- What should I stop doing to help boost the amount of views on my content
- How can I optimise my stories posts for views
- When should I post to encourage more views on my content?
With Minter.io you can get your hands on all the graphs in this article and use the information to make smart choices about your upcoming content. Explore social media data across your social media accounts (including Instagram, TikTok, Facebook, X, LinkedIn and Threads), check out competitor data and track hashtags with Minter.io - try it today!